AWS Solution Architecture
Helps improve AWS architectures per AWS best practices.
4 likes
121 uses
Bring everyone into your vision with our mapping and diagramming templates collection. Create diagrams, concept maps, and system mapping templates to communicate complex flows, creating a shared understanding.
AI Collaborators designed with specific skills like research, planning, or diagramming.
Helps improve AWS architectures per AWS best practices.

Create diagrams and docs for good software design.
518 templates
User Flow Template
User flows are diagrams that help UX and product teams map out the logical path a user should take when interacting with a system. As a visual tool, the user flow shows the relationship between a website or app’s functionality, potential actions a user could take, and the outcome of what the user decides to do. User flows help you understand what a user does to finish a task or complete a goal through your product or experience.
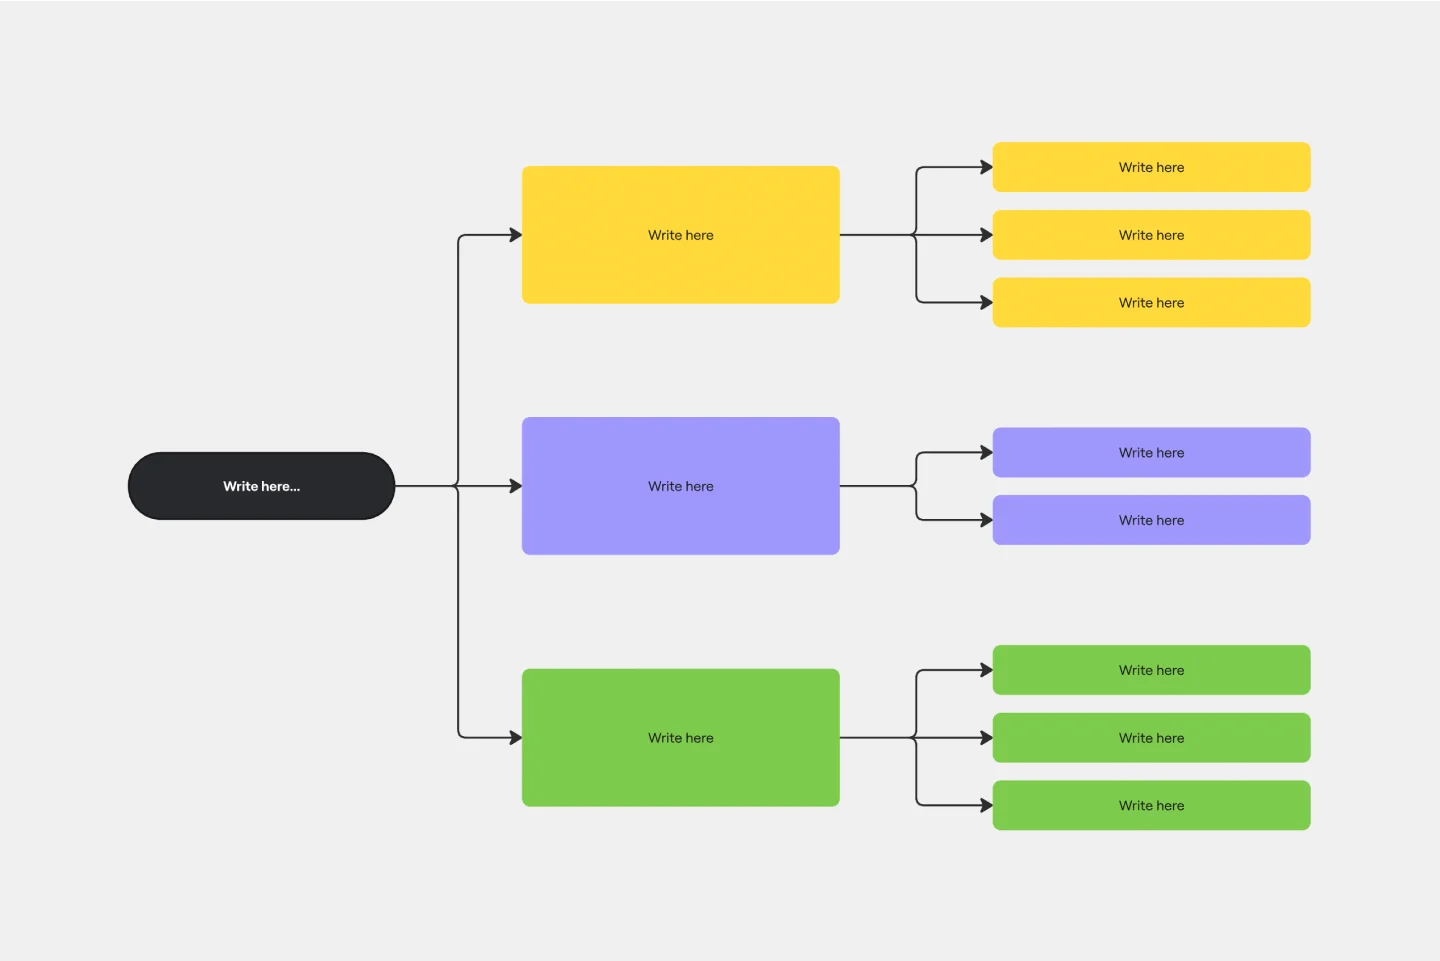
Brace Map Template
Transform your brainstorming and planning tasks with Miro's Brace Map Template. This powerful visual thinking tool clarifies complex concepts by creating a visual hierarchy that organizes each element precisely. The central idea connects seamlessly to sub-elements through intuitive braces, providing an easily understandable framework. This clarity enhances individual understanding and fosters collaborative efforts, allowing teams to navigate complex ideas with precision and coherence. The Brace Map Template will enable you to organize your thoughts efficiently and solve complexities visually.
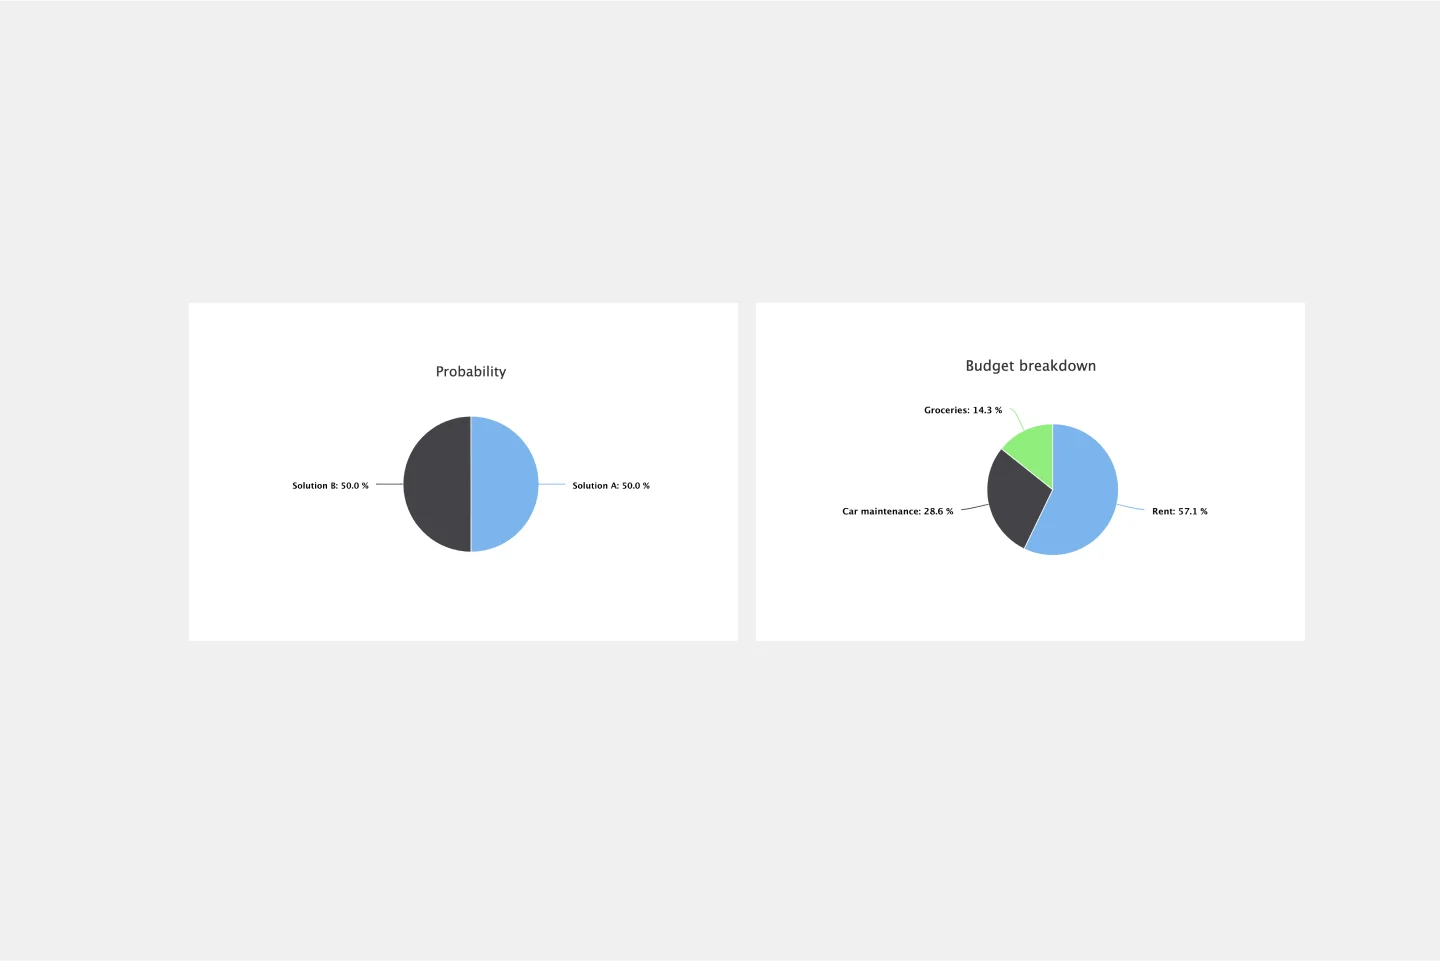
Pie Chart Template
Pie charts are an excellent way to present relationships between datasets graphically, where you can quickly compare information and see contrast right away. Professionals from many fields use pie charts to support their presentations and enrich their storytelling as it’s one of the most commonly used data charts.
AI Accelerated
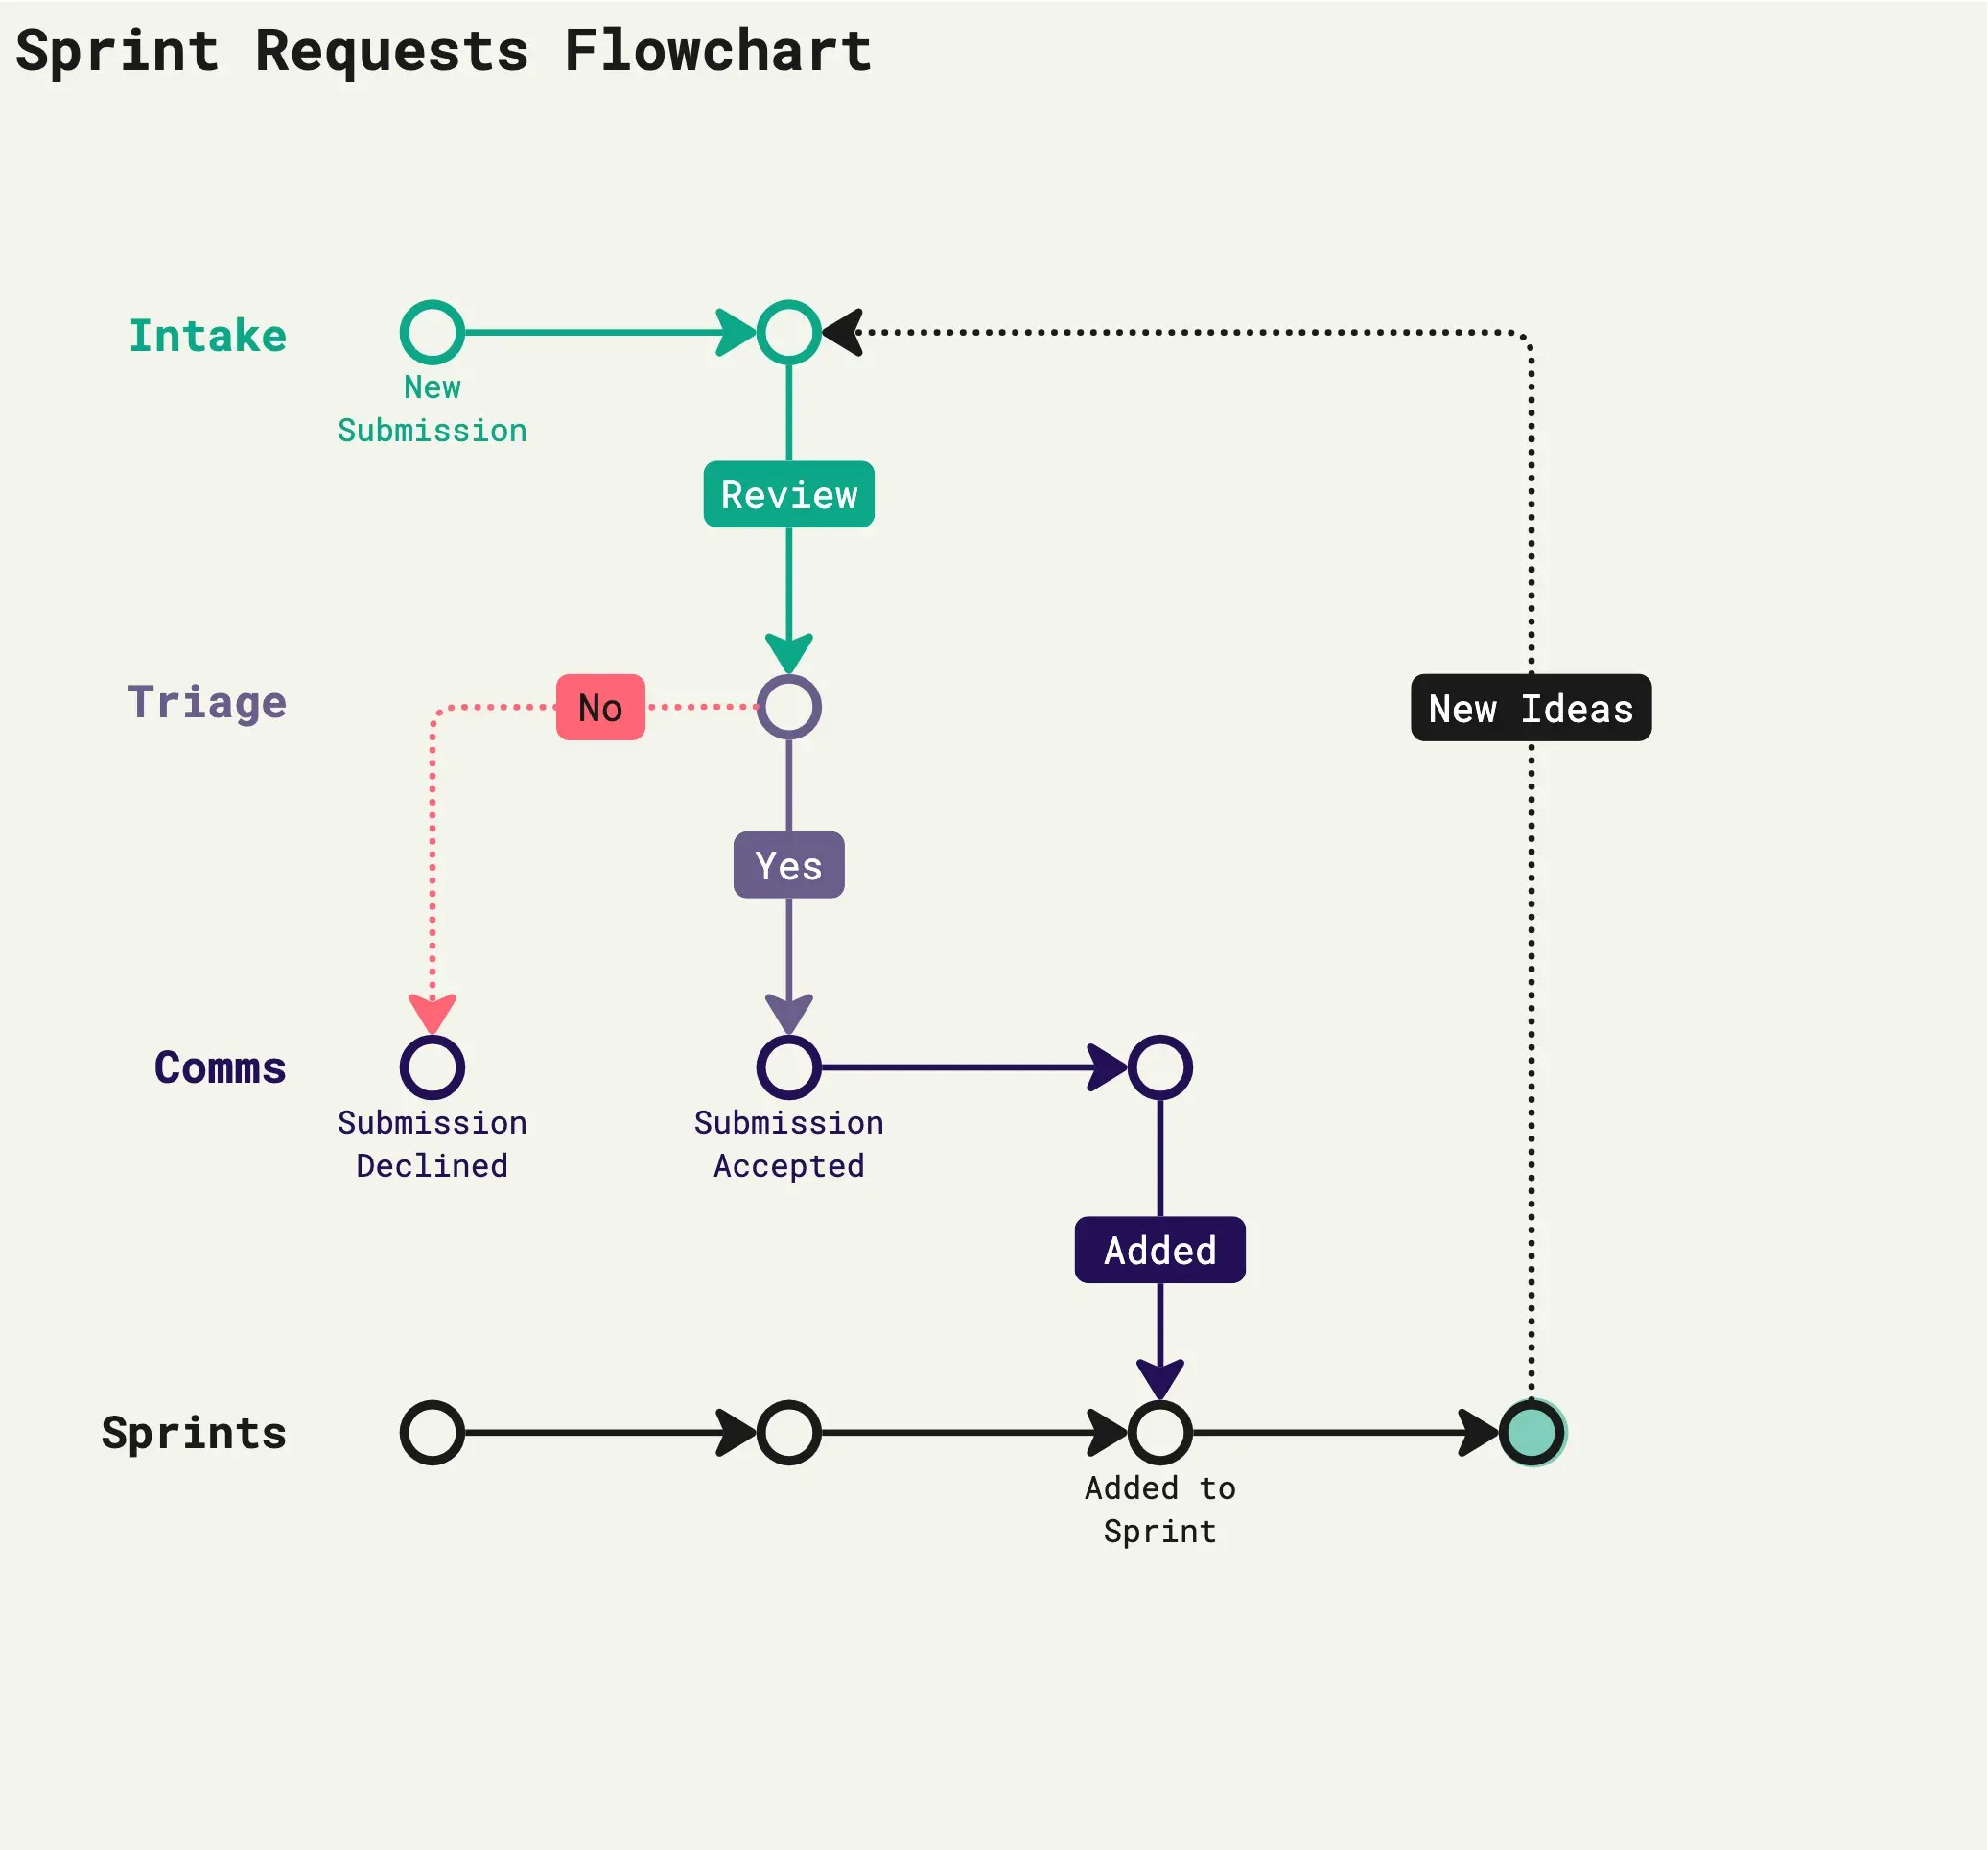
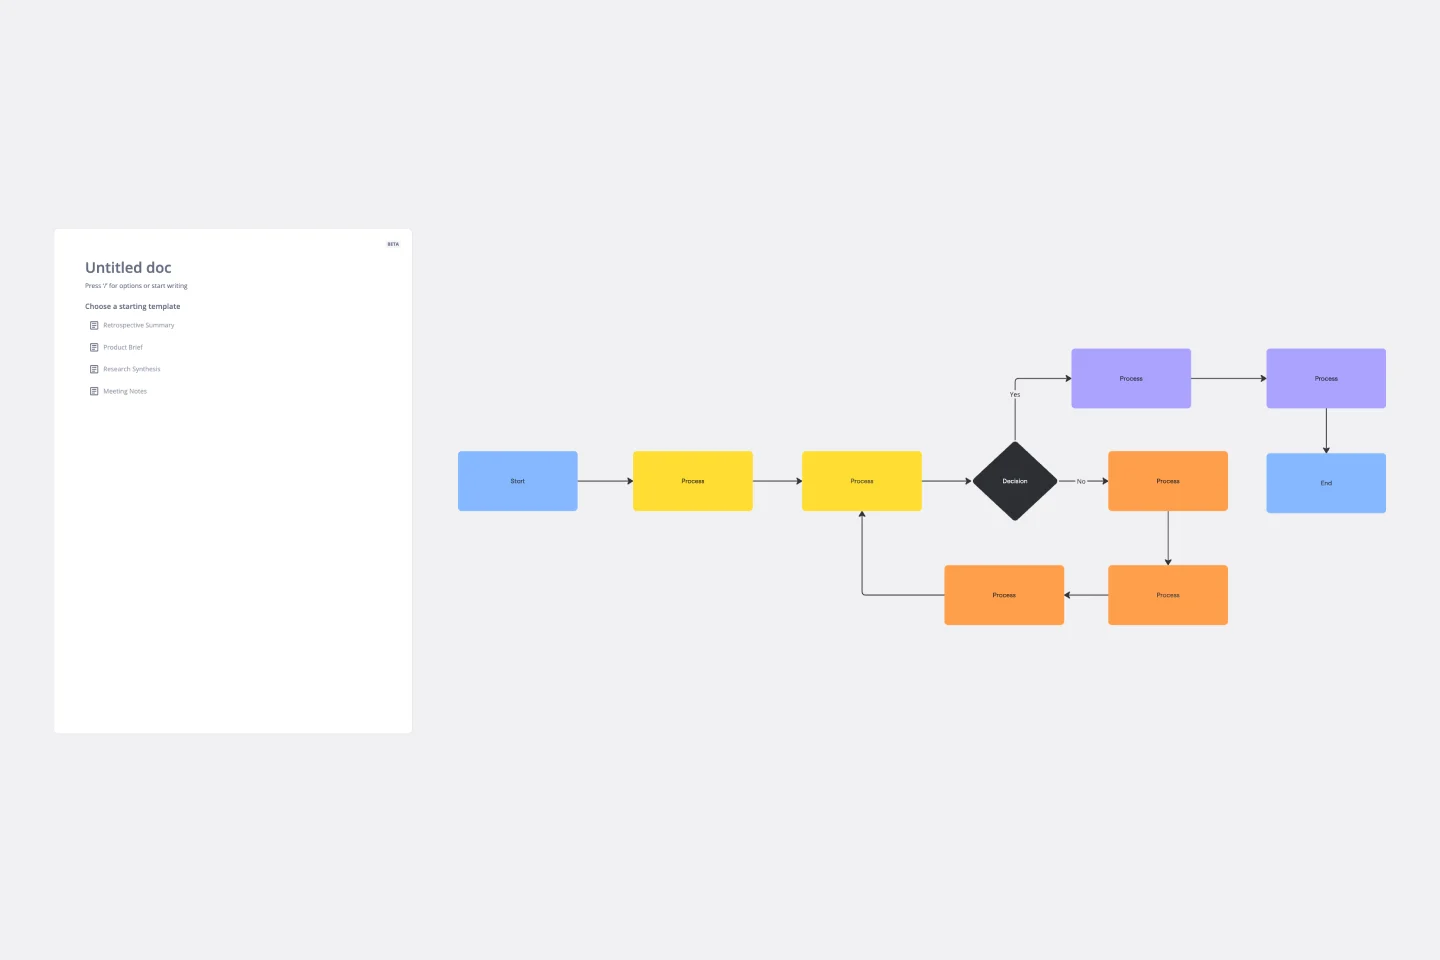
Flowchart AI Template
Trying to explain a process or workflow to your team — or just wrap your head around it yourself? Sometimes the best way is to see it, and that’s when you create a flowchart. Using common shapes (generally just ovals, rectangles, diamonds, and arrows), a flowchart shows you the direction a process or workflow goes and the order of steps. Beyond giving you a clear understanding, you’ll also be able to see potential flaws and bottlenecks, which helps you refine and improve your process and create a better product more efficiently.
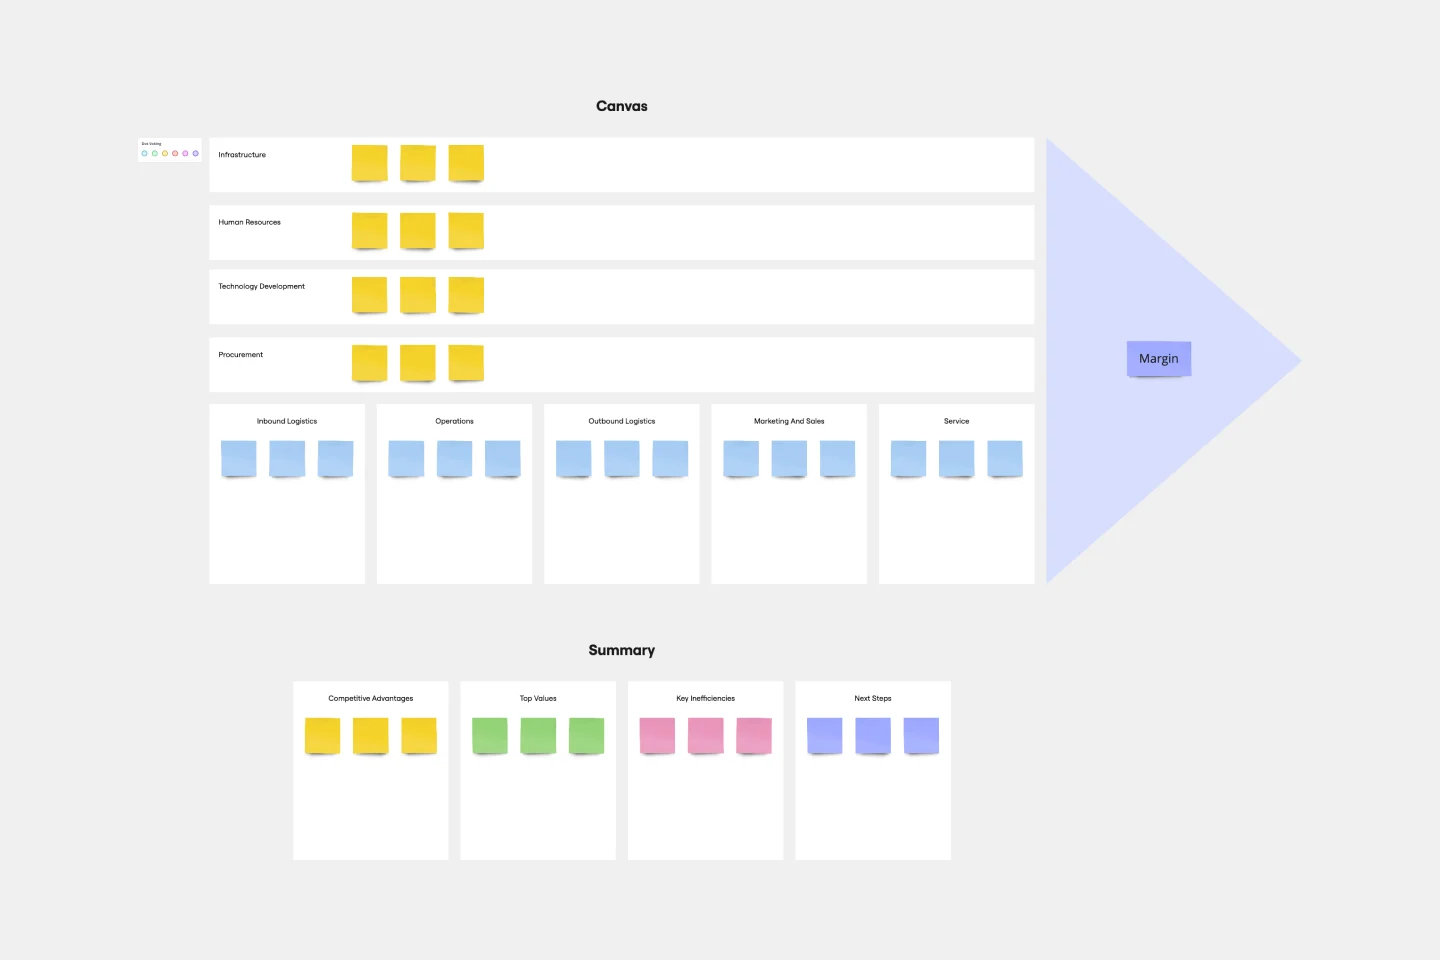
Value Chain Analysis Template
First coined by Harvard Business School professor Michael Porter, the value chain analysis helps your team evaluate your business activities so you can find ways to improve your competitive advantage. A value chain is a set of activities that a company performs in order to deliver a valuable product from start to finish. The analysis itself allows your team to visualize all the business activities involved in creating the product—and helps you identify inefficiencies, bottlenecks, and miscommunication within the process.
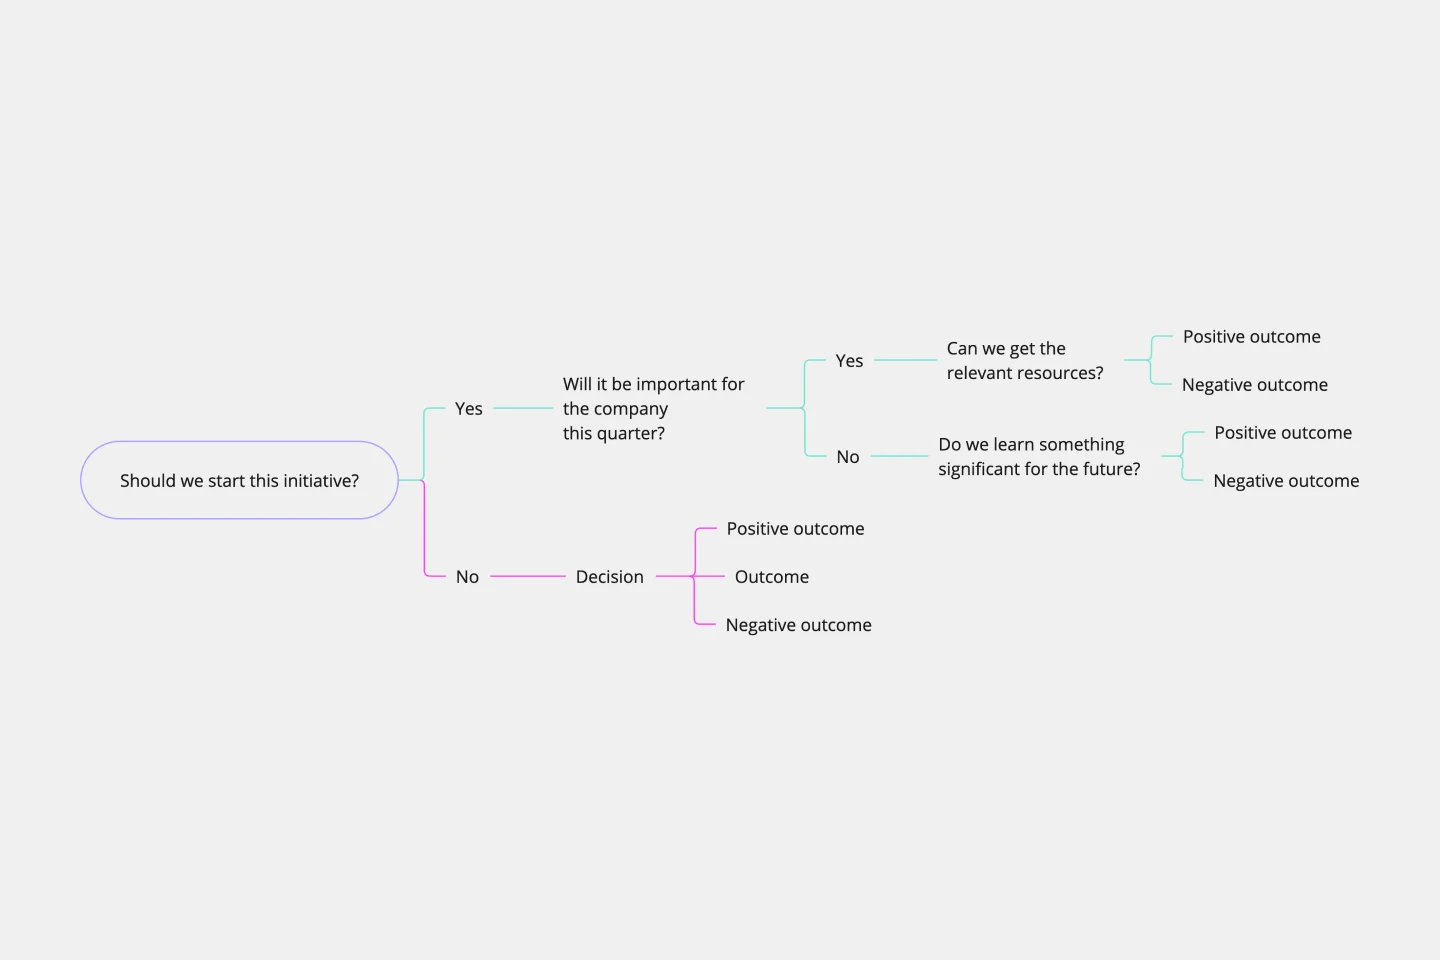
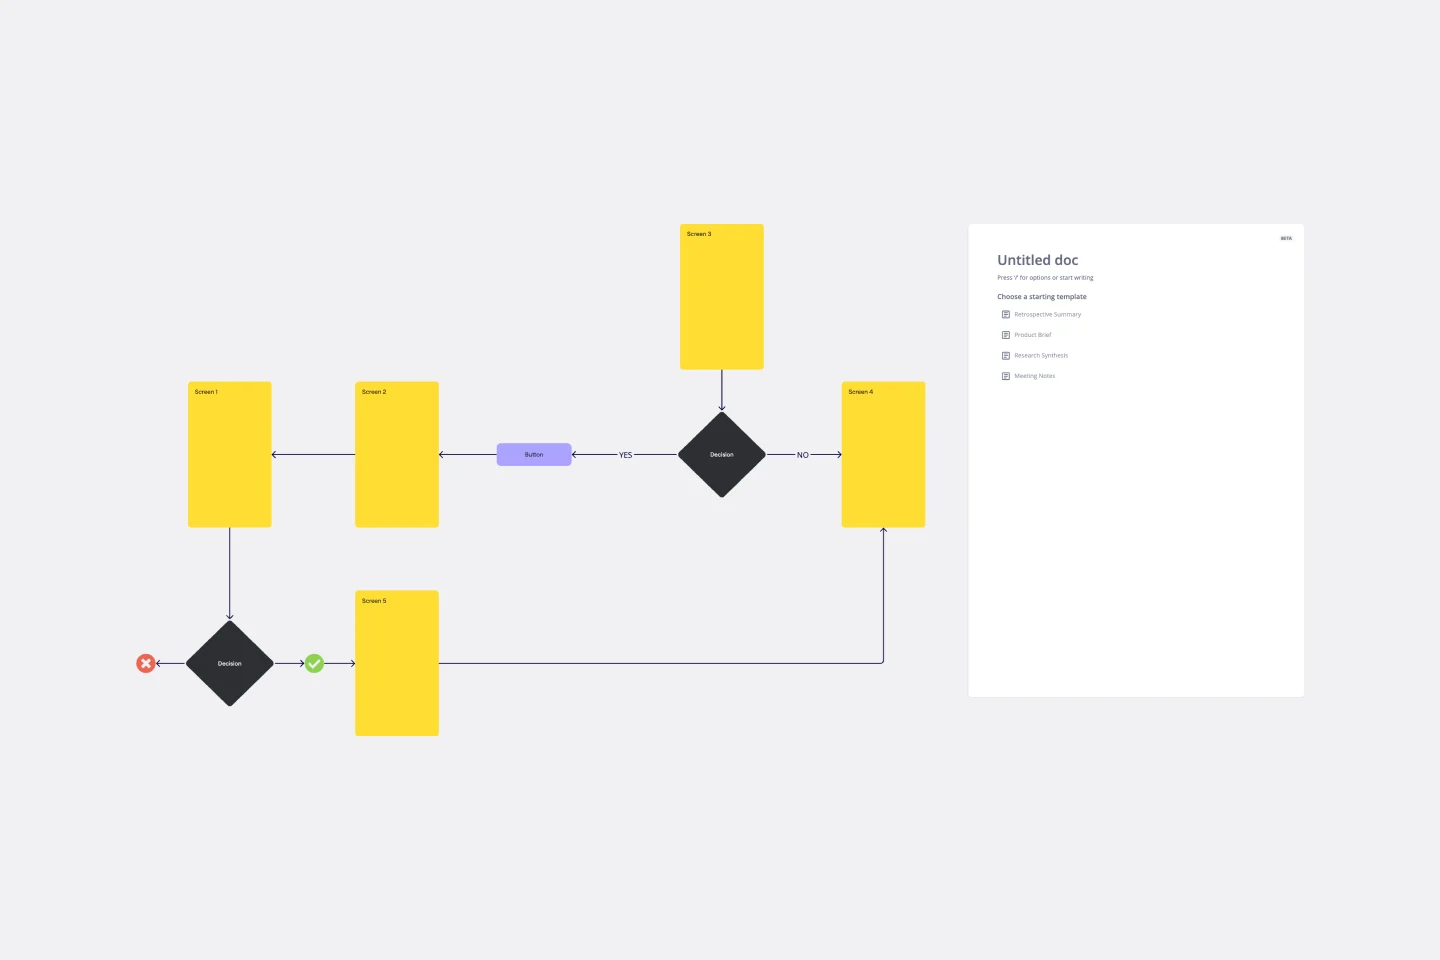
Decision Tree Template
Making difficult decisions gets easier when you can look clearly at your choices and visualize the outcomes. That’s just what a decision tree will help you do, empowering you to invest your time and money with confidence. A decision tree is a flowchart that looks just how you’d imagine—with “branches” that represent your available choices. It provides a stylized way to play out a series of decisions and see where they lead before you commit your real-world resources, which is especially valuable for startups and smaller companies.
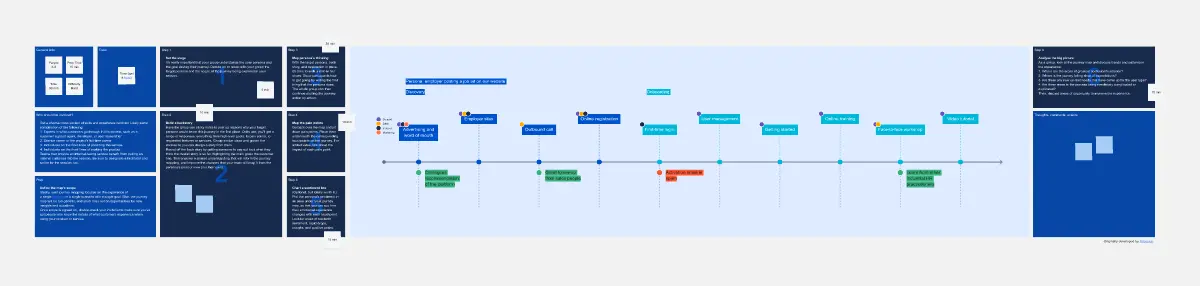
Customer Journey Mapping
Guidelines for Customer Journey Mapping.
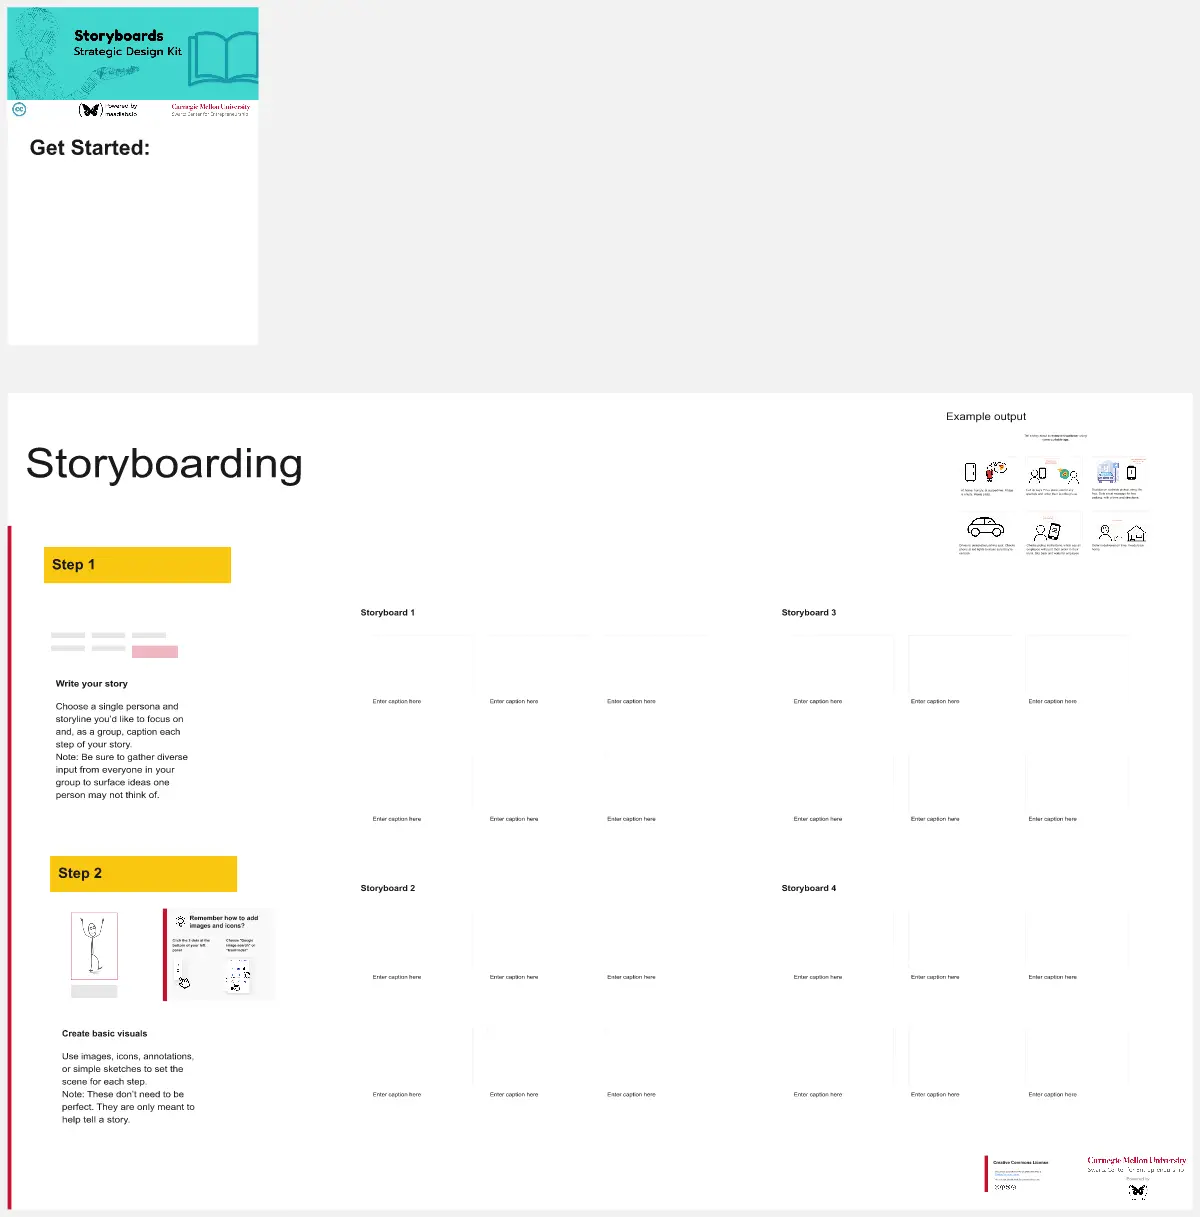
Storyboards
Simplify your story creation process with Storyboards by maad labs. This template offers a user-friendly interface for mapping out your narrative projects, making it ideal for both beginners and seasoned professionals. It includes sections for scene descriptions, character notes, and dialogue, helping you to organize your ideas and present them clearly. Use this template to enhance your storytelling workflow and bring your creative visions to life with ease
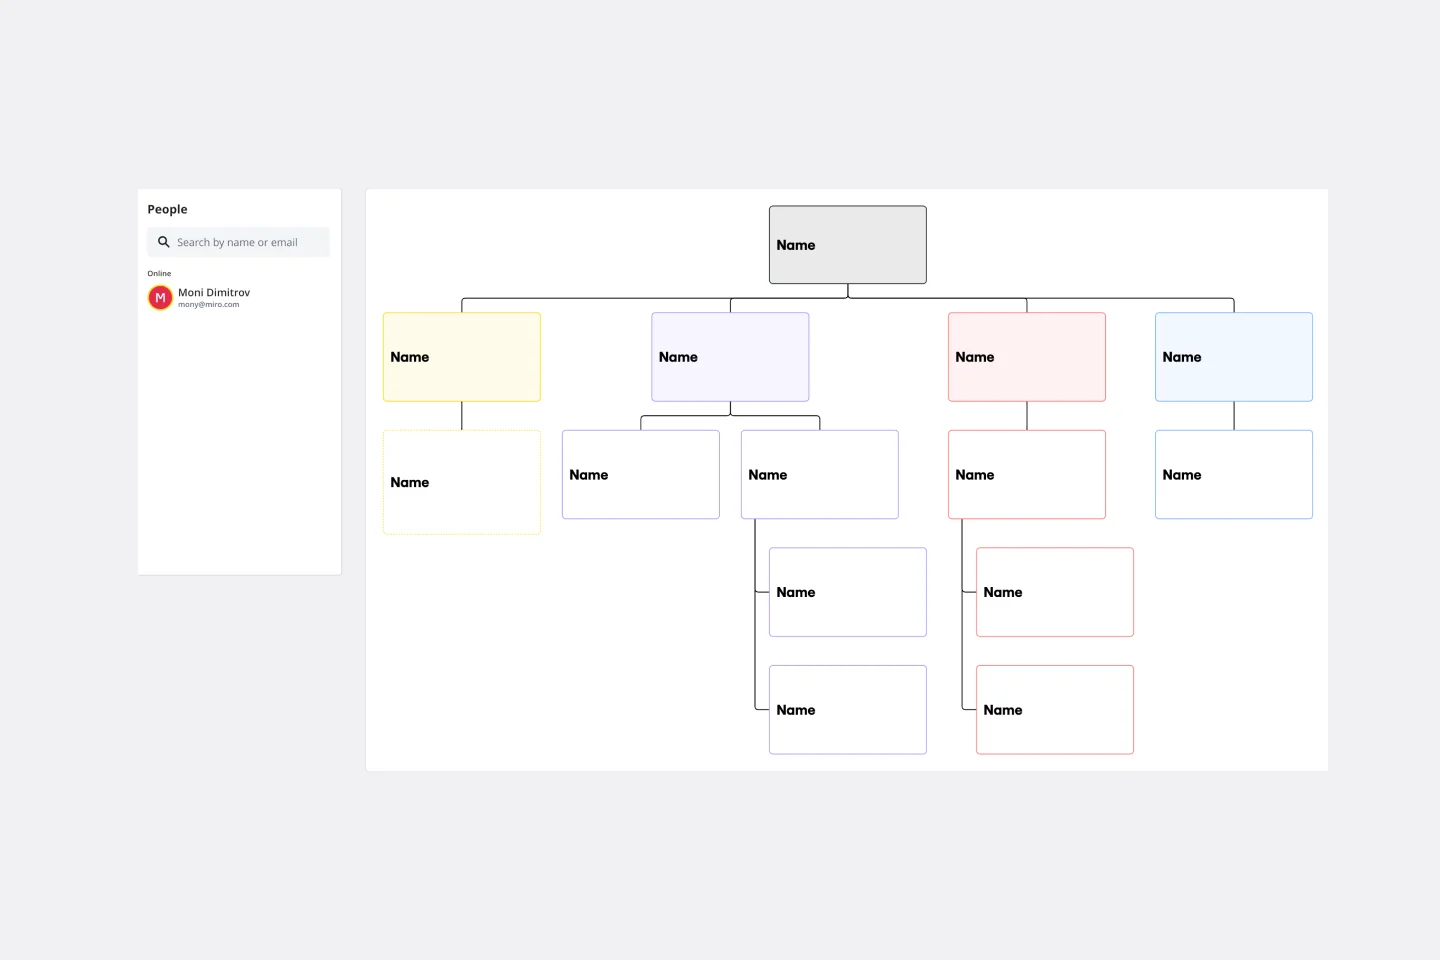
Company Organizational Chart
An org chart is a visual guide that sums up a company’s structure at a glance—who reports to whom and who manages what teams. But it does more than just display the chain of command. It also showcases the structure of different departments and informs employees who to reach out to with issues and concerns. That makes it an especially valuable tool for new hires who are getting familiar with the company. Our templates make it easy for you to add your entire team and customize the chart with colors and shapes.
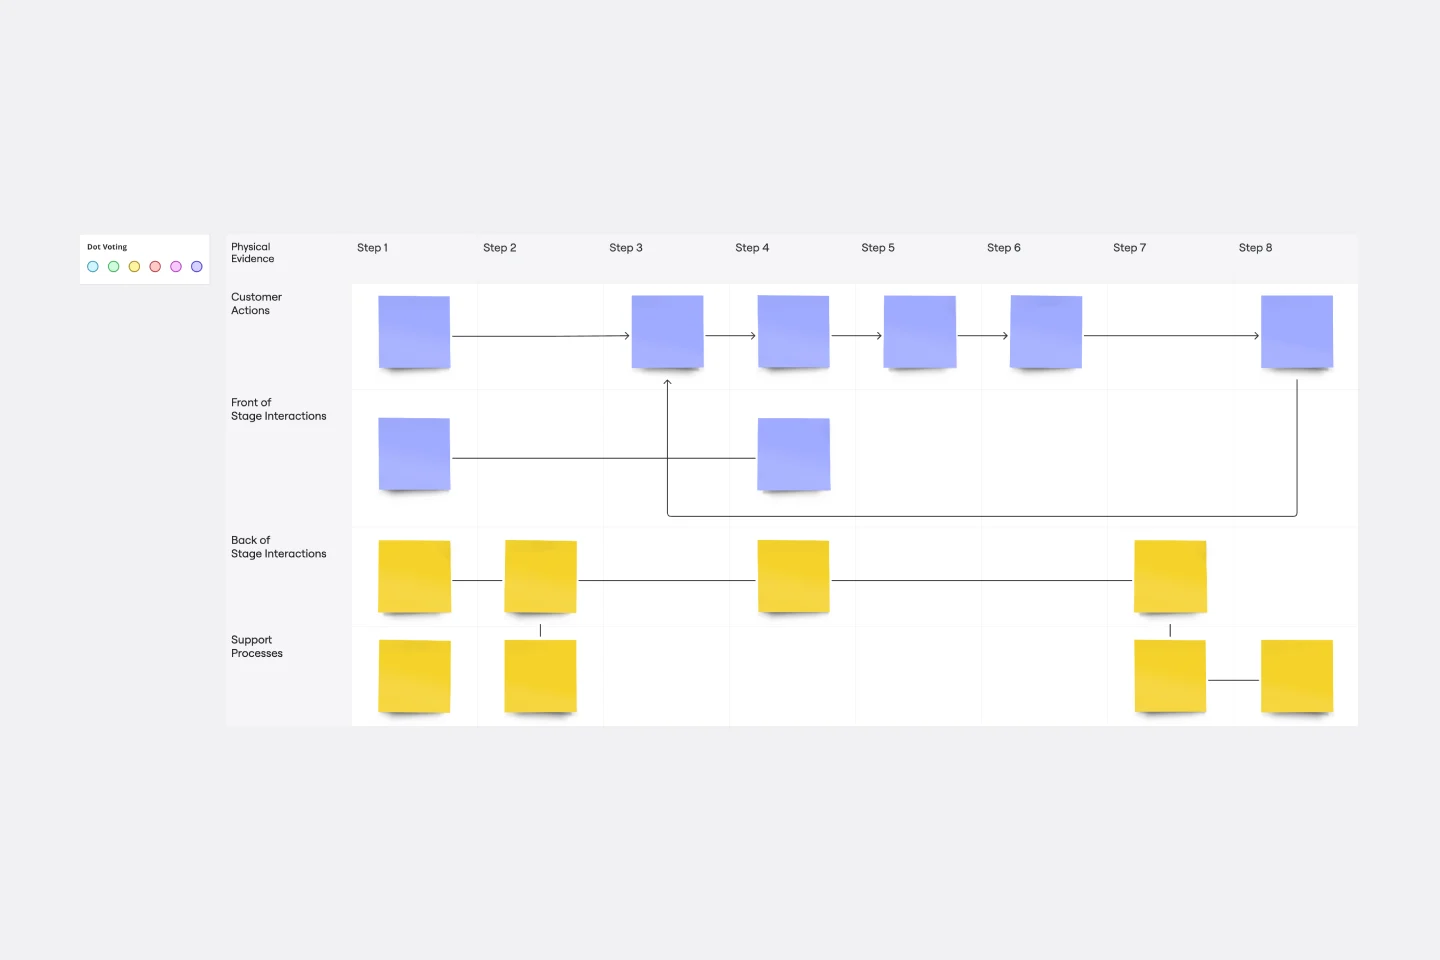
Service Blueprint Template
The Service Blueprint template is a visual tool for designing and optimizing service experiences. It provides a structured framework for mapping customer journeys, identifying touchpoints, and aligning internal processes. This template enables teams to visualize the entire service ecosystem, uncover pain points, and innovate solutions to enhance customer satisfaction. By promoting customer-centricity and collaboration, the Service Blueprint empowers organizations to deliver exceptional service experiences and drive sustainable growth.
AI Accelerated
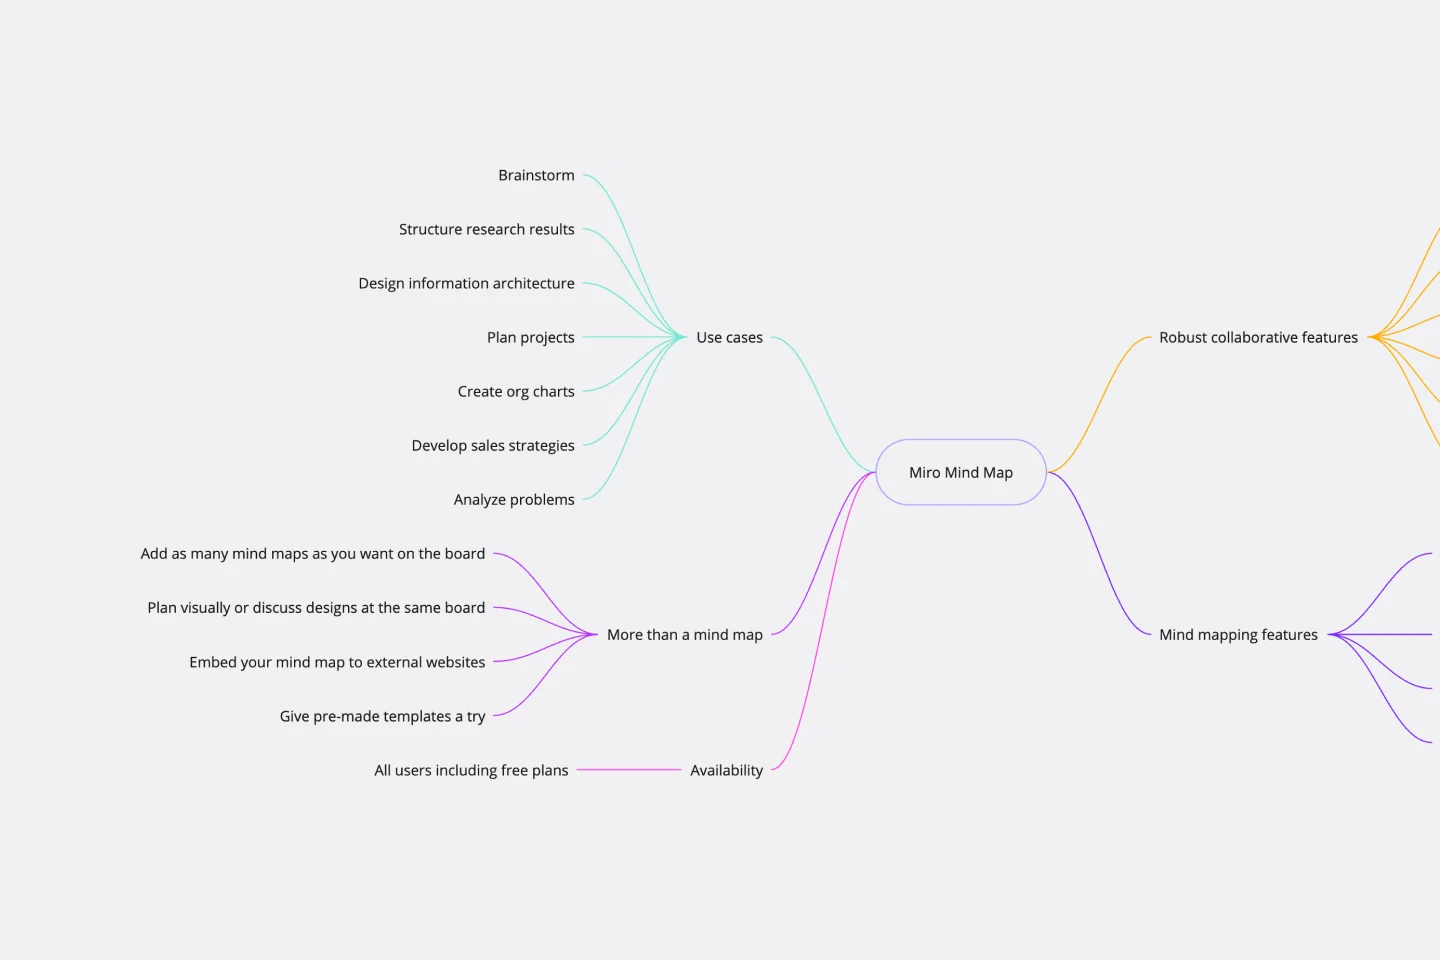
Mind Map AI Template
We see you, visual learners. You grasp concepts and understand data easier when they're presented in well-organized, memorable graphics. Mind mapping is perfect for you. This powerful brainstorming tool presents concepts or ideas as a tree — with the central subject as the trunk and your many ideas and subtopics as the branches. This template is a fast, effective way for you to start mind mapping, which can help you and your team become more creative, remember more, and solve problems more effectively.
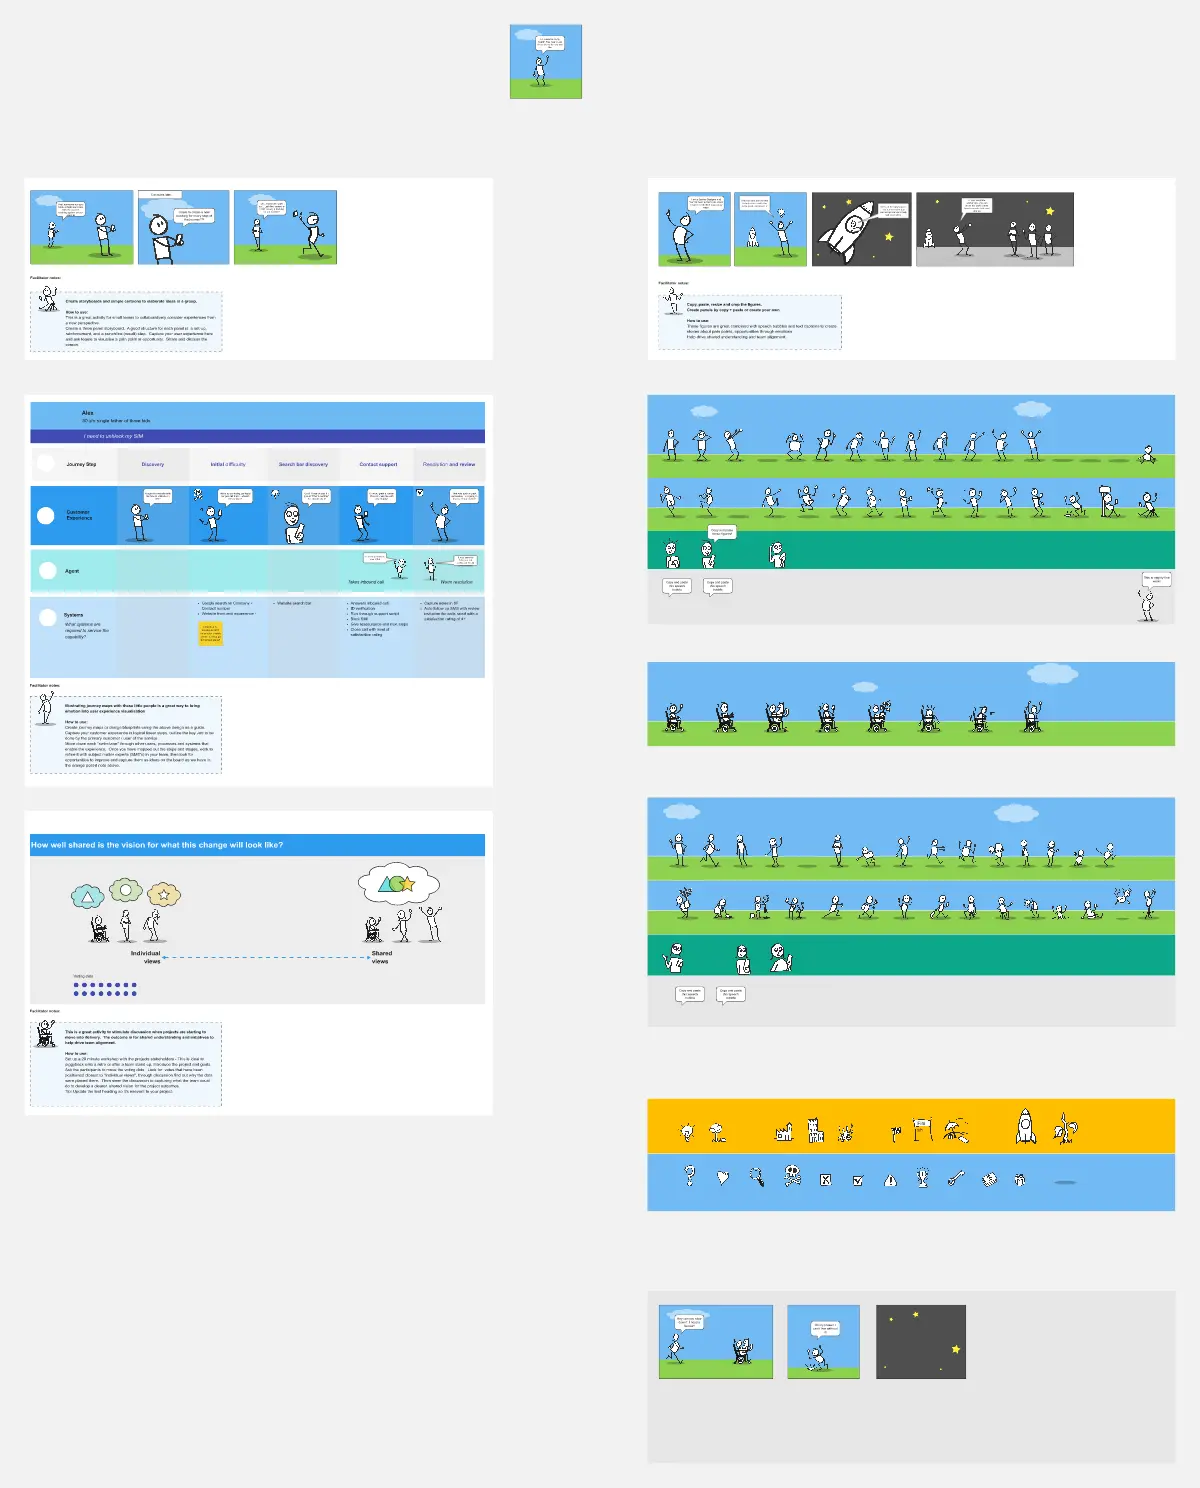
Storyboarding, Journey Mapping, and Alignment
This template has three activities that are great for workshopping in virtual team environments.
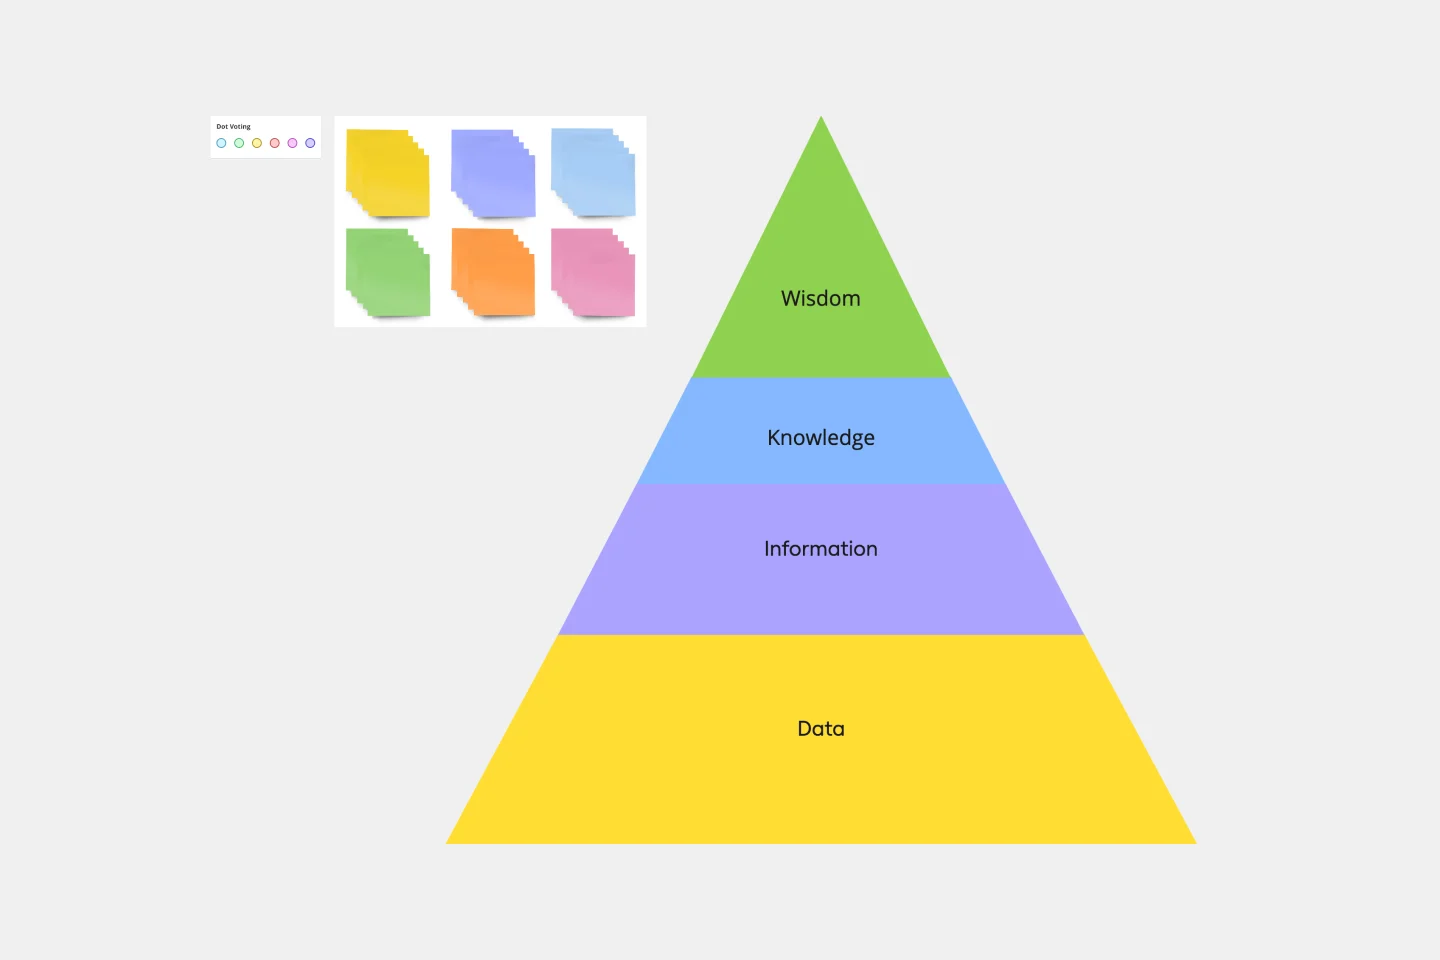
Pyramid Diagram Template
A pyramid diagram is a perfect tool for demonstrating concepts that can be broken down into a layered hierarchy. Each level of the pyramid builds on the one before it, clearly illustrating how certain actions lead to specific results. The Miro Pyramid Diagram template is your tool for any and all pyramid illustrations.
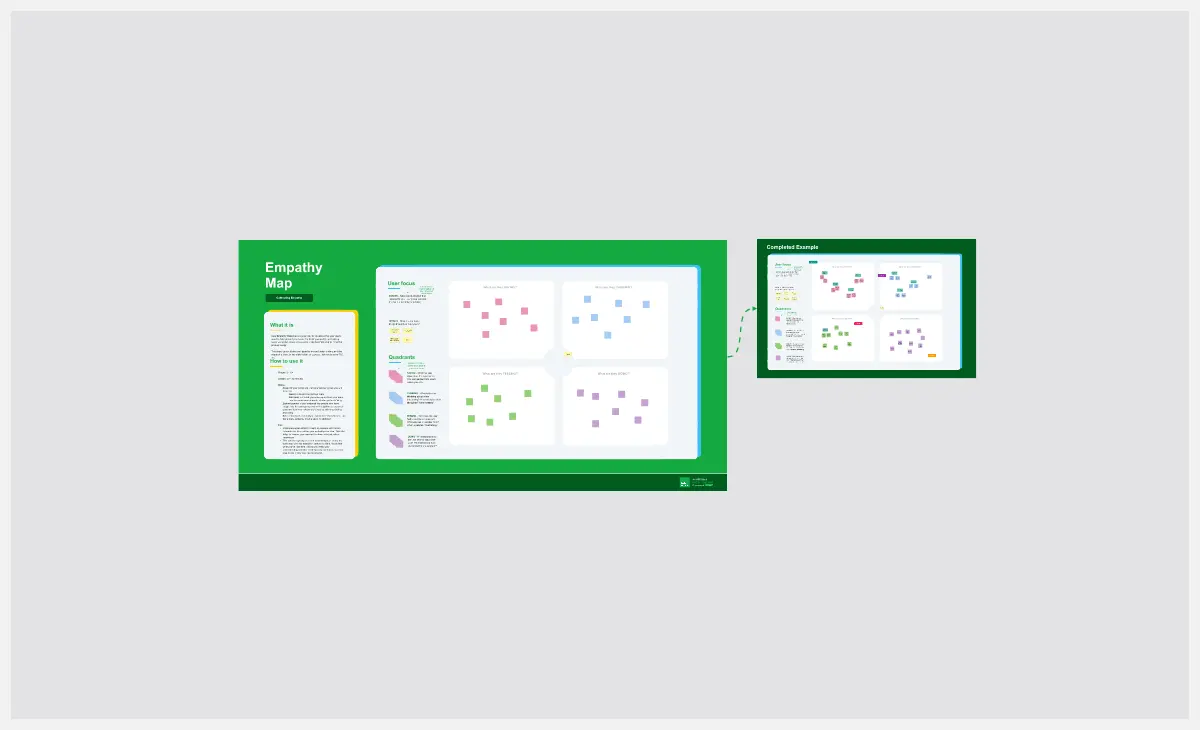
User Empathy Map
User Empathy Map template helps you visualize user experiences and needs. It’s an essential tool for teams looking to design products that resonate with their users. Use this template to build empathy and improve user satisfaction.
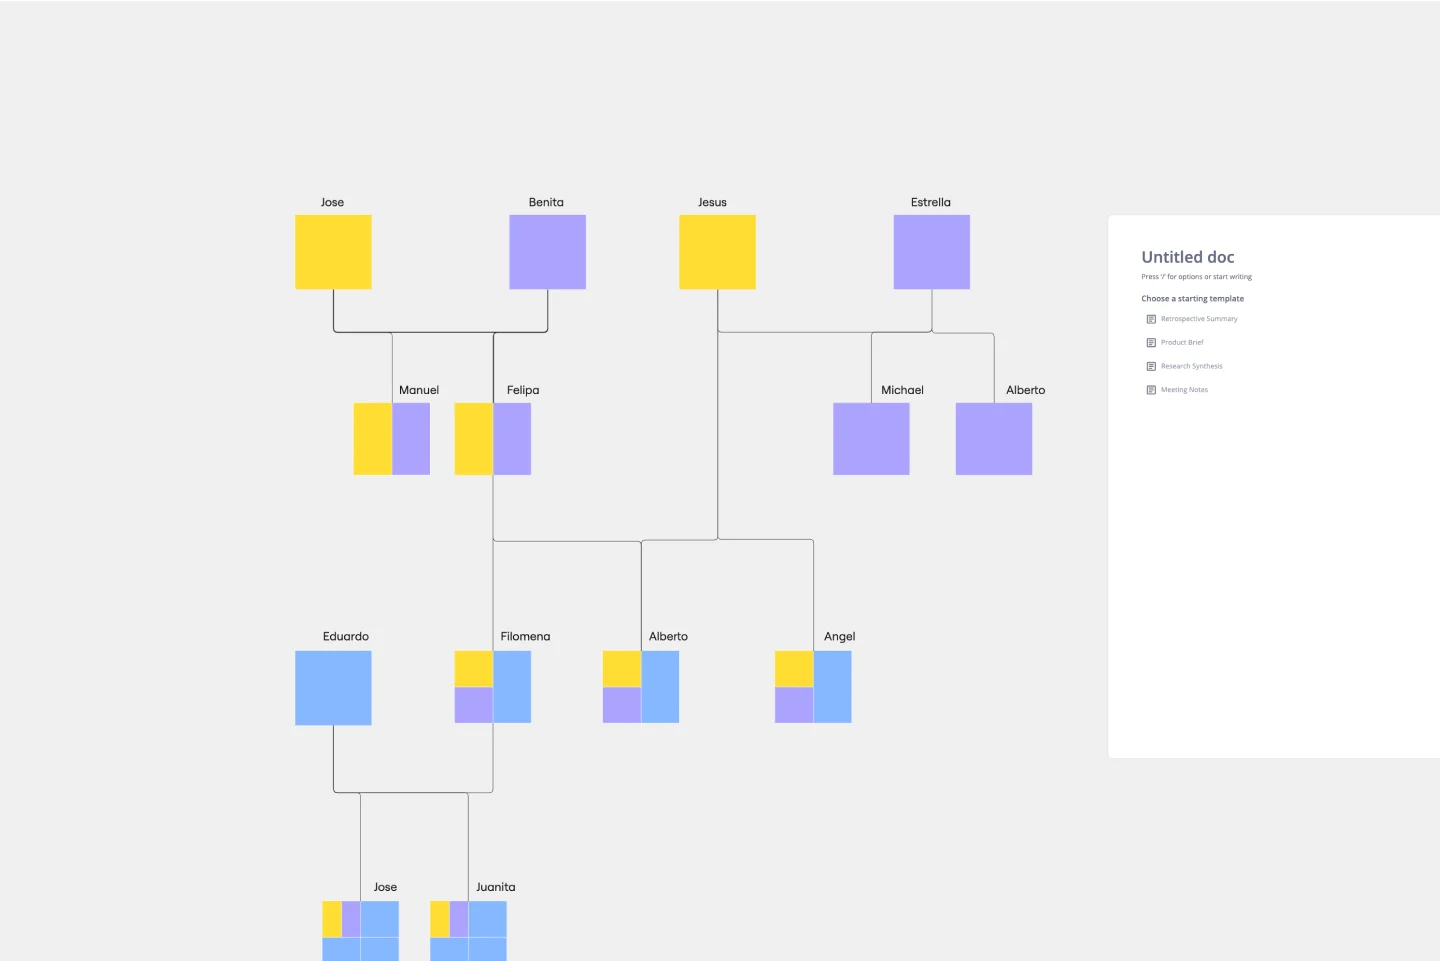
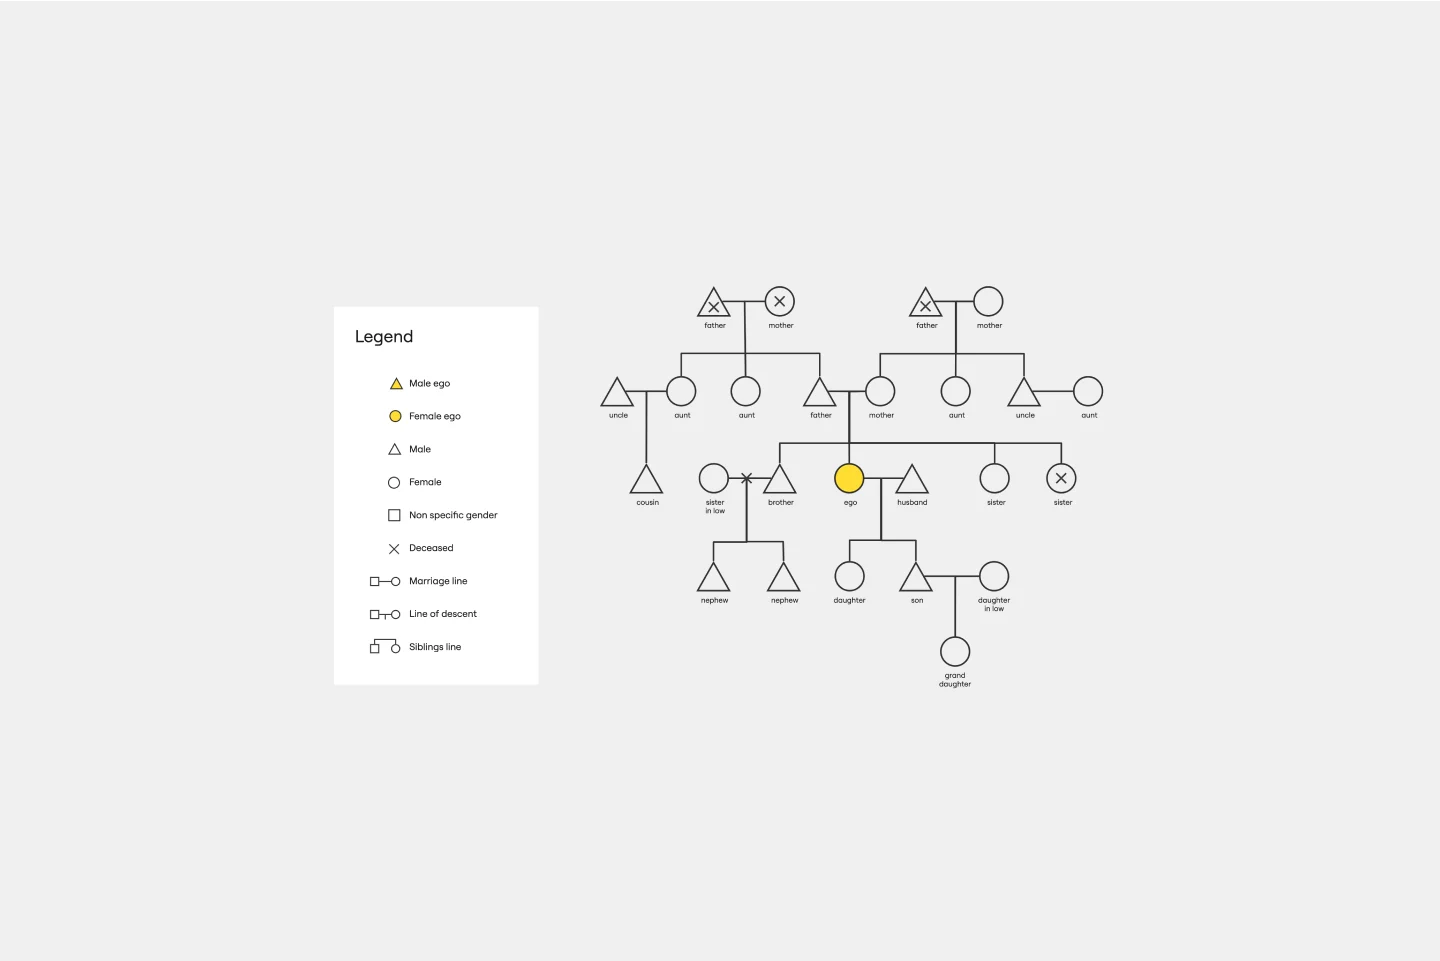
Genogram Template
The Genogram Template maps out family structures and relationships with exceptional depth and detail. Unlike traditional family trees, this template provides a comprehensive perspective by encapsulating familial connections, emotional ties, and significant life events. Create a genogram to unearth patterns and trends within a family, whether hereditary or environmental. Professionals across different domains can gain a holistic understanding of familial dynamics by showing deep insights into the nuances of relationships, facilitating better communication and problem-solving.
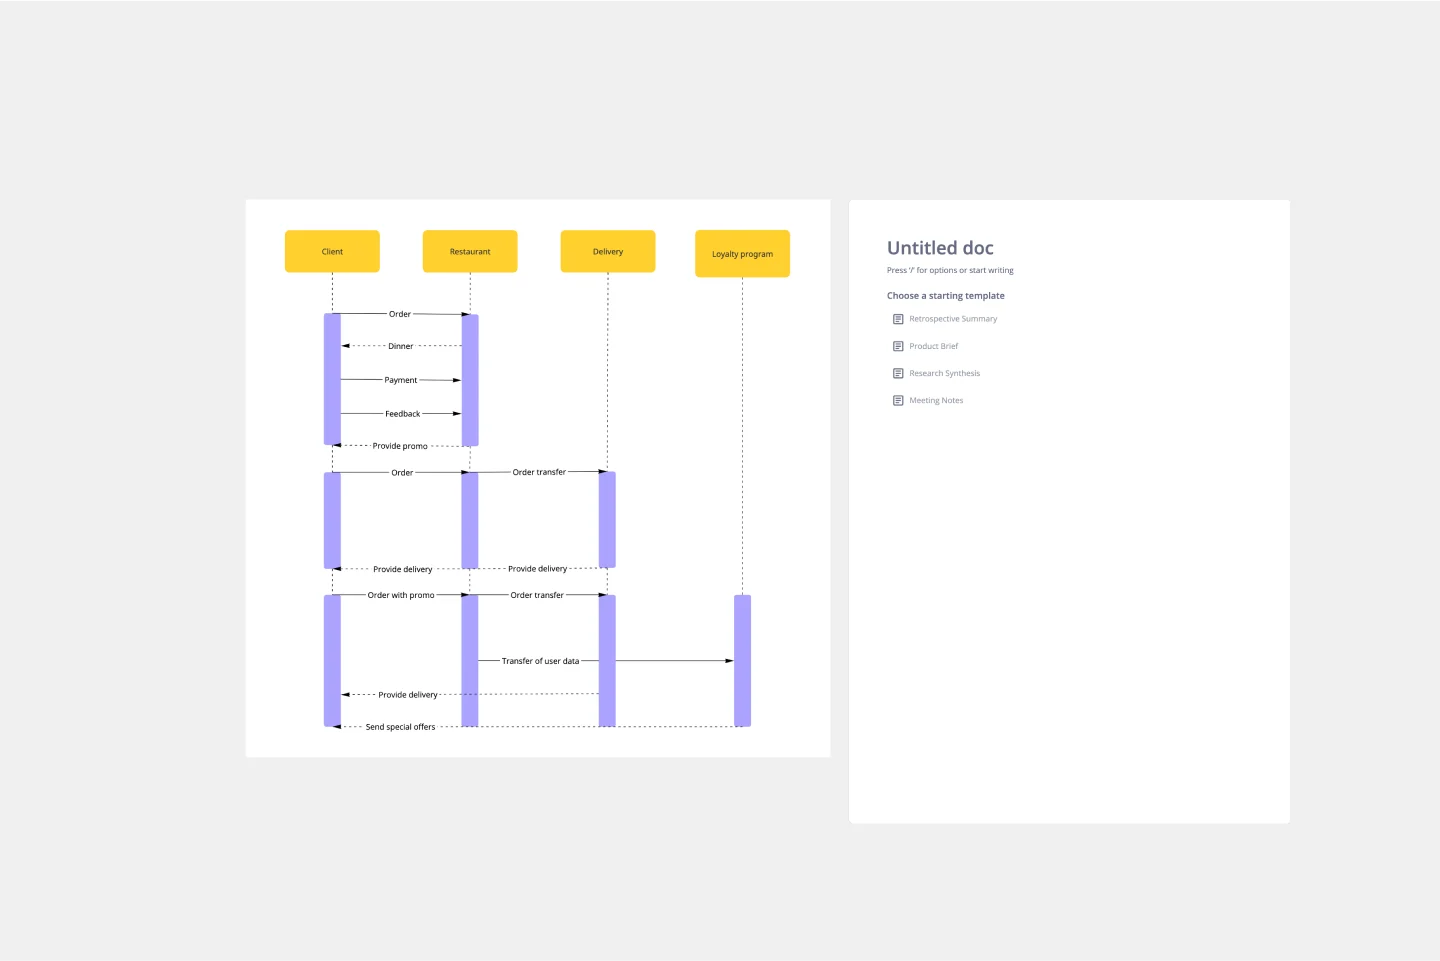
UML Sequence Diagram Template
Analyze and showcase how external entities interact with your system using a sequence diagram. Get a bird’s-eye view of your work processes, business functions, and customer interactions using this diagram. Also, identify any potential problems early and solve them before implementation.
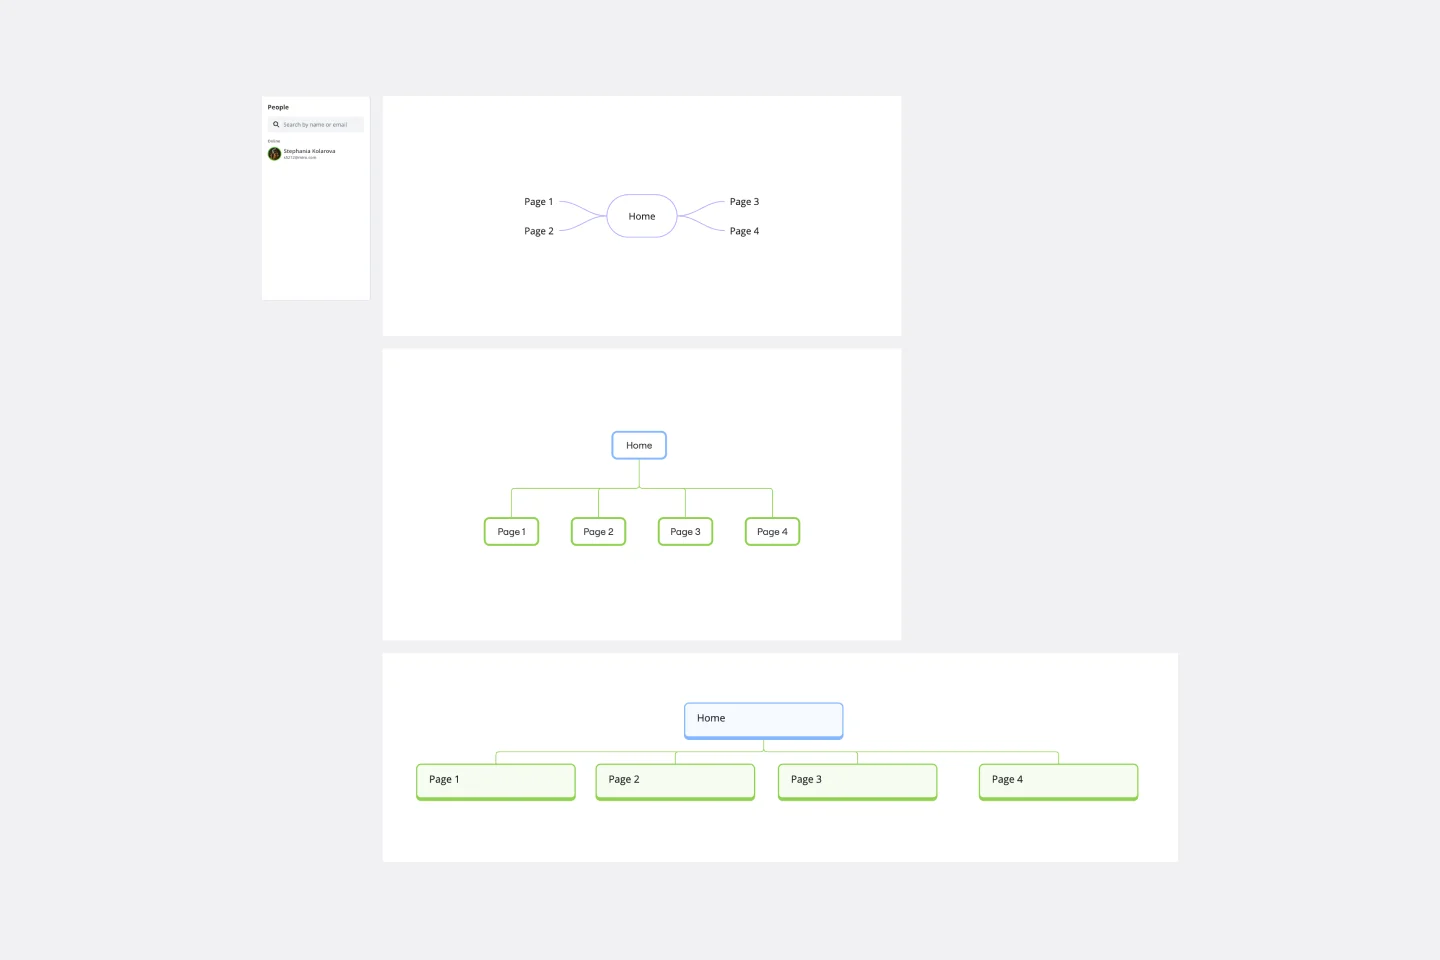
Sitemap Template
Building a website is a complex task. Numerous stakeholders come together to create pages, write content, design elements, and build a website architecture that serves a target audience. A sitemap is an effective tool for simplifying the website design process. It allows you to take stock of the content and design elements you plan to include on your site. By visualizing your site, you can structure and build each component in a way that makes sense for your audience.
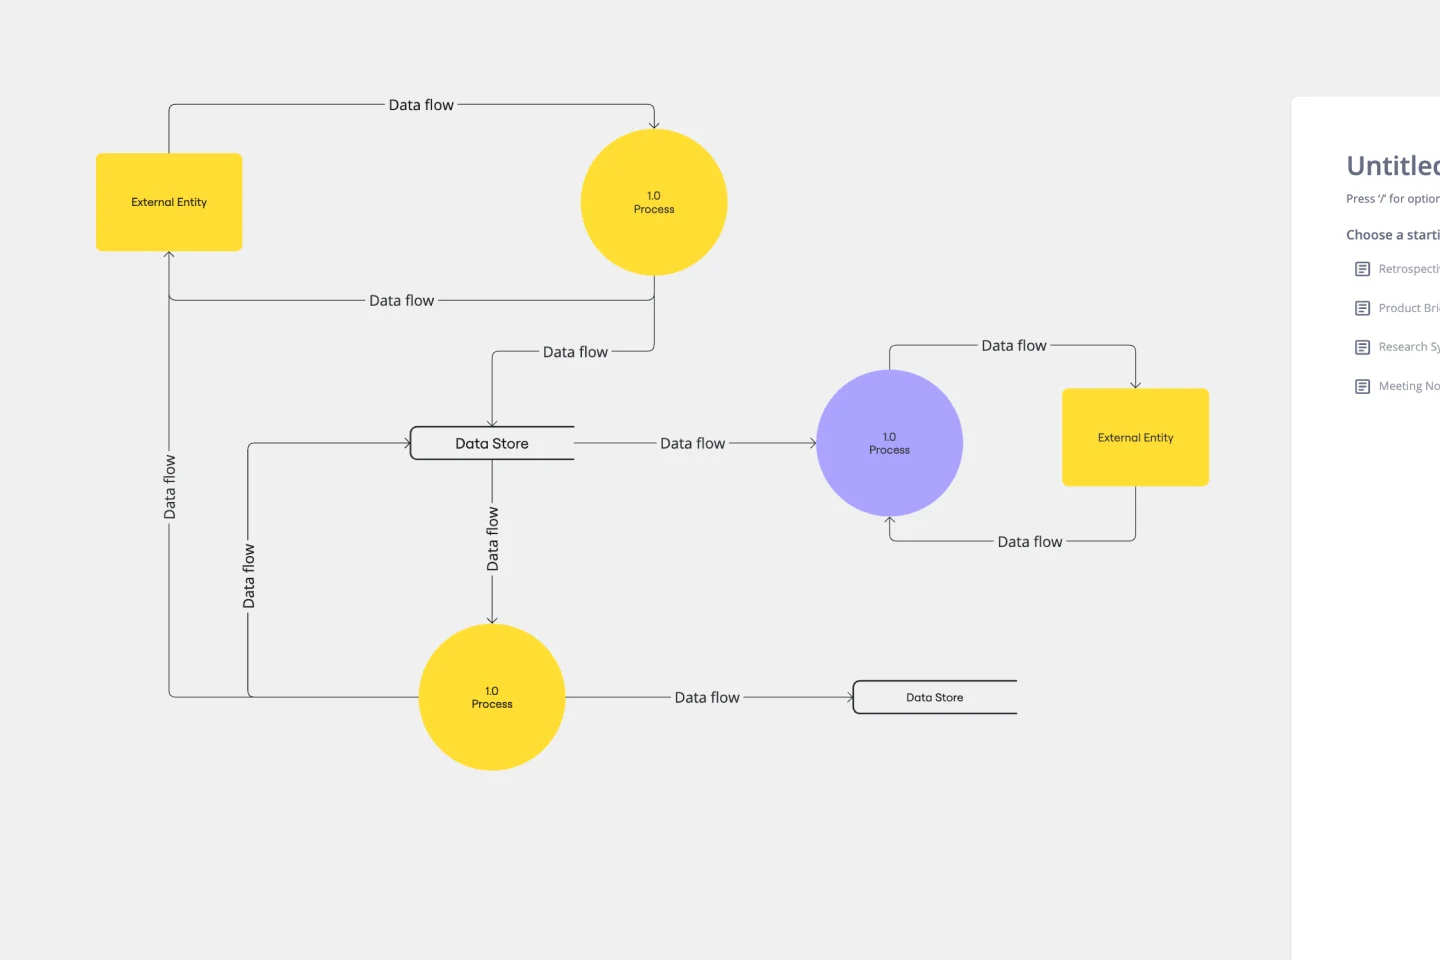
Data Flow Diagram Template
Any process can get pretty complex, especially when it has multiple components. Get a better grasp of your process through a data flow diagram (DFD). DFDs create a simple visual representation of all components in the flow of data and requirements in an entire system. They’re most often used by growth teams, data analysts, and product teams, and they’re created with one of three levels of complexity—0, 1, or 2. This template will help you easily build the best DFD for your process.
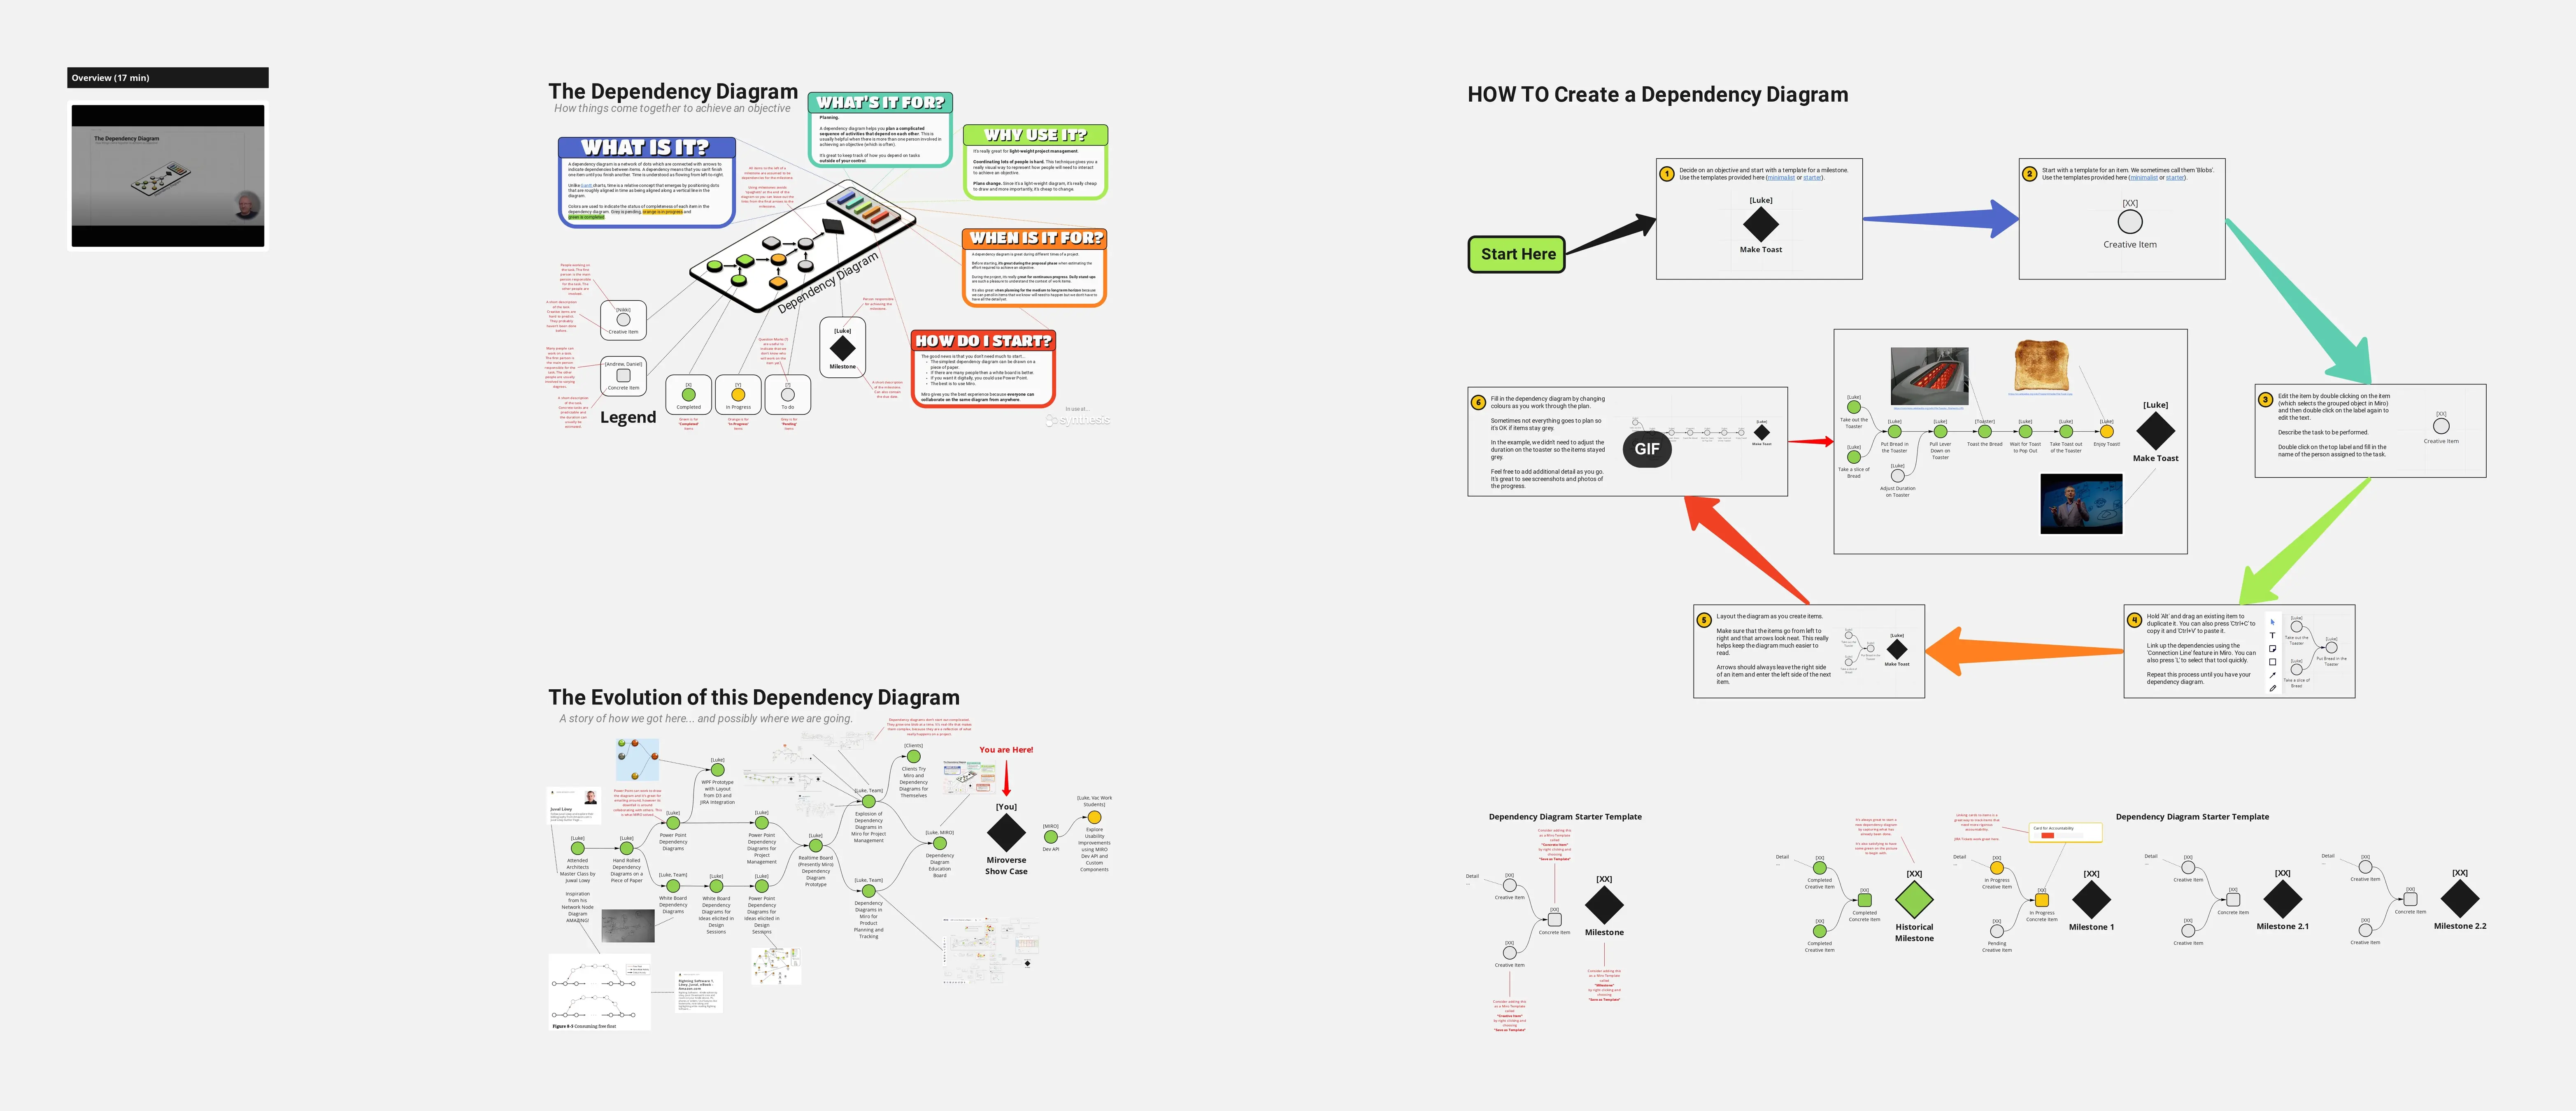
Dependency Diagrams Educational Board
The Dependency Diagrams Educational Board template provides a visual tool for teaching and learning about dependency relationships between components in systems. It offers a structured framework for illustrating dependencies, connections, and interactions within a system or process. This template enables educators to explain complex concepts effectively and engage learners in interactive activities. By promoting visual learning and understanding of dependencies, Dependency Diagrams empower students to grasp fundamental principles of systems thinking and analysis.
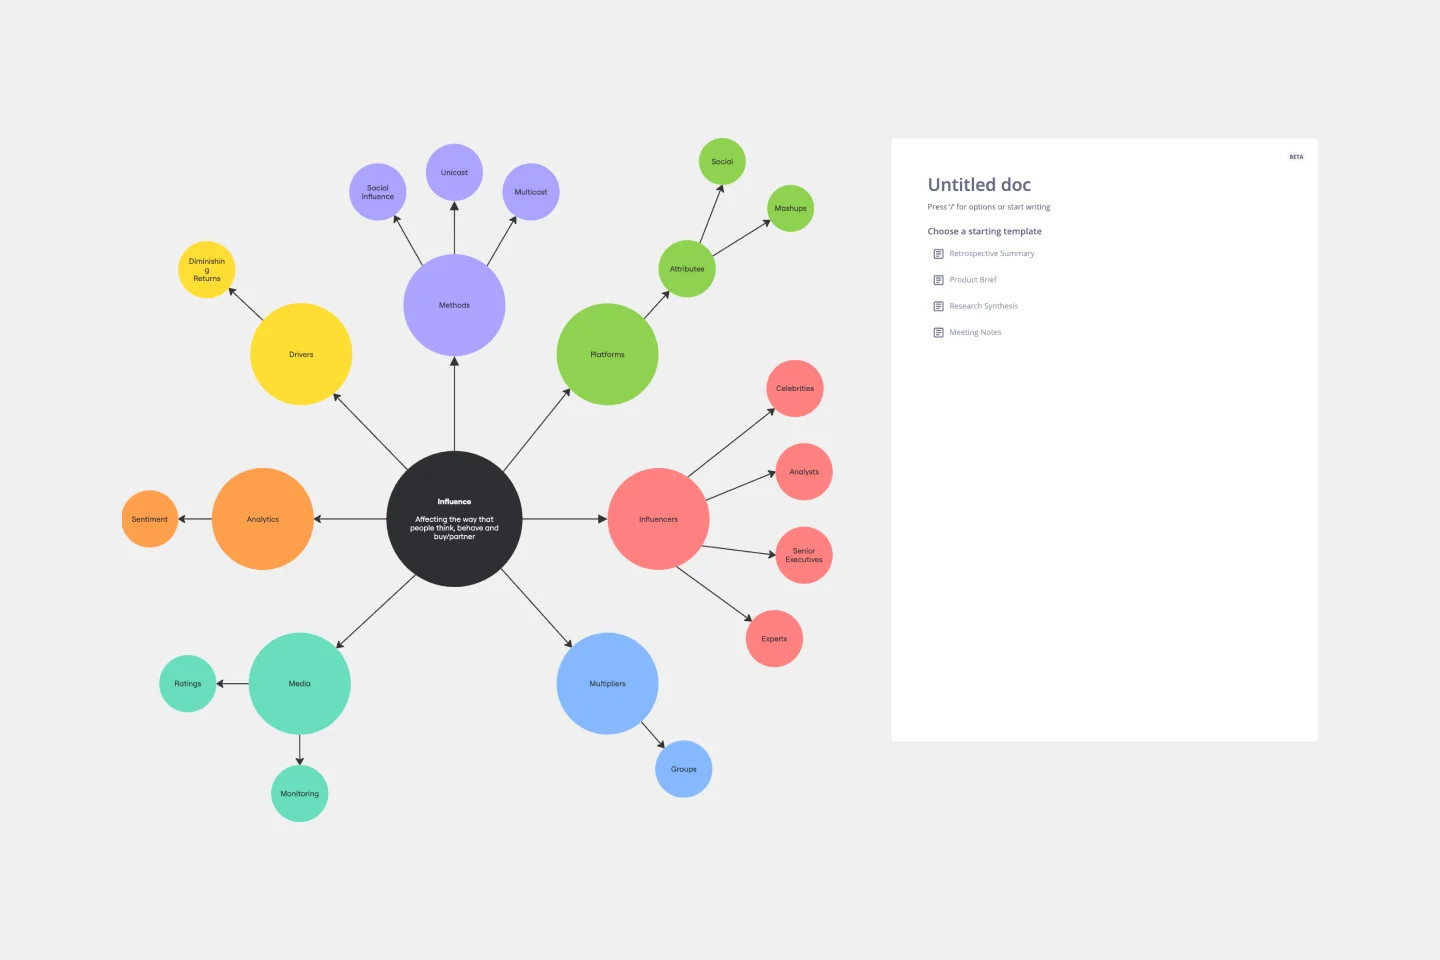
Cluster Diagram Template
The Cluster Diagram Template is a valuable tool for organizing and connecting ideas, concepts, and information in a visually compelling and coherent manner. The template's design centers on grouping related ideas around a core concept, creating a transparent and hierarchical structure. This clustering not only aids in breaking down complex information into manageable segments but also significantly enhances the process of idea generation and brainstorming. A structured yet flexible visual framework encourages deeper engagement and more precise understanding, making it an essential asset for teams and people looking to bring order to their creative and analytical processes.
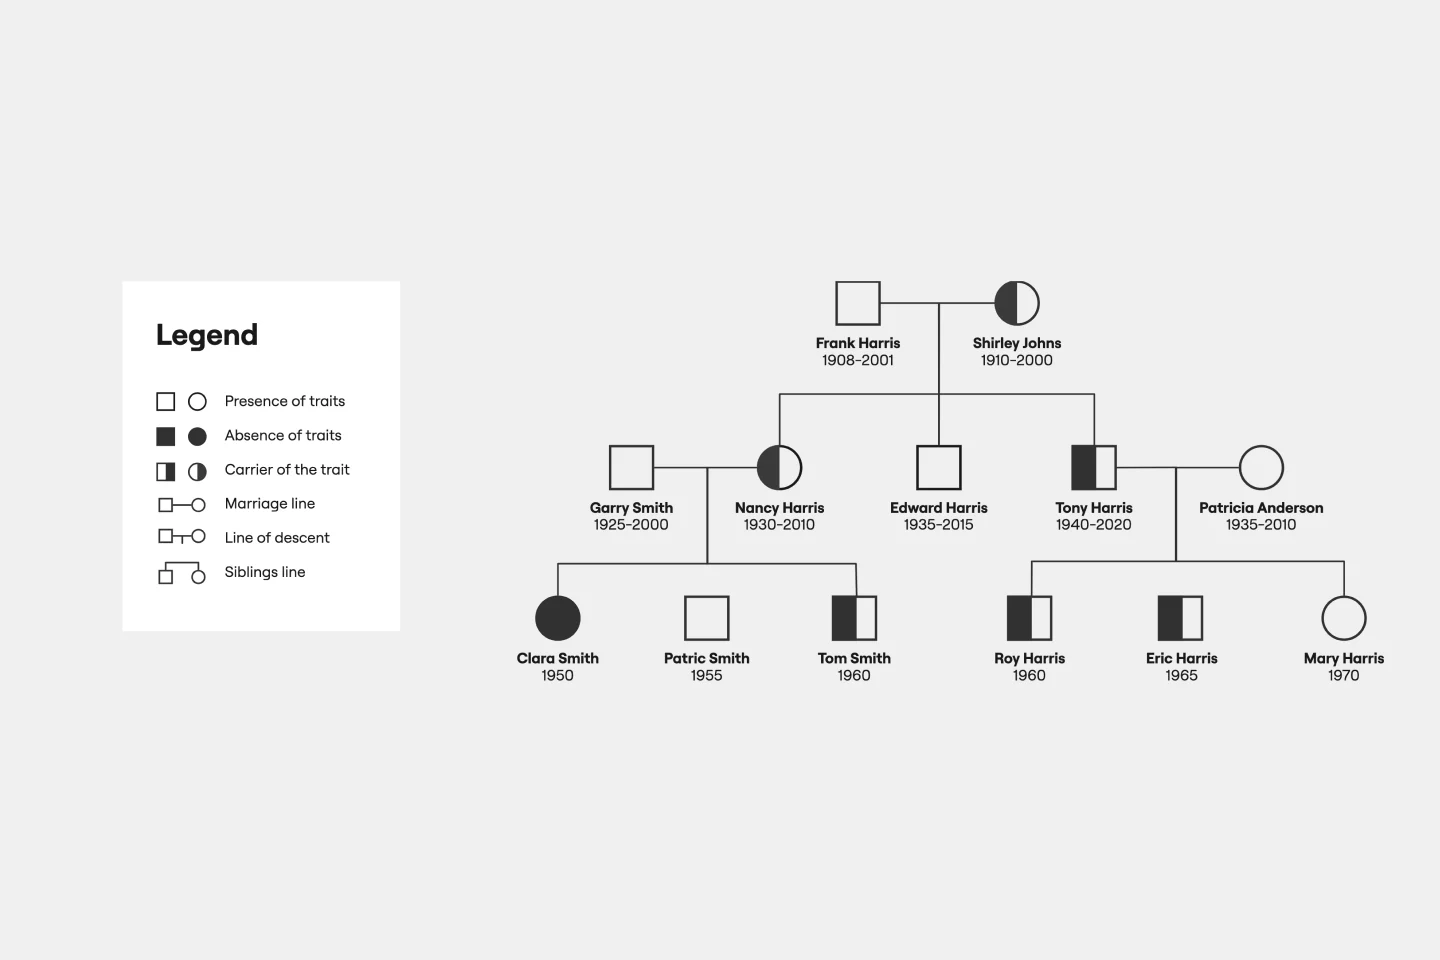
Pedigree Diagram Template
Use our Pedigree Diagram Template to show how traits and diseases are passed from one generation to the next. Whether you’re a doctor, farmer, or just someone interested in genetics, a Pedigree Diagram can help you identify hereditary traits.
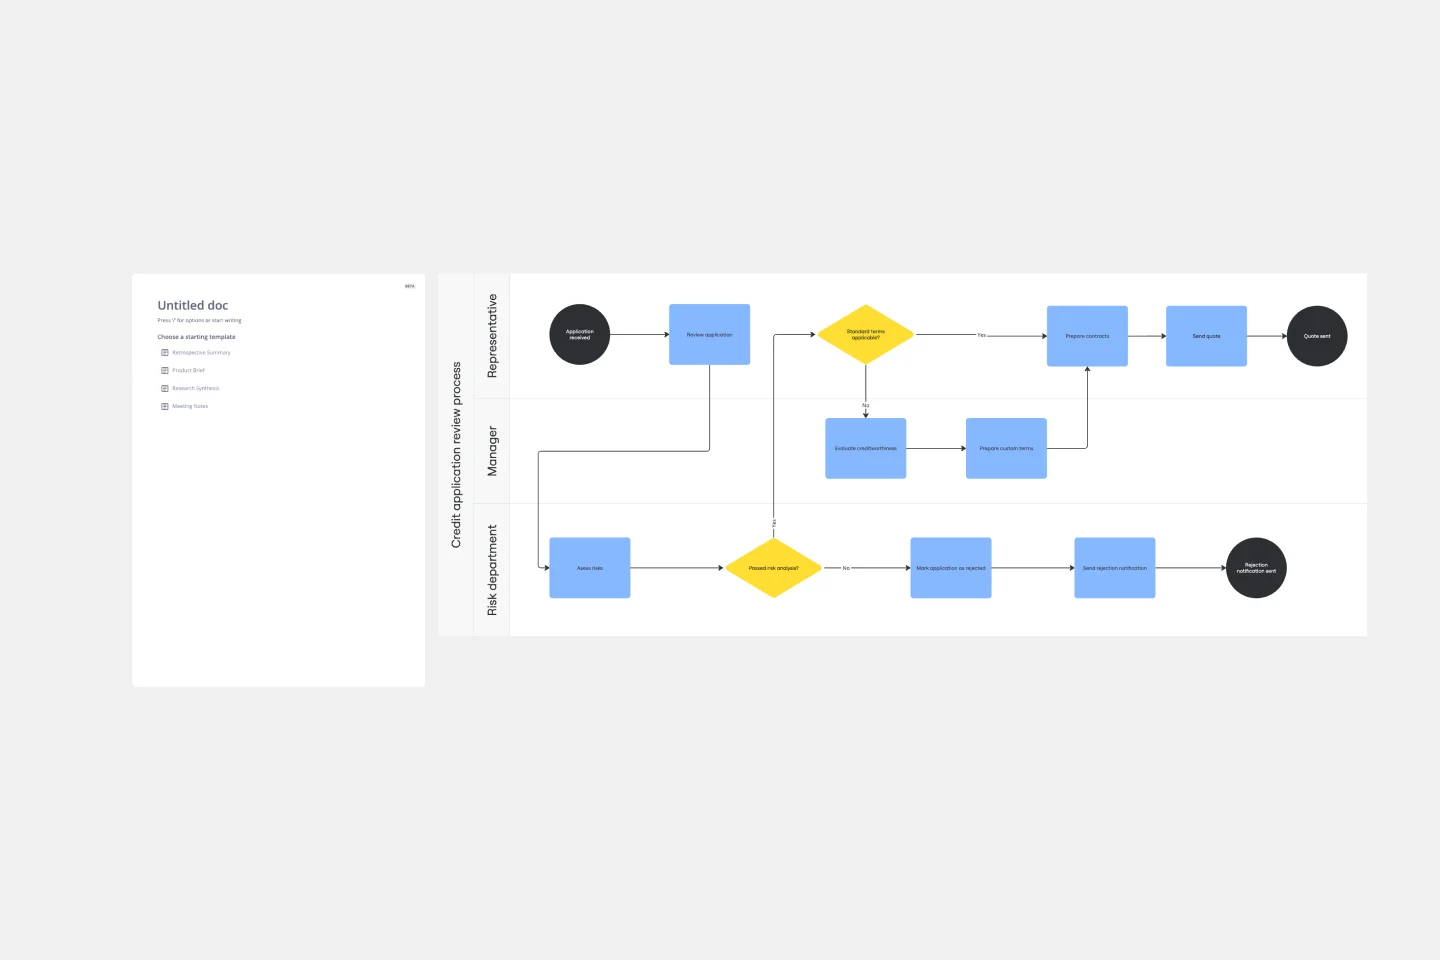
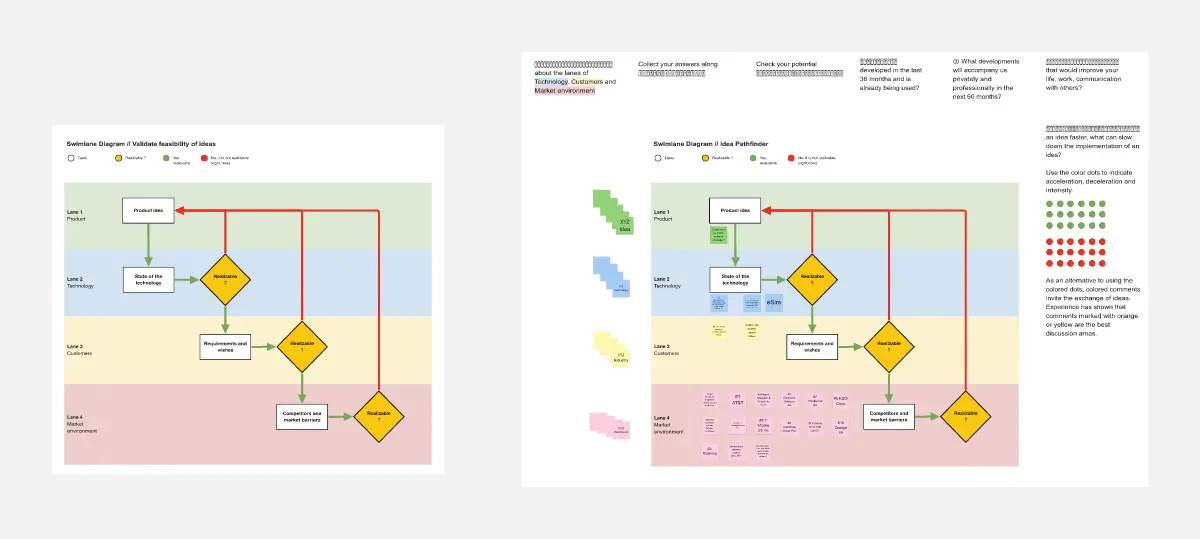
Process Map Template
Process mapping allows you to assess, document, and strategize around any plan or approach your team has put in place. It’s a useful tool for eliminating or preventing blockers. Organized by stages, a process map enables your team to divide up a process or system and record deliverables and action items at each stage of the process. By breaking down the objectives, activities and deliverables at any stage of a project, you can gain insight into whether you are on track or effectively working through a problem.
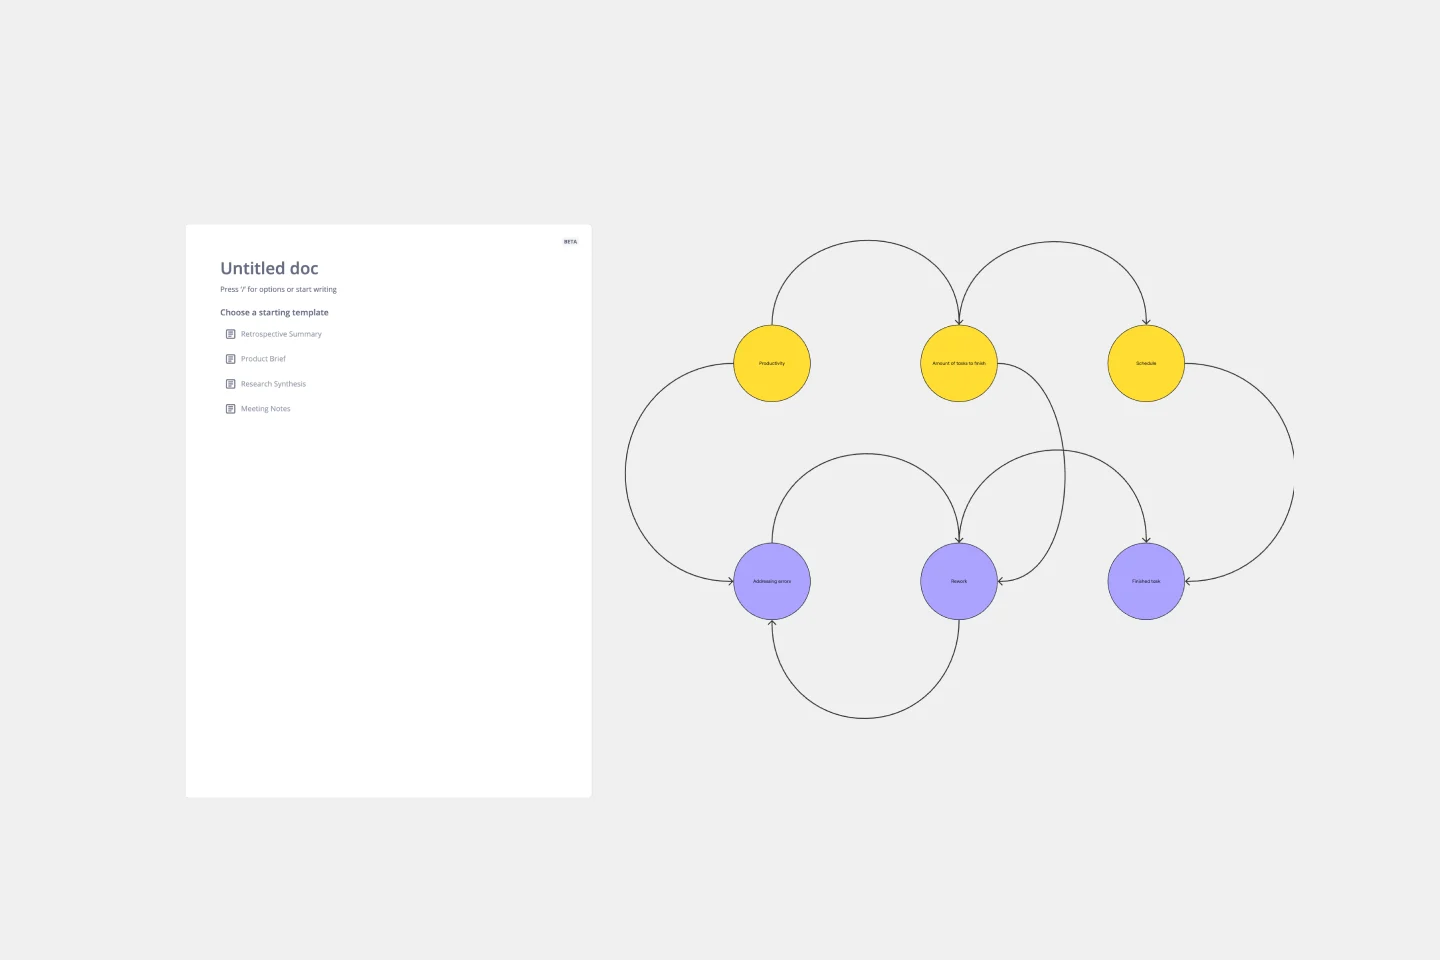
Causal Loop Diagram Template
The Causal Loop Diagram Template offers a structured framework to visualize the intricate interconnections within any system. Its standout benefit is the ability to provide a holistic perspective, ensuring that users don't just see isolated issues but understand the entire web of relationships, ultimately leading to more informed and strategic decision-making.
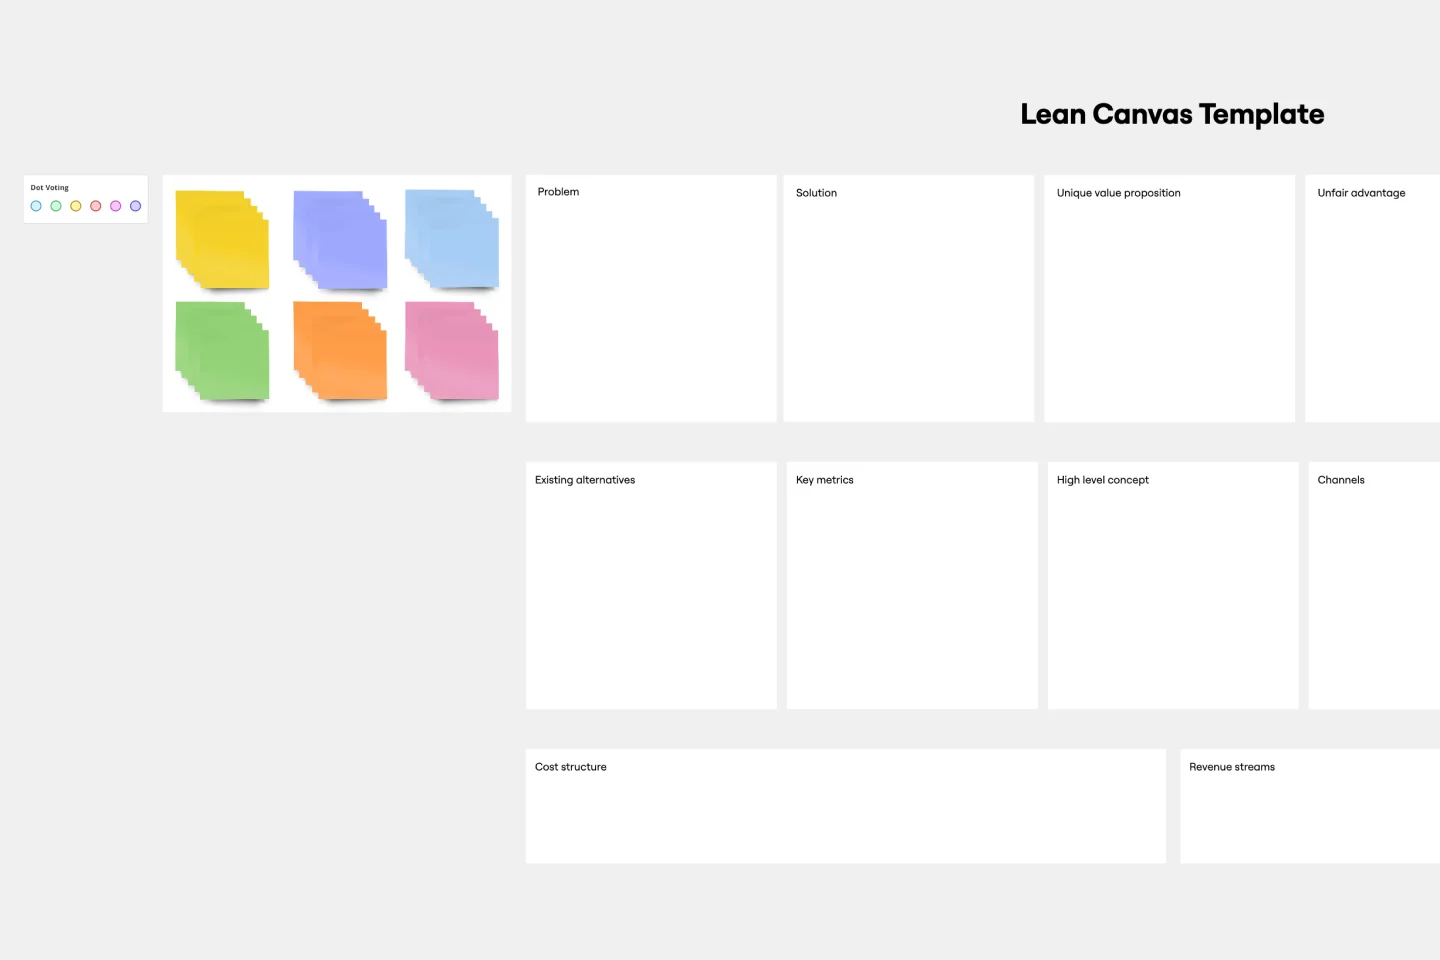
Lean Canvas Template
Business opportunities can get dense, cumbersome, and complex, and evaluating them can be a real challenge. Let a lean canvas streamline things and break down your business idea for you and your team. A great tool or entrepreneurs and emerging businesses, this one-page business model gives you an easy, high-level view of your idea — so you can stay focused on overall strategy, identify potential threats and opportunities, and brainstorm the various factors at play in determining your potential profitability in an industry.
Kinship Diagram Template
Use a Kinship Diagram Template to map out a clear picture of your family relationships. With clear guidelines for kinship notation, you can navigate everything from your closest uncle to your third cousin twice removed. Try the Kinship Diagram Template to understand your family relationships.
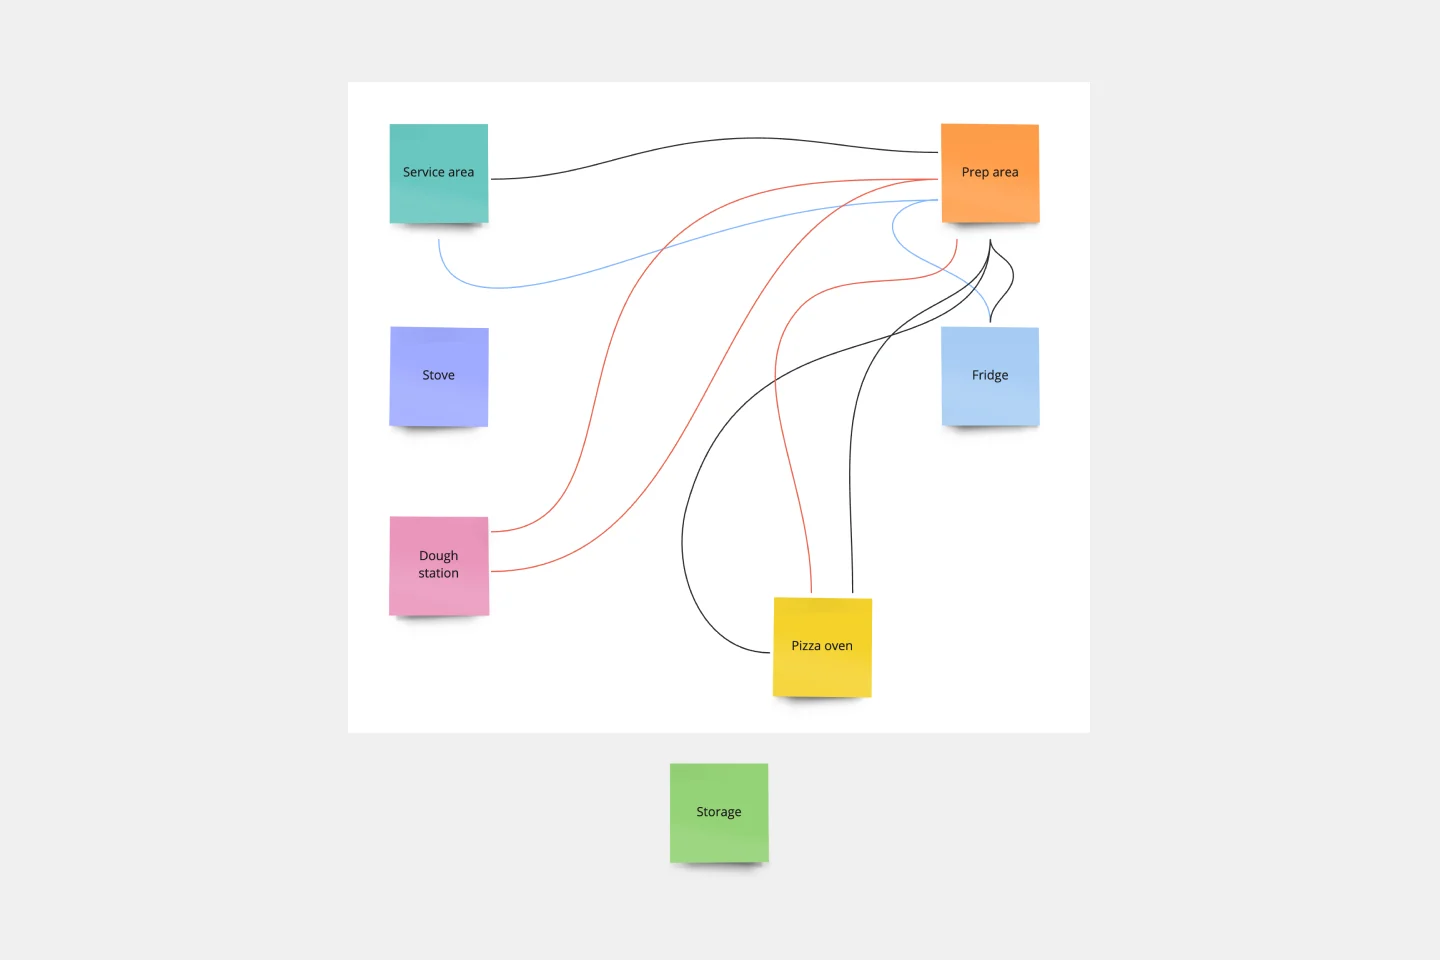
Spaghetti Diagram Template
Spaghetti diagrams are valuable for finding connections between assets, services, and products, as well as identifying dependencies in a visual way. Use this template to get an overview of a process and quickly find areas of improvement.
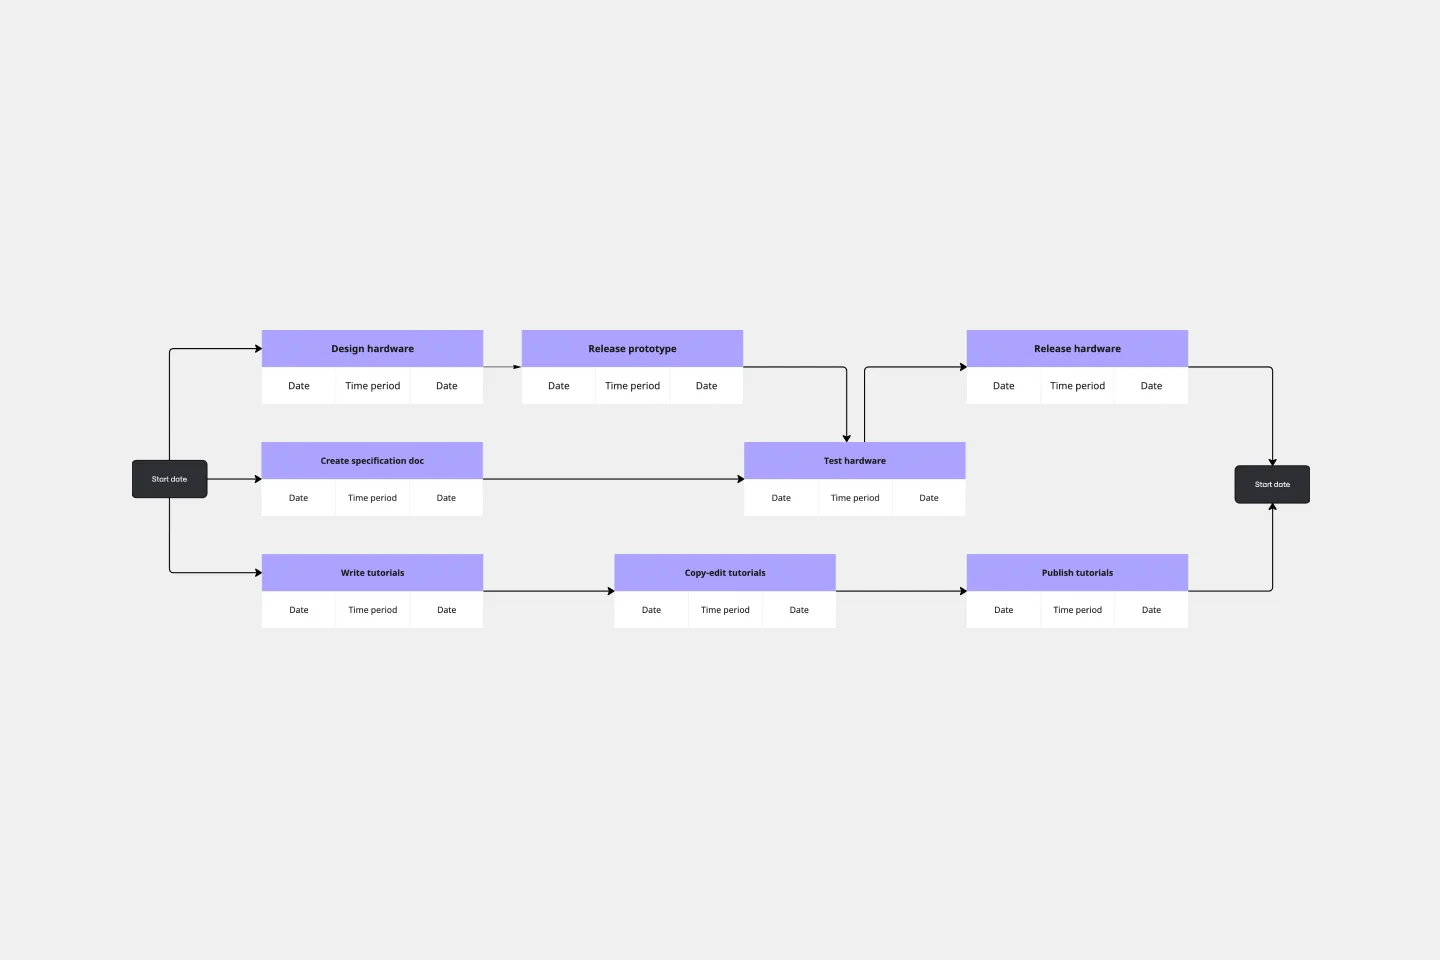
PERT Chart Template
A Program Evaluation and Review Technique (PERT) diagram is used to plan projects efficiently. They help you set a clear timeline, plan out tasks and dependencies, and determine a critical path.
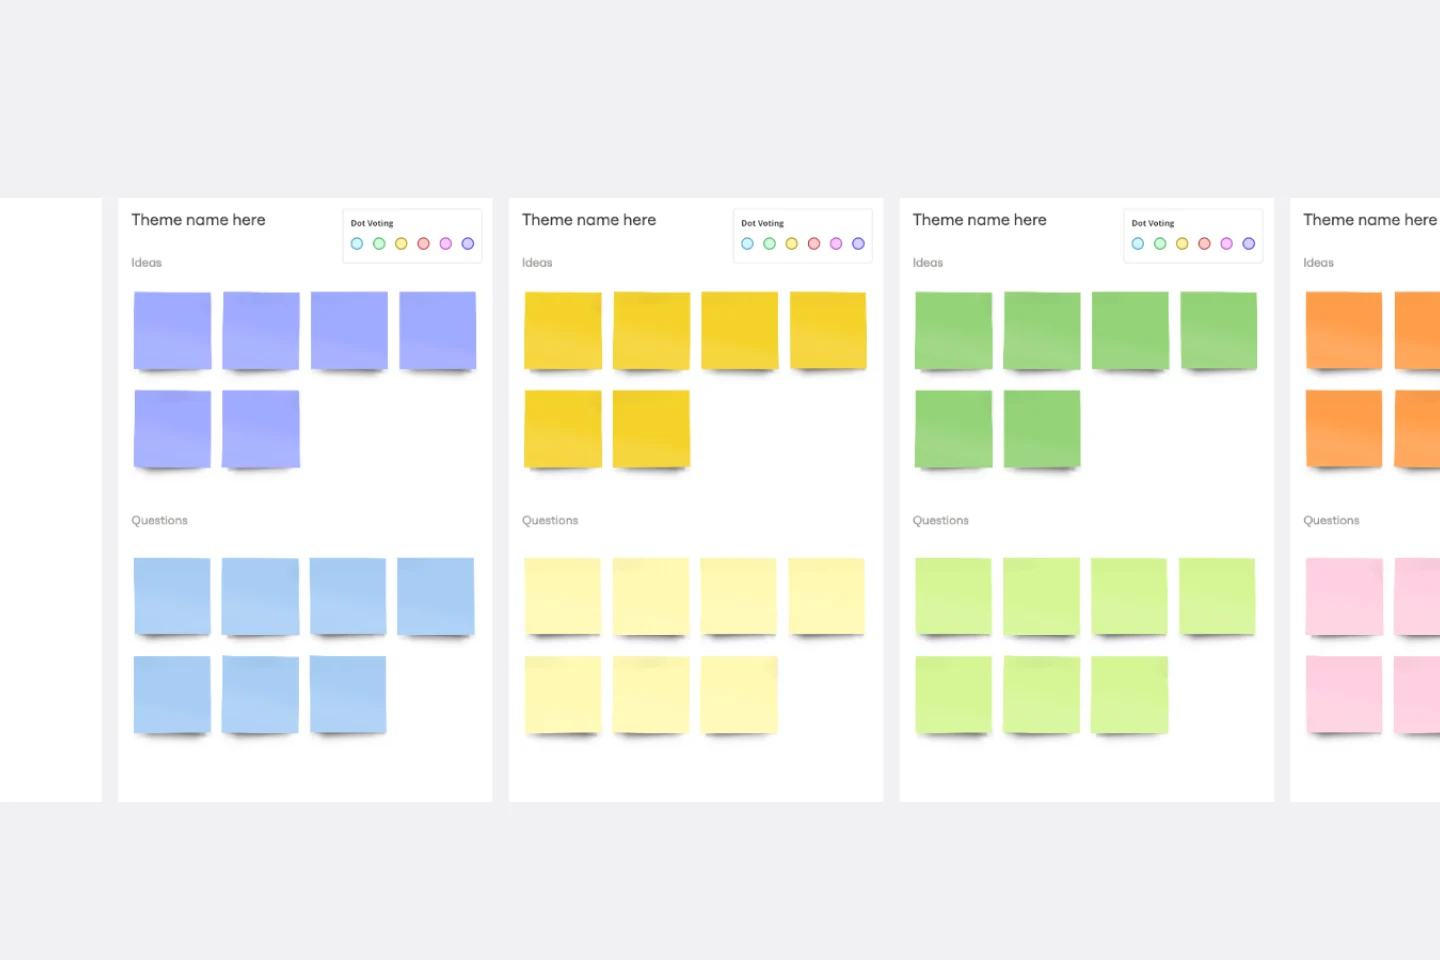
Affinity Diagram Template
You can use an affinity diagram to generate, organize, and consolidate information that comes out of a brainstorming session. Whether you’re building a product, working through a complex problem, establishing a process, or piecing apart an issue, an affinity diagram is a useful and simple framework that gives each team member the opportunity to pitch in and share their thoughts. But it’s not just ideal for brainstorms—this is a great template and tool when you need to reach consensus or analyze data such as survey results.
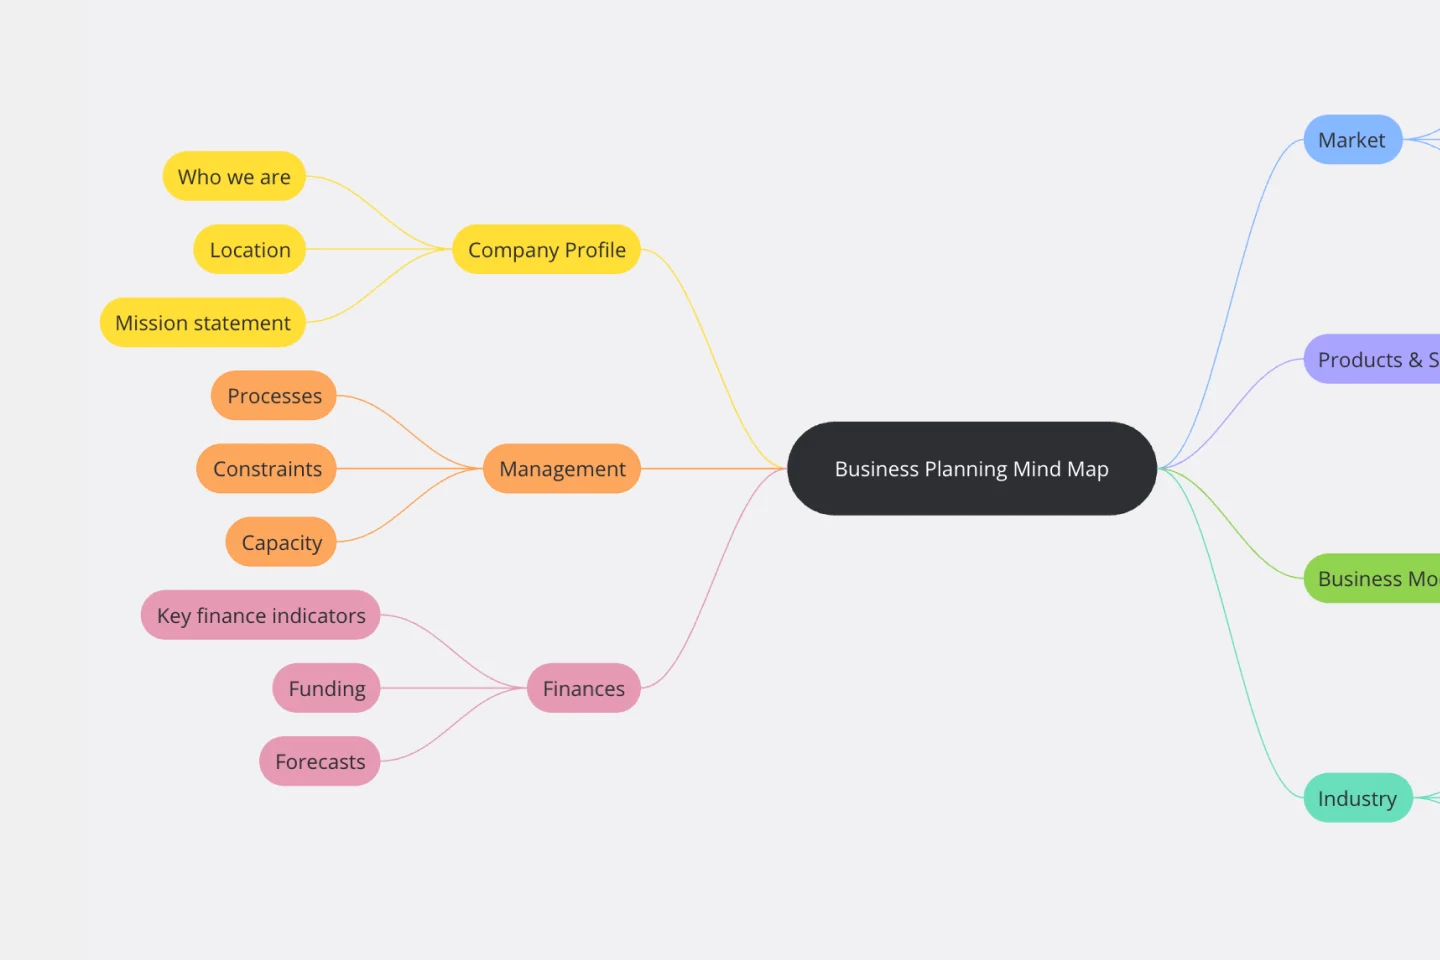
Business Plan Mind Map Template
The Business Plan Mind Map Template simplifies complex business information by visually organizing each plan section as a branch on a mind map. This enhances communication, understanding, and attention to crucial aspects, making it an essential tool for developing effective business strategies.
Miro's mapping and diagramming templates collection is designed to streamline the process of creating visual representations of complex information. Whether you're mapping out a customer journey, designing a flowchart, or creating a mind map, Miro offers a wide range of templates to suit your needs. These templates are crafted to help you start quickly and collaborate effectively with your team, ensuring that everyone is on the same page from the get-go.
Using Miro's mapping and diagramming templates comes with numerous benefits:
Ease of use: Start diagramming from scratch or choose from a variety of pre-made templates. The intuitive tools and frameworks make it easy to create professional diagrams without any prior experience.
Collaboration: Share your diagrams with teammates and collaborate in real time. Discuss, refine, and iterate directly on the board, making the process seamless and efficient.
Versatility: The templates cater to various needs, from customer journey maps to technical diagrams, ensuring that you have the right tool for any project.
Efficiency: Save time with ready-to-use templates that can be customized to fit your specific requirements. This allows you to focus more on the content rather than the design.
Export and presentation: Once your diagram is ready, easily export it in various formats for presentations or further use.
Choose a template: Browse through the collection or use the search bar to find a specific template that fits your needs. Click on the template to preview it.
Customize the template: Modify the template to suit your project. Add or remove elements, change colors, and insert text to make it your own.
Collaborate with your team: Share the board with your team members. Use Miro's collaboration features to work together in real time, leaving comments and suggestions directly on the board.
Finish and export: Once your diagram is complete, use the export options to save it in your preferred format. You can also present it directly from Miro using the presentation.
Use advanced features: Take advantage of Miro's advanced diagramming features such as smart diagramming tools, which include workflows for methodologies like Business Process Modeling Notation (BPMN), Unified Modeling Language (UML), Data Flow Diagrams (DFD), and Entity Relationship Diagrams (ERD). These tools can help you create more sophisticated and detailed diagrams.
Incorporate integrations: Enhance your diagrams by integrating Miro with other services. Explore the Miro Marketplace to find apps that can enrich your diagramming experience, such as importing diagrams from other tools or exporting your Miro diagrams to different formats.
Leverage shape libraries: Use the extensive shape libraries available in Miro. These libraries are organized into logical categories, making it easy to find the right shapes for your diagrams. You can also switch types of shapes and customize them to fit your needs.
Embed and share: Once your diagram is complete, you can embed it directly into your company's documentation or share it with stakeholders. Miro's sharing options make it easy to collaborate and get feedback from your team.
Miro's mapping and diagramming templates are designed to help teams visualize complex information, streamline workflows, and enhance collaboration. By using these templates, teams can save time, improve efficiency, and create professional diagrams that facilitate better understanding and decision-making. With Miro, your team can thrive by turning ideas into actionable plans and achieving your goals together.