About the Operations Management Templates Collection
Operations management is the backbone of any successful organization, ensuring that all processes run smoothly and efficiently. Miro's operations management templates are designed to help your operations team streamline workflows, improve productivity, and maintain high standards of quality. These templates cover a wide range of needs, from daily task management to complex project planning, providing a robust framework for operational excellence.
Why you'll love our operations management examples
Operations management templates in Miro offer many benefits that can transform the way your team works. Here are some key advantages:
Enhanced efficiency: Streamline your processes and reduce time spent on repetitive tasks.
Improved collaboration: Facilitate better communication and teamwork across departments.
Standardization: Ensure consistency in operations with standardized procedures and templates.
Scalability: Easily adapt templates to fit the growing needs of your organization.
Data-driven decisions: Use built-in analytics to make informed decisions based on real-time data.
How to use the operations management templates in Miro
Using Miro's operations management templates is straightforward and intuitive. Follow these steps to get started:
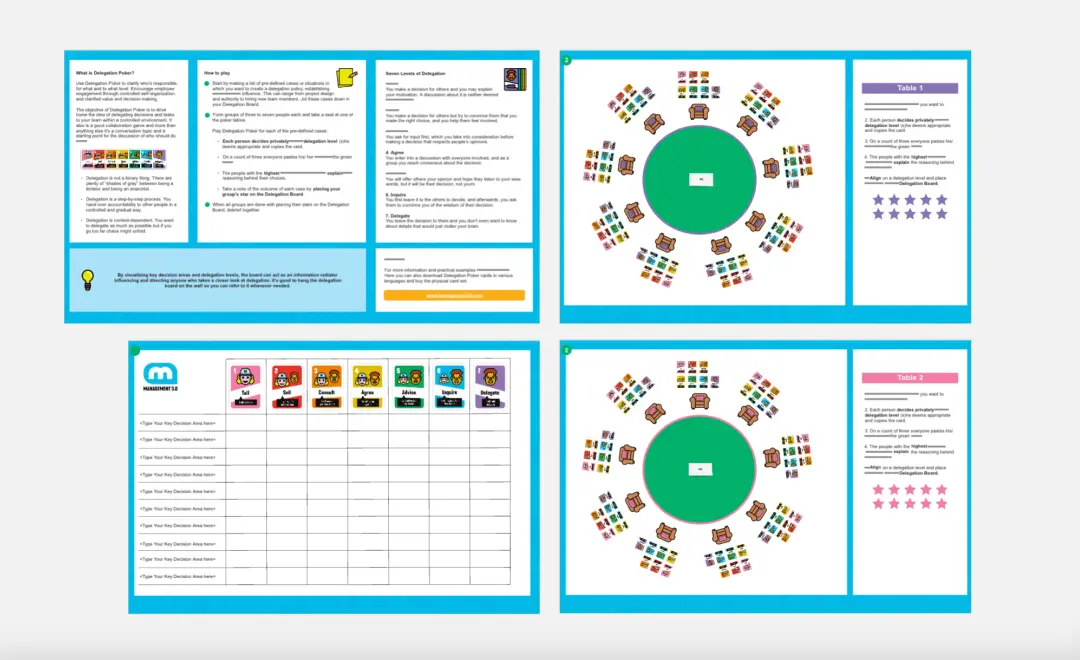
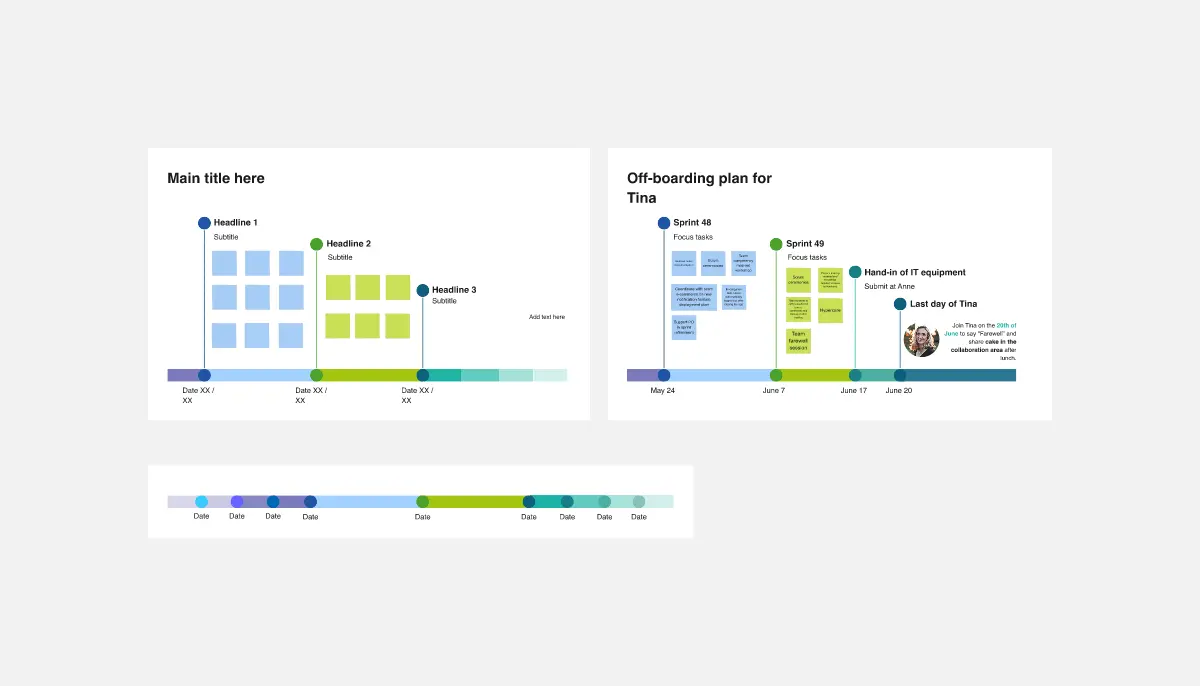
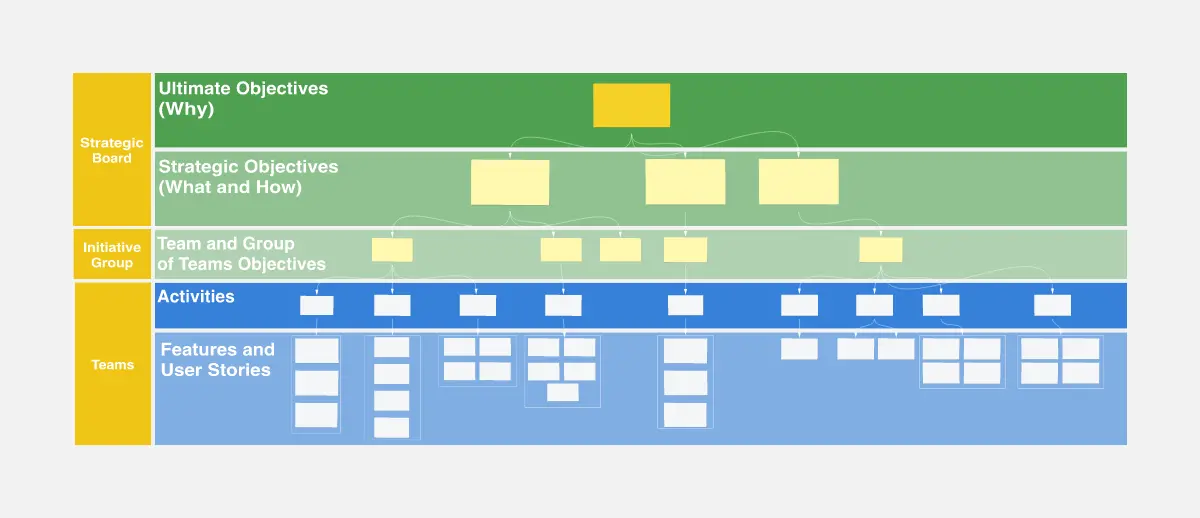
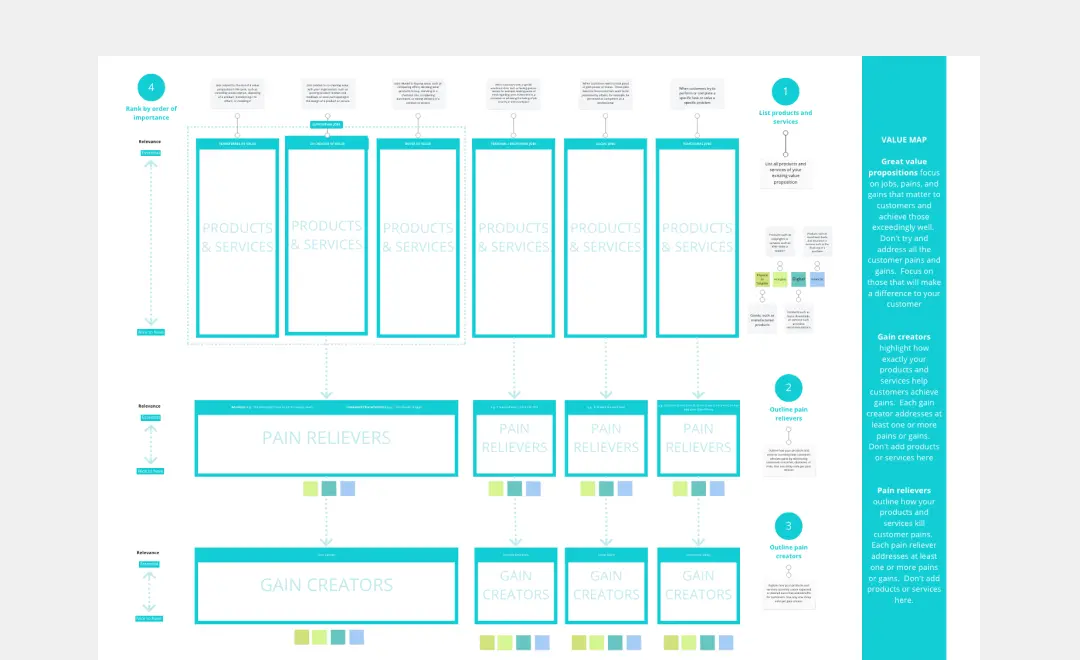
Select a template: Browse through the operations management category and choose a template that fits your needs. Whether it's an operations framework template or a specific task management tool, Miro has you covered.
Customize the template: Tailor the template to your specific requirements. Add or remove sections, adjust fields, and input your data to make it relevant to your operations team.
Collaborate with your team: Share the template with your team members. Use Miro's collaborative features to work together in real time, ensuring everyone is on the same page.
Implement and monitor: Once the template is customized and shared, implement it in your daily operations. Monitor progress and make adjustments as needed to optimize performance.
Review and improve: Review the template's effectiveness regularly. Gather feedback from your team and continuously improve it to ensure it remains effective and relevant.
Miro's operations management templates are a powerful tool for any operations team looking to enhance efficiency, collaboration, and overall performance. By leveraging these templates, your team can thrive in a dynamic and fast-paced environment, ensuring that your organization remains competitive and successful.