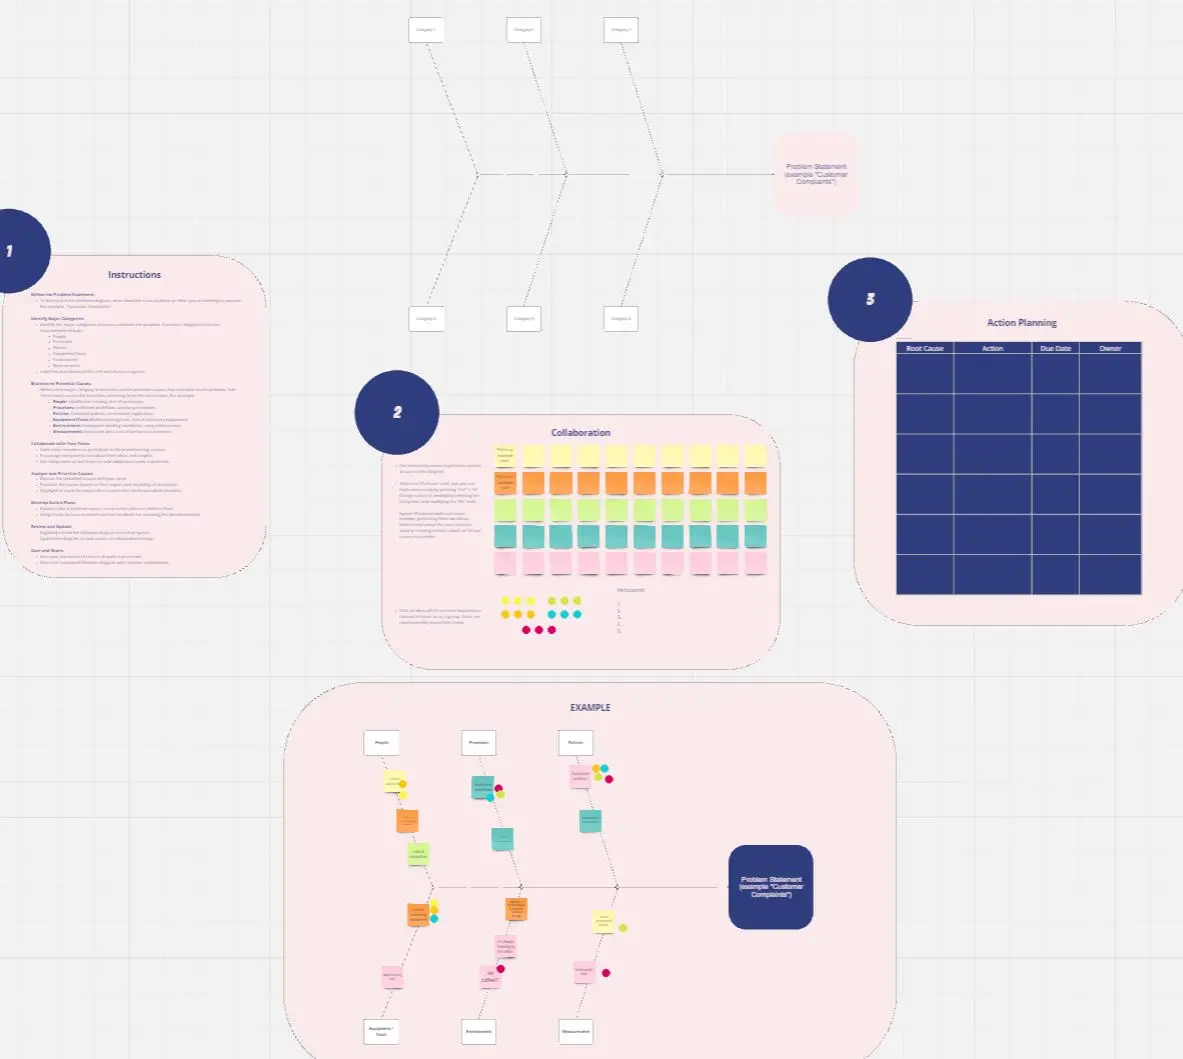
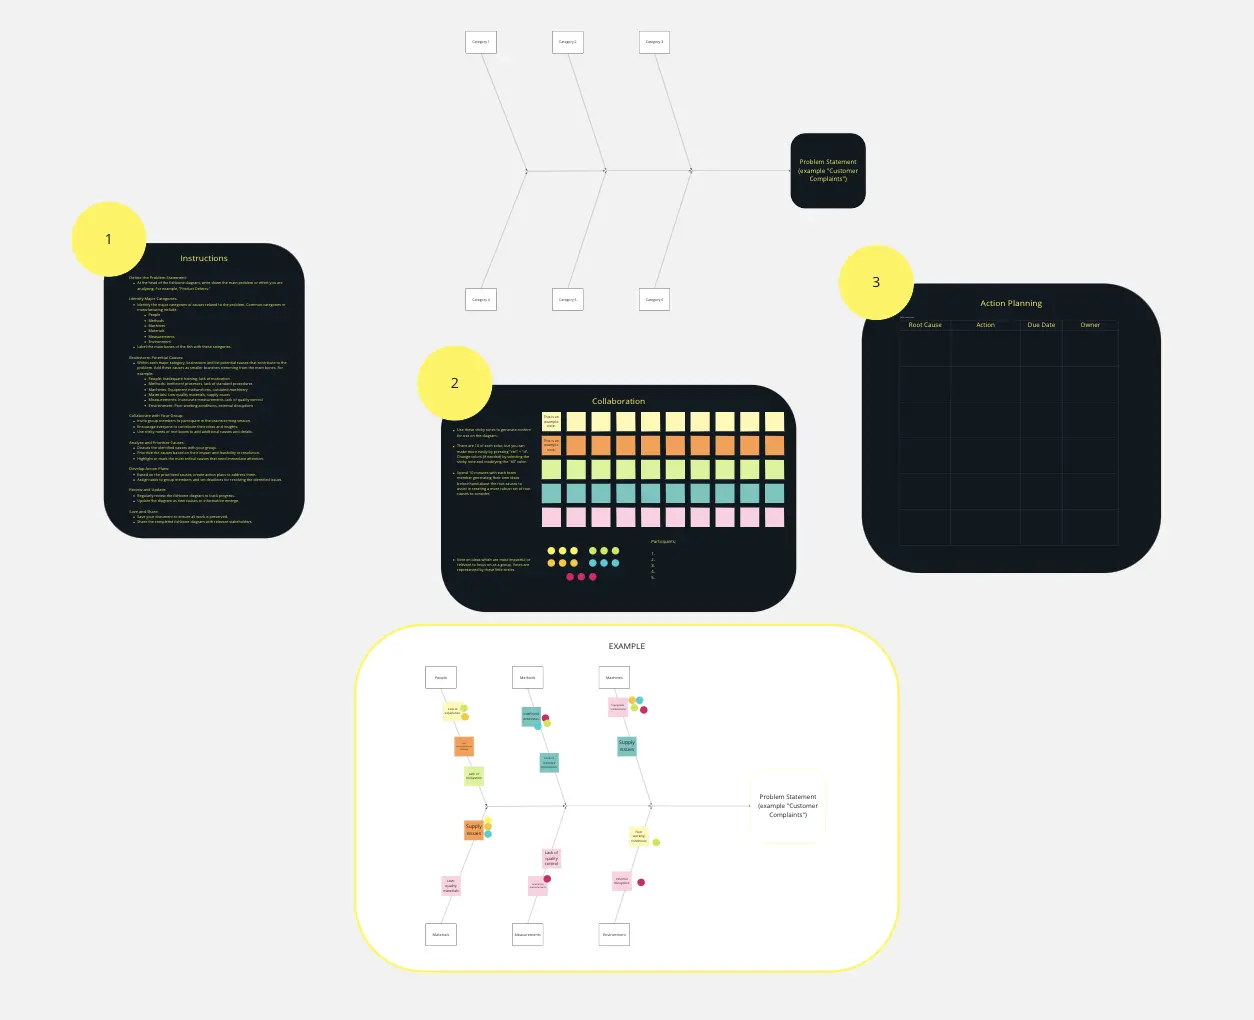
About the fishbone diagram templates
Miro's fishbone diagram templates are a powerful tool for teams looking to dive deep into problem-solving. These templates, inspired by the Ishikawa or cause-and-effect diagram, offer a structured way to visualize all the potential causes of a particular issue. By laying out the various factors in a visual format, teams can collaboratively pinpoint the root causes of challenges and strategize on effective solutions.
Why you'll love our fishbone diagram templates
Our collection of fishbone diagram examples is designed to spark creativity and provide guidance on how to use this problem-solving method effectively. Each example serves as a springboard for your team to understand the breadth of possible causes for a problem and how they can interconnect. With these fishbone diagram templates, you'll find it easier to engage in productive discussions, ensuring that every voice is heard and every potential cause is considered.
How to use the fishbone diagram templates in Miro
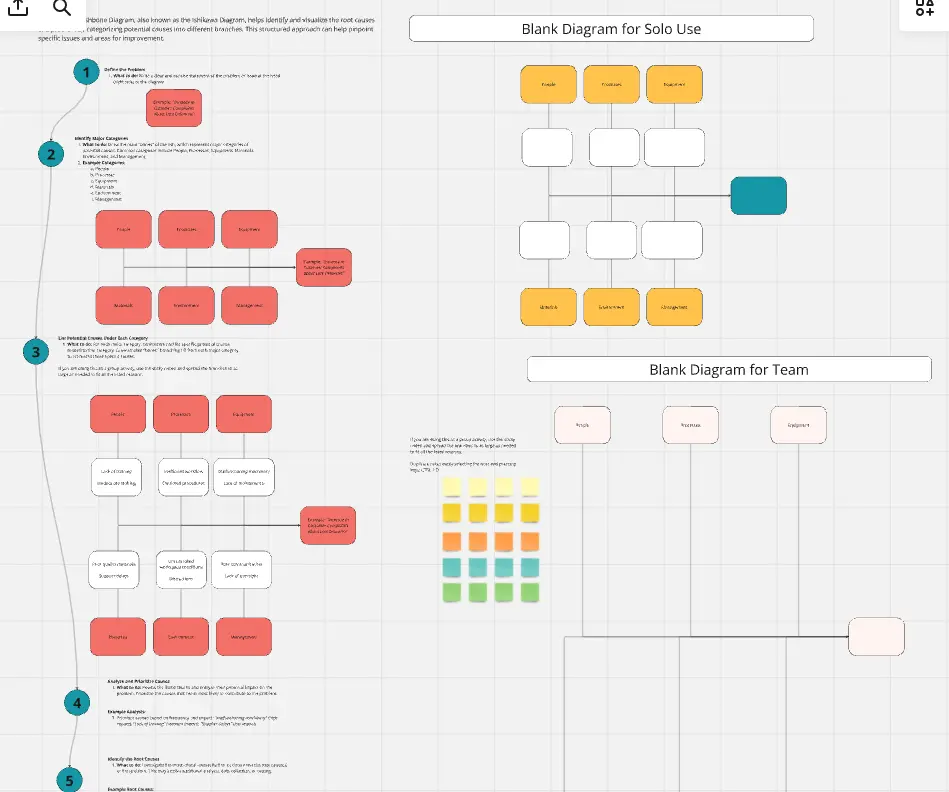
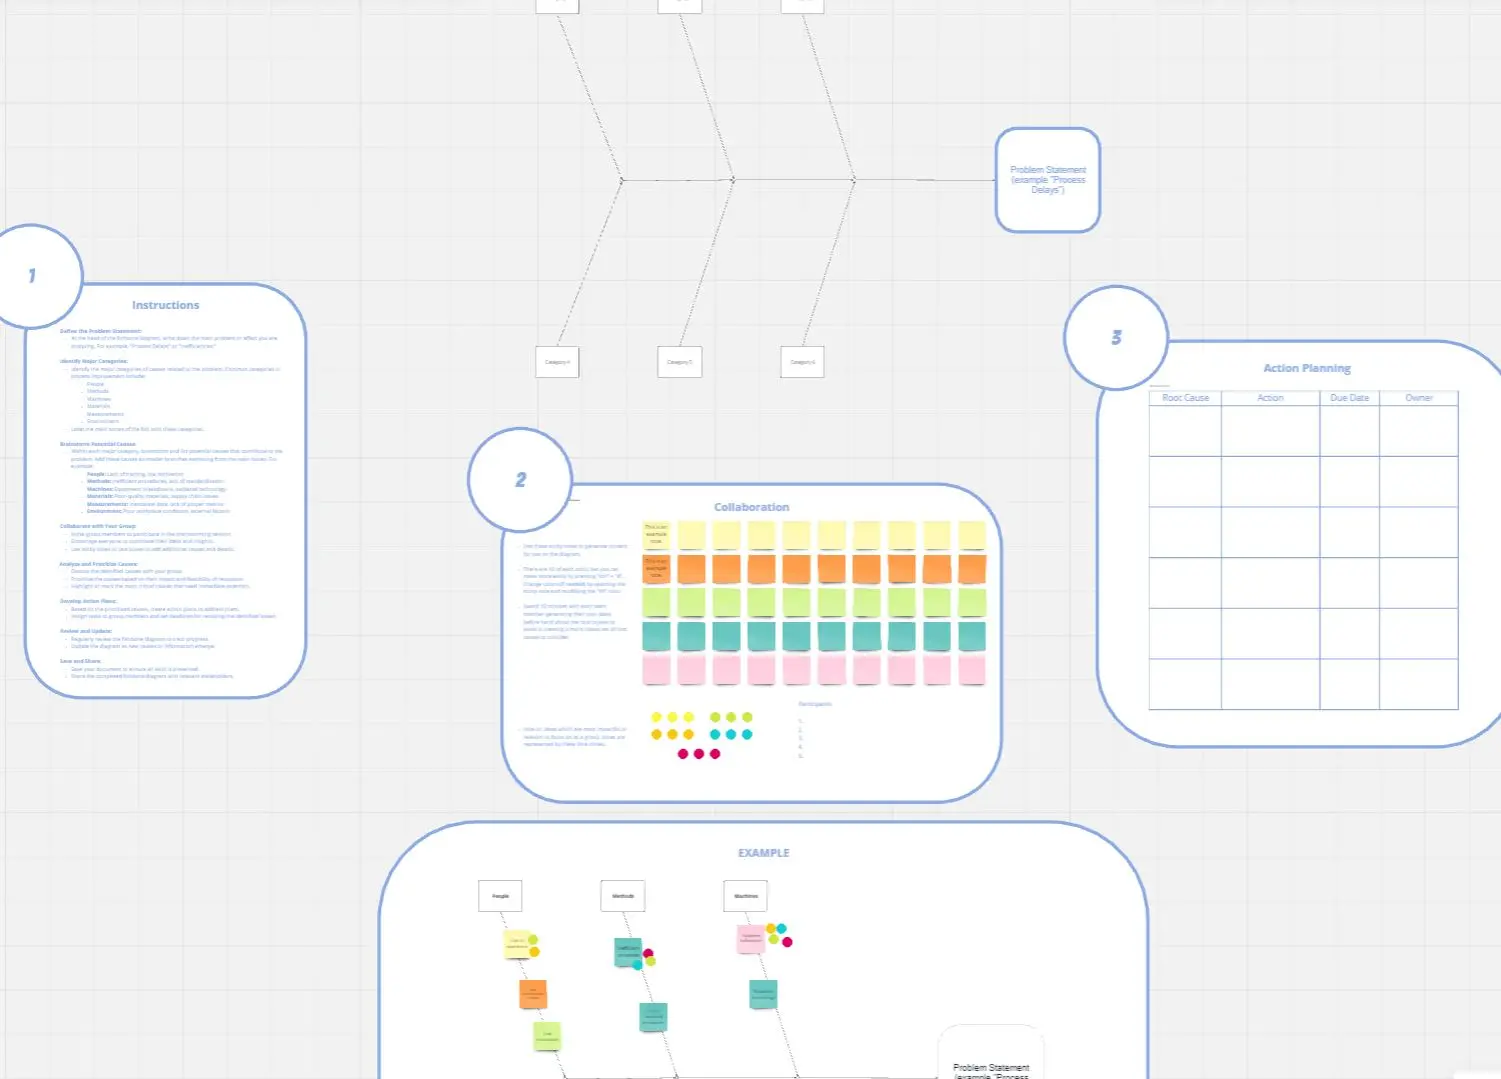
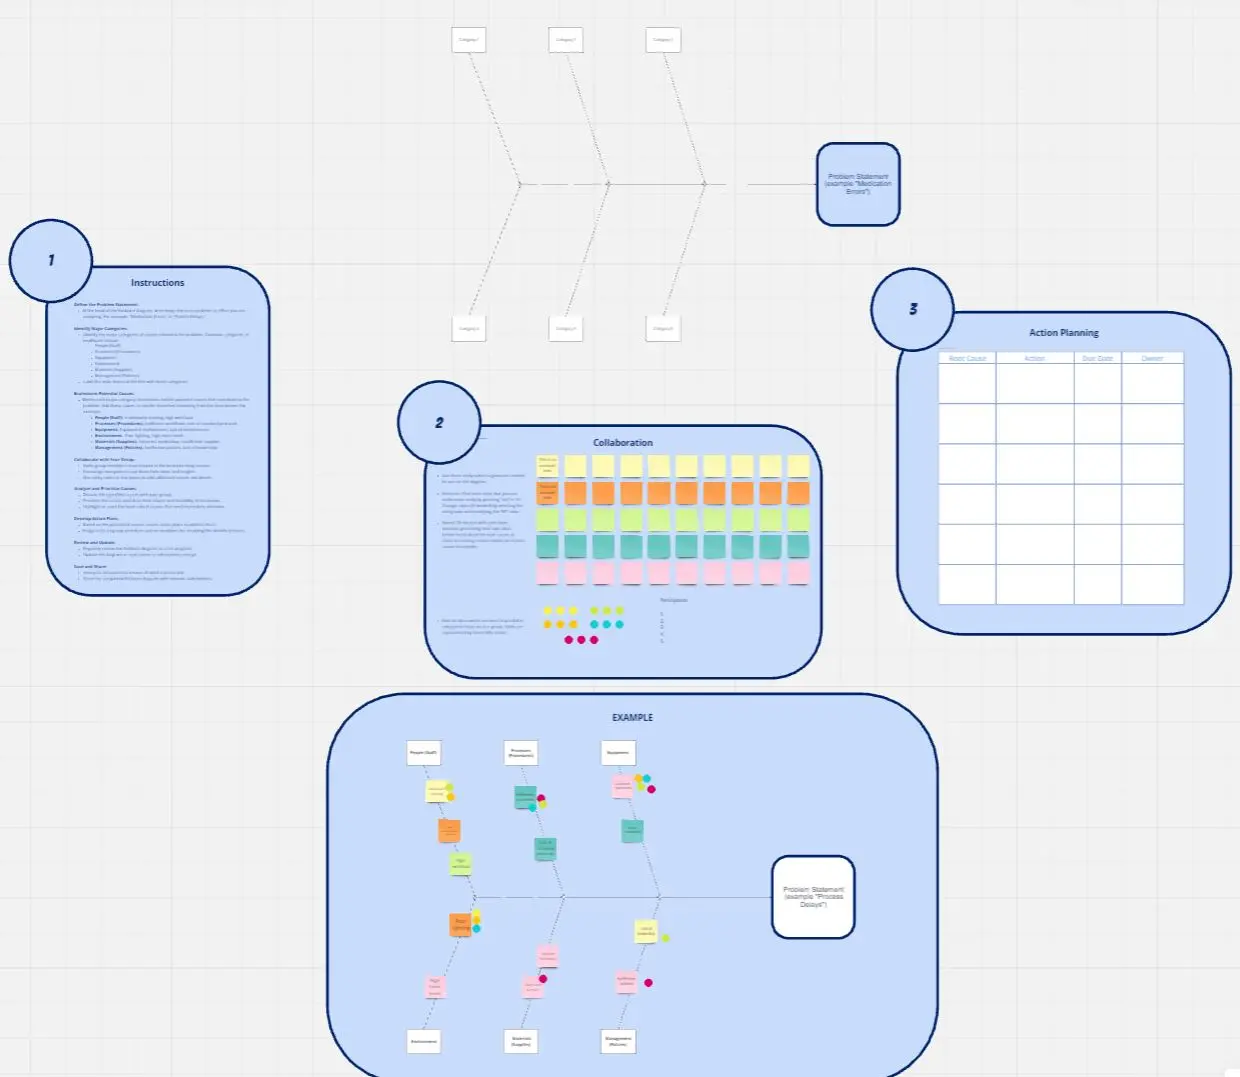
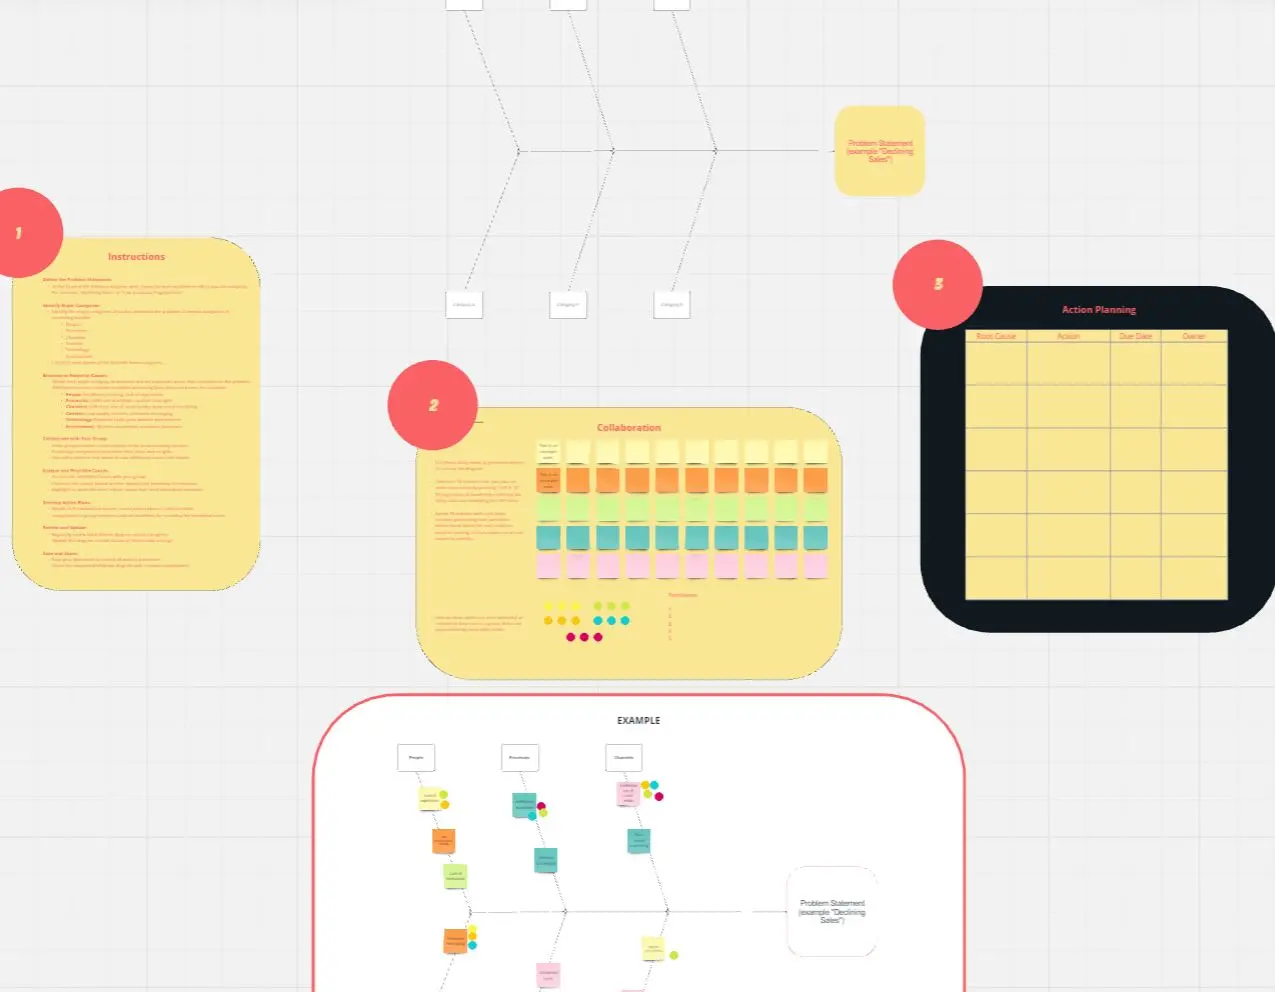
Choose a fishbone diagram template from Miro's collection that best suits your team's needs.
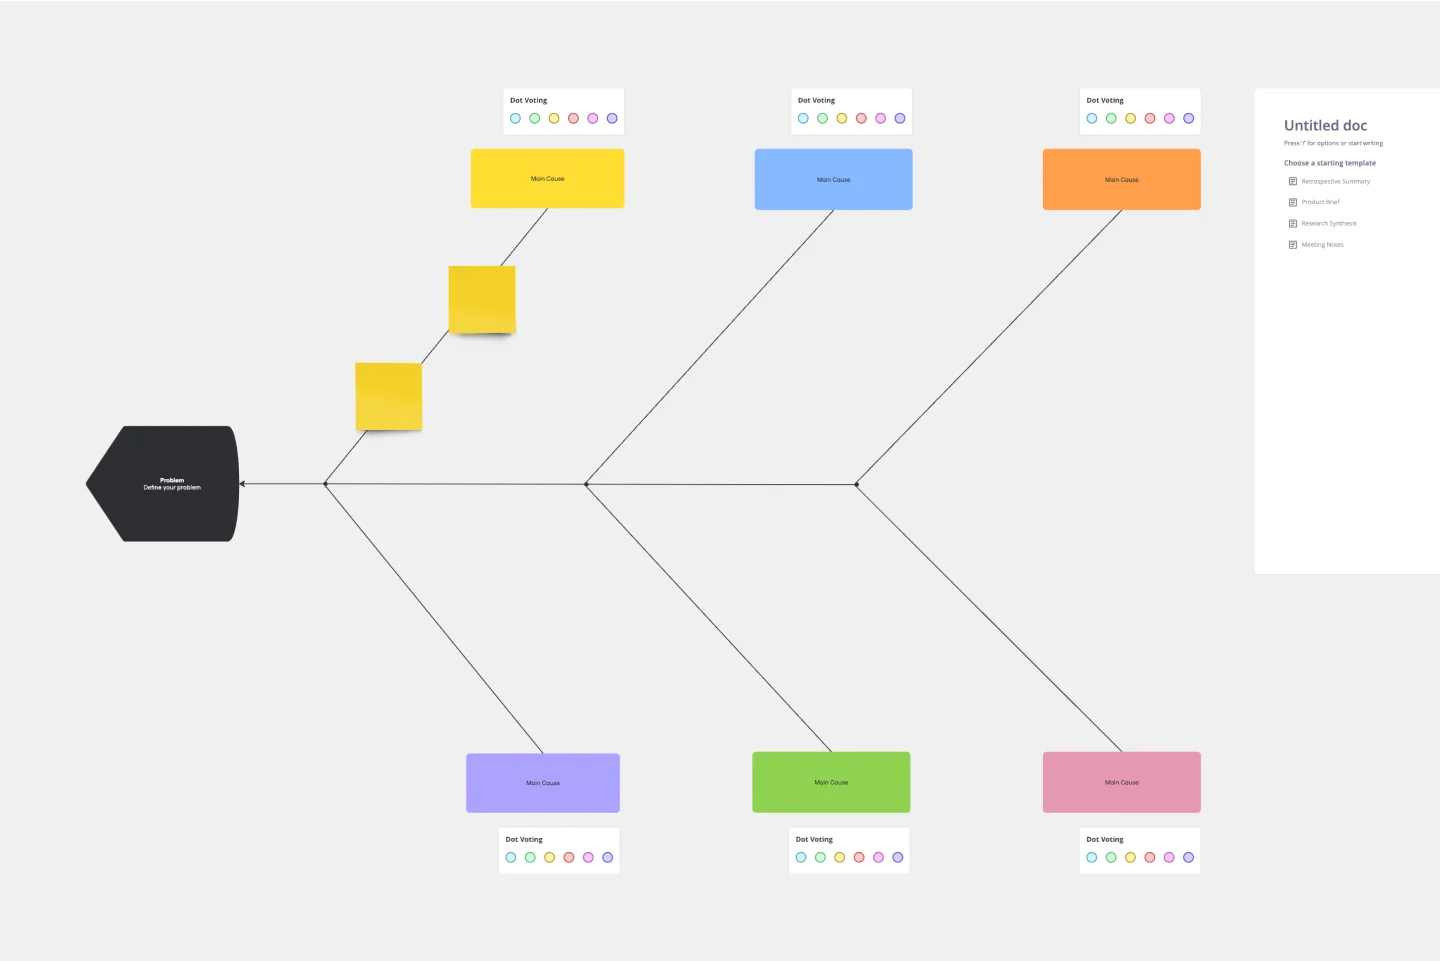
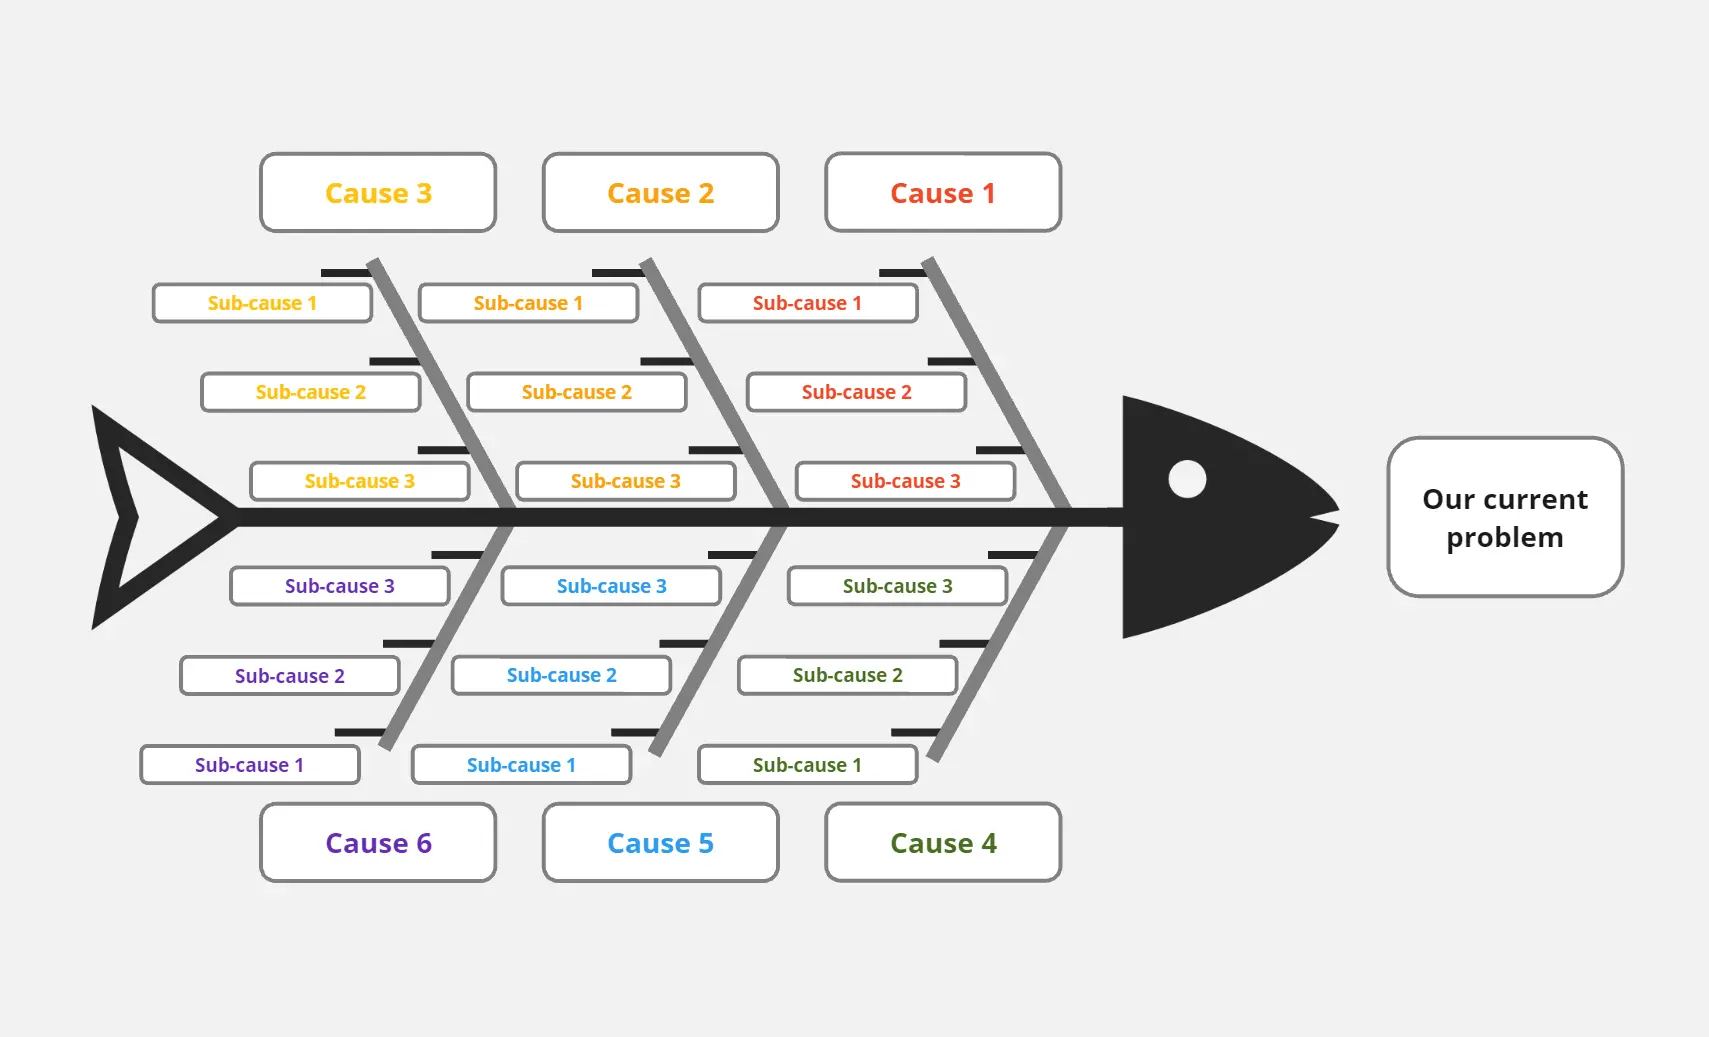
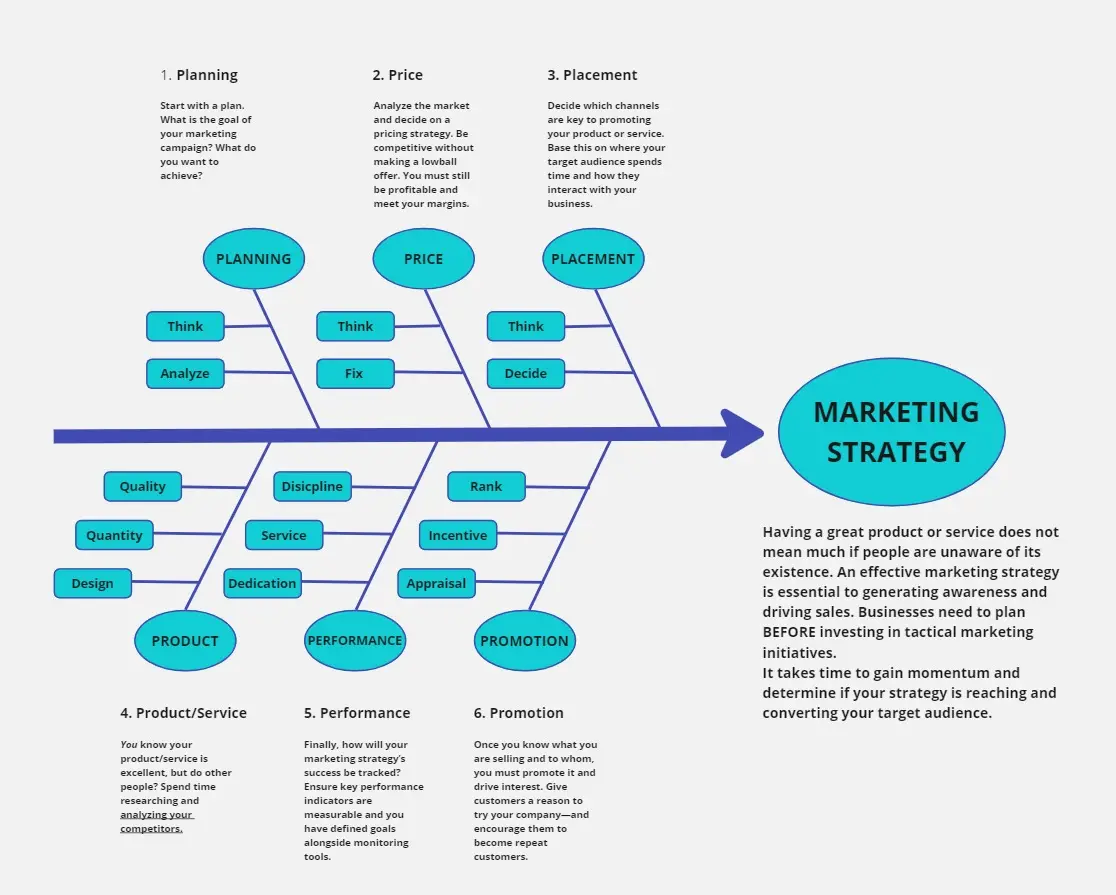
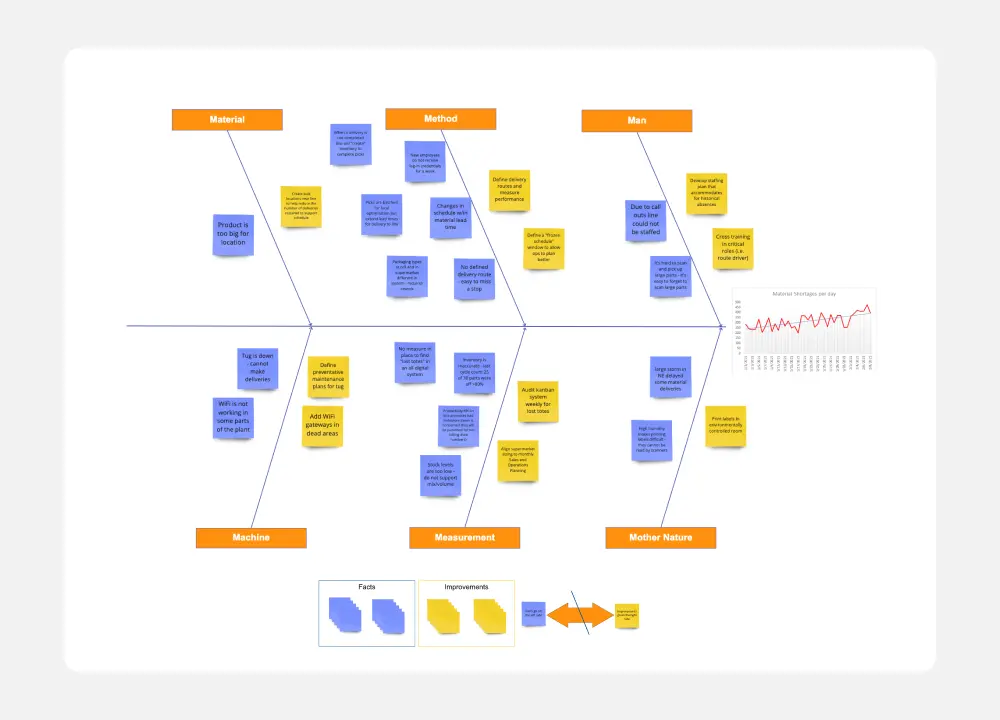
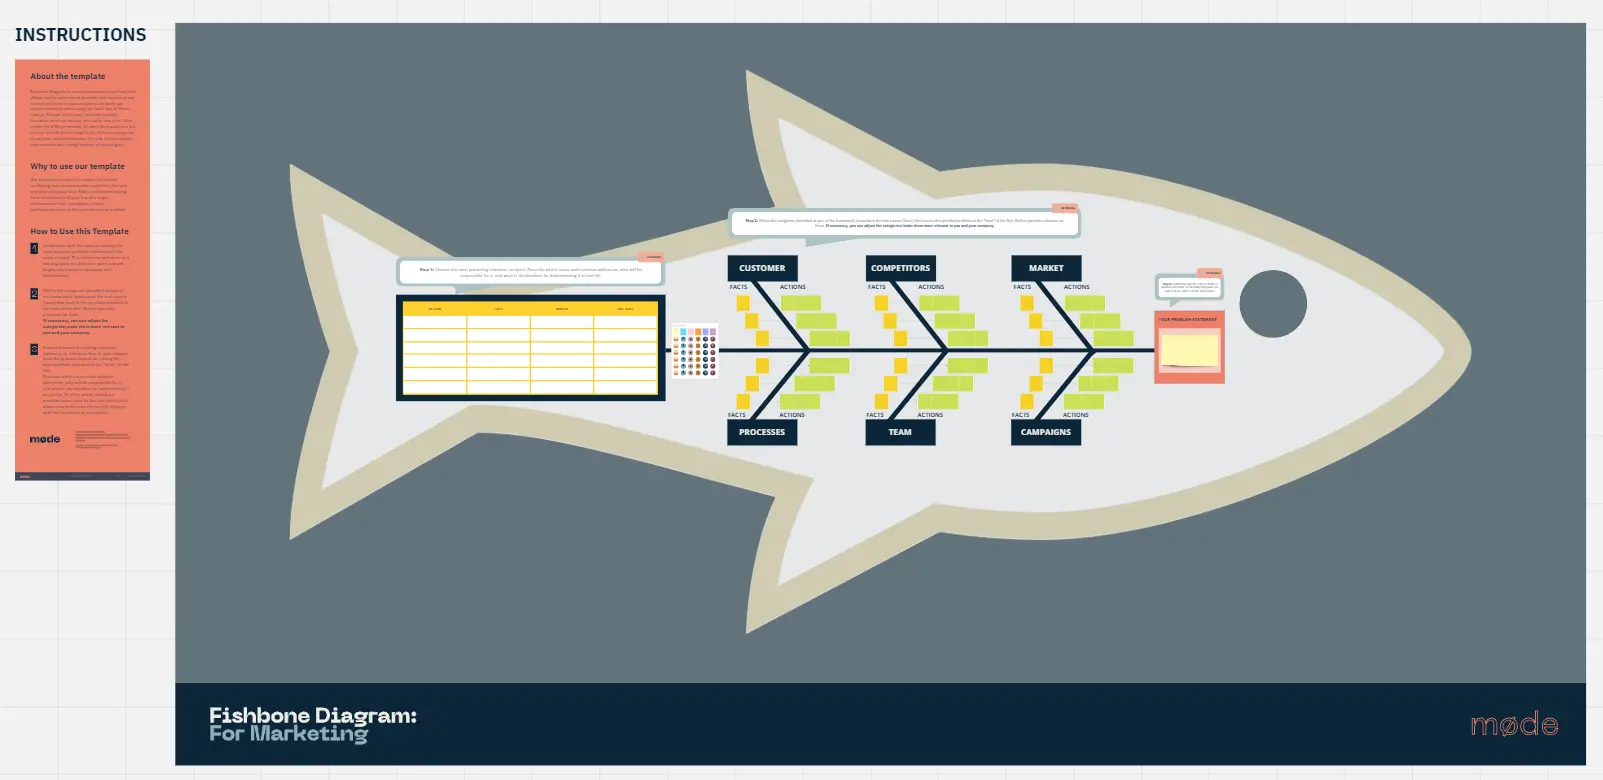
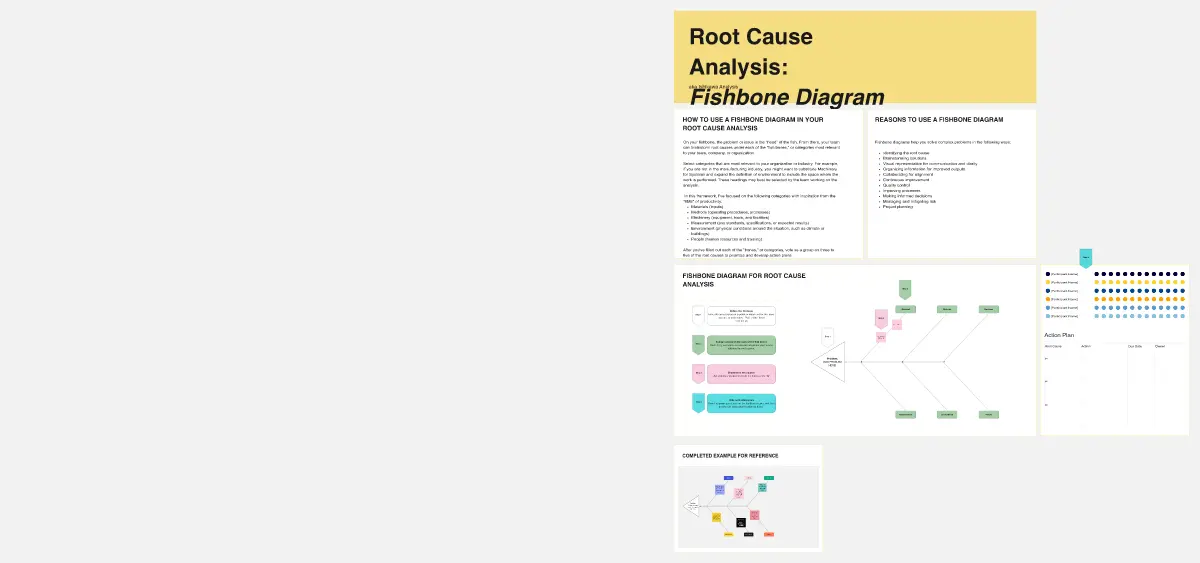
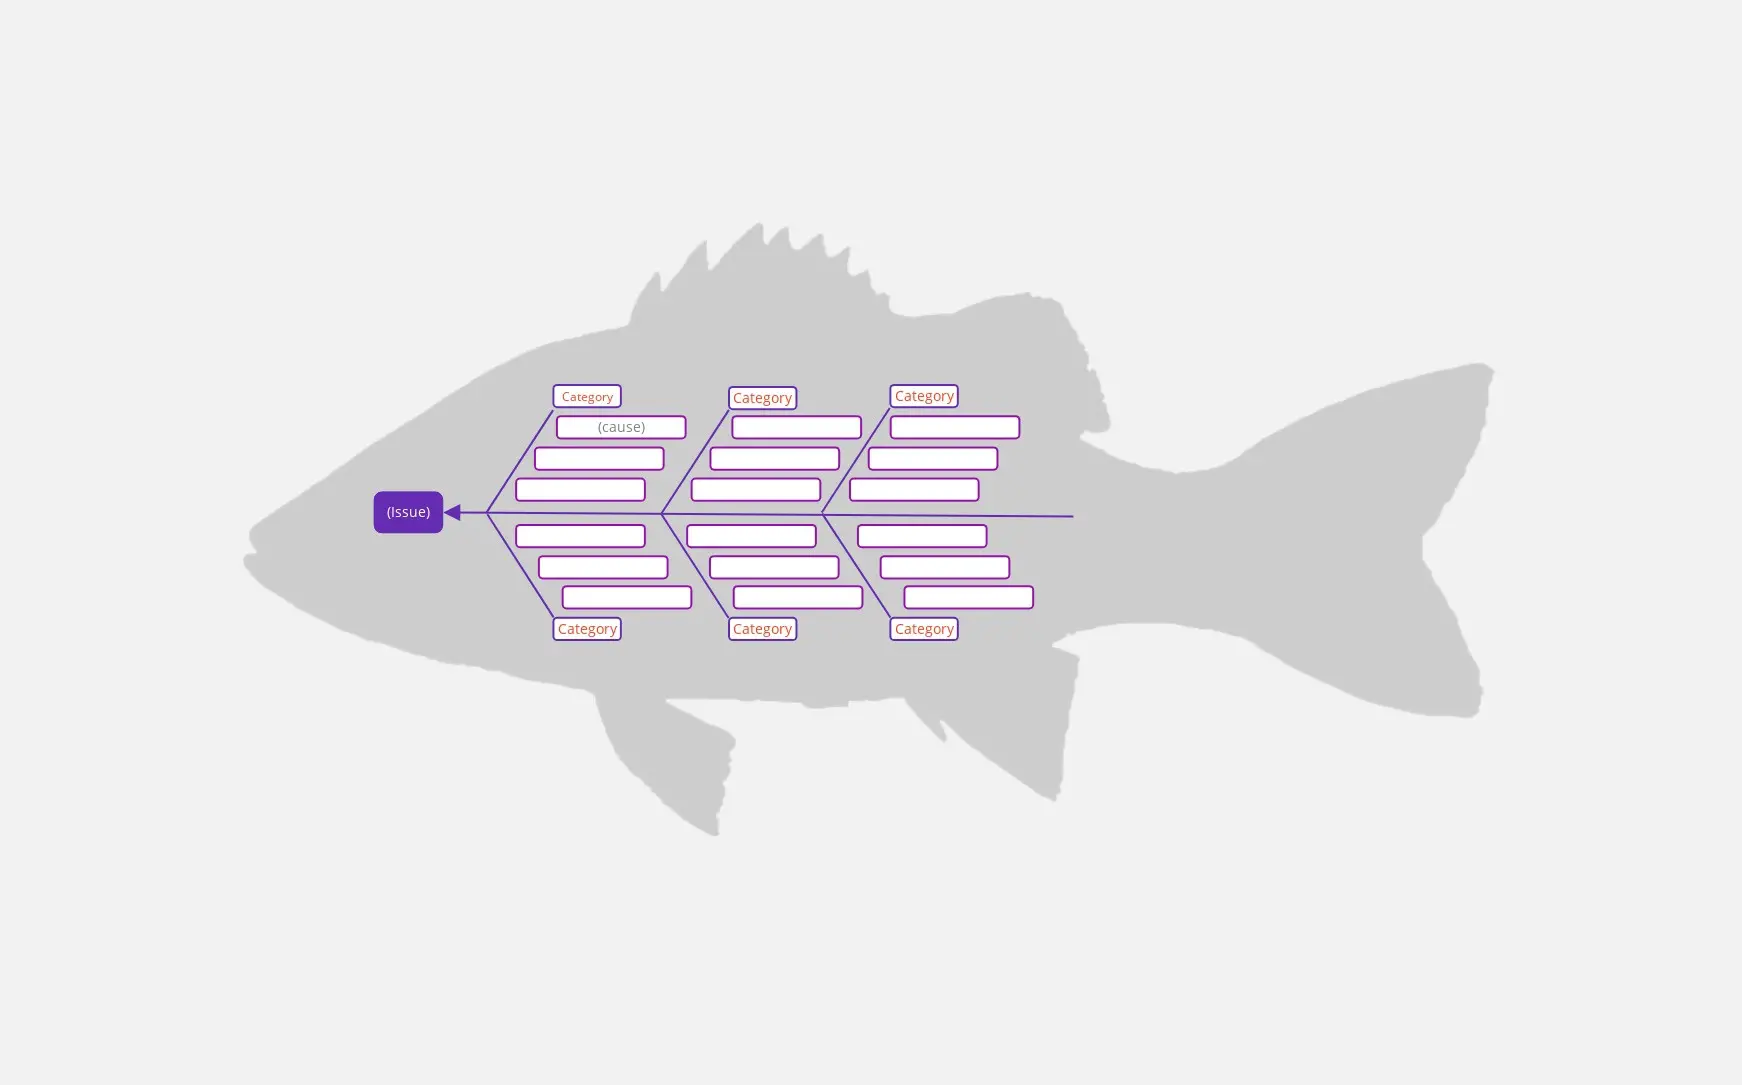
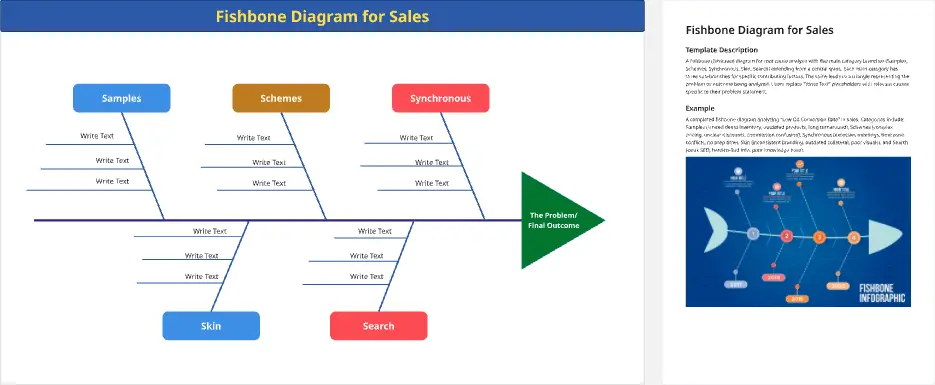
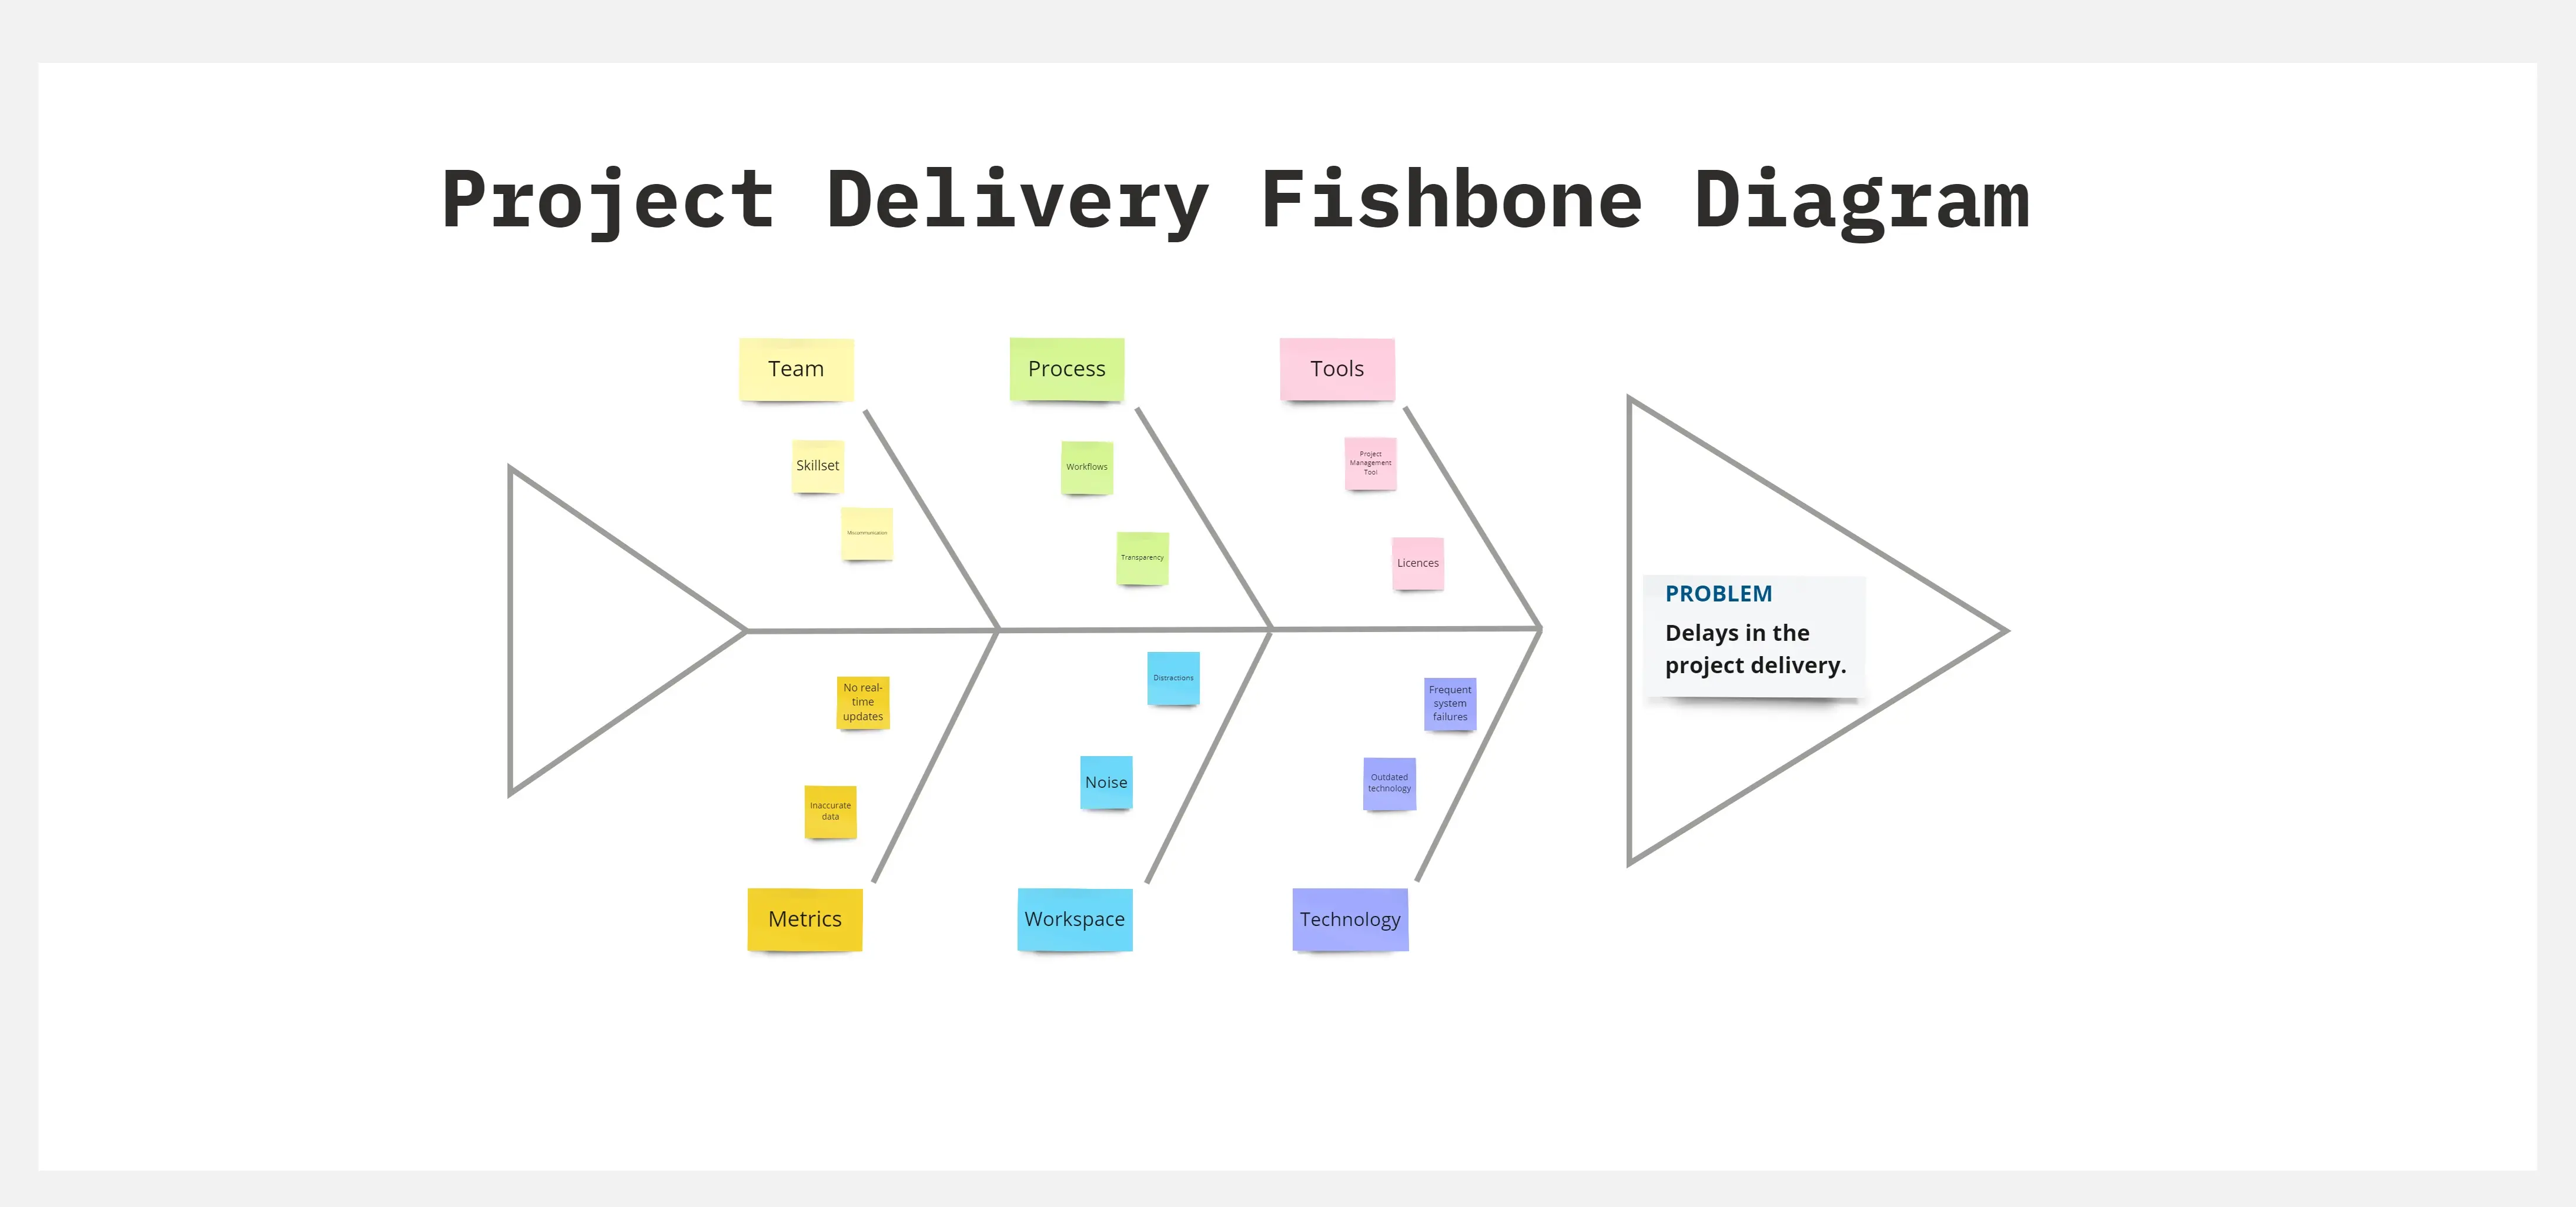
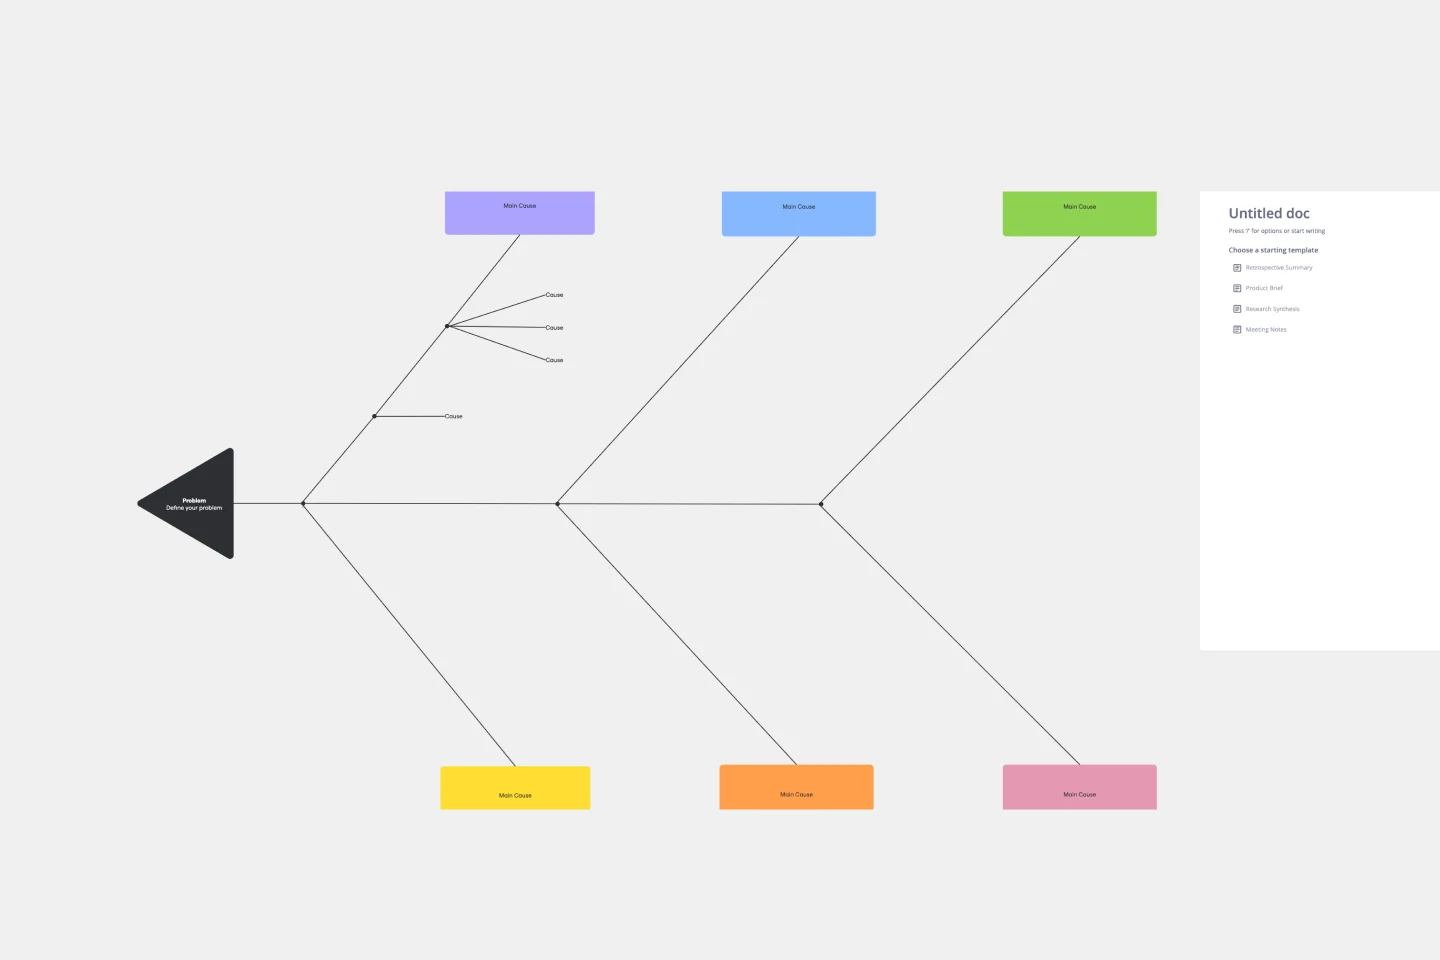
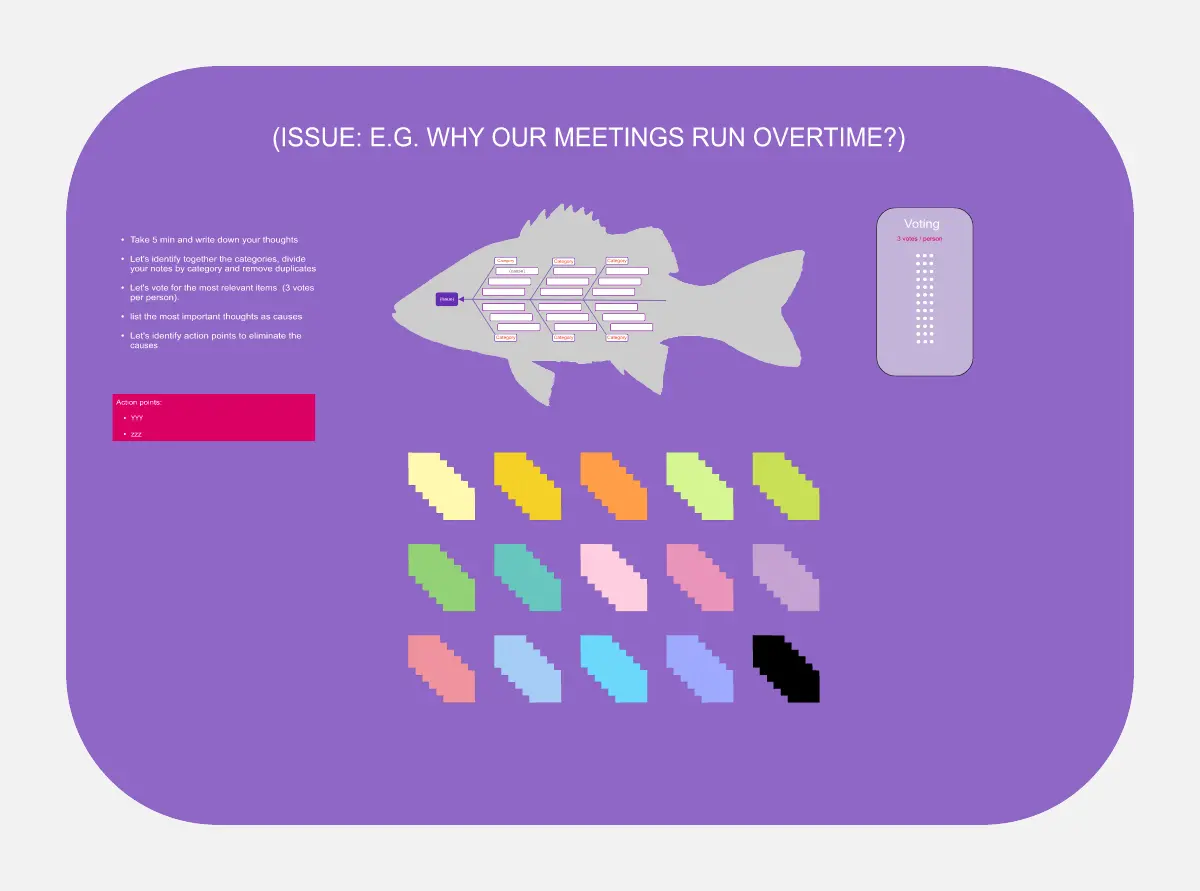
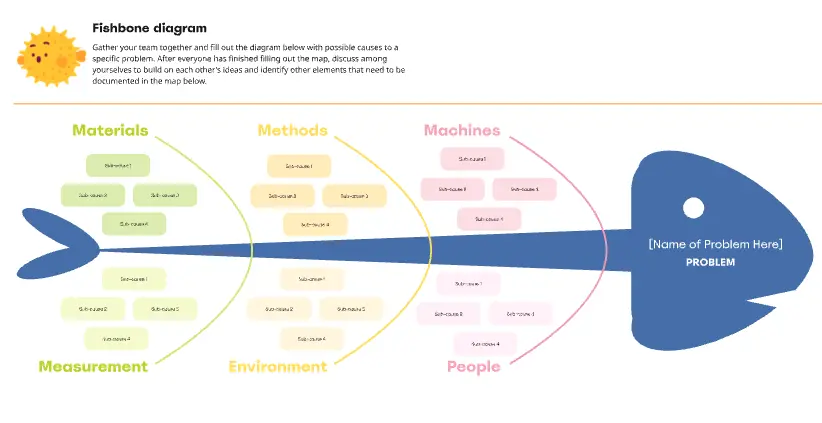
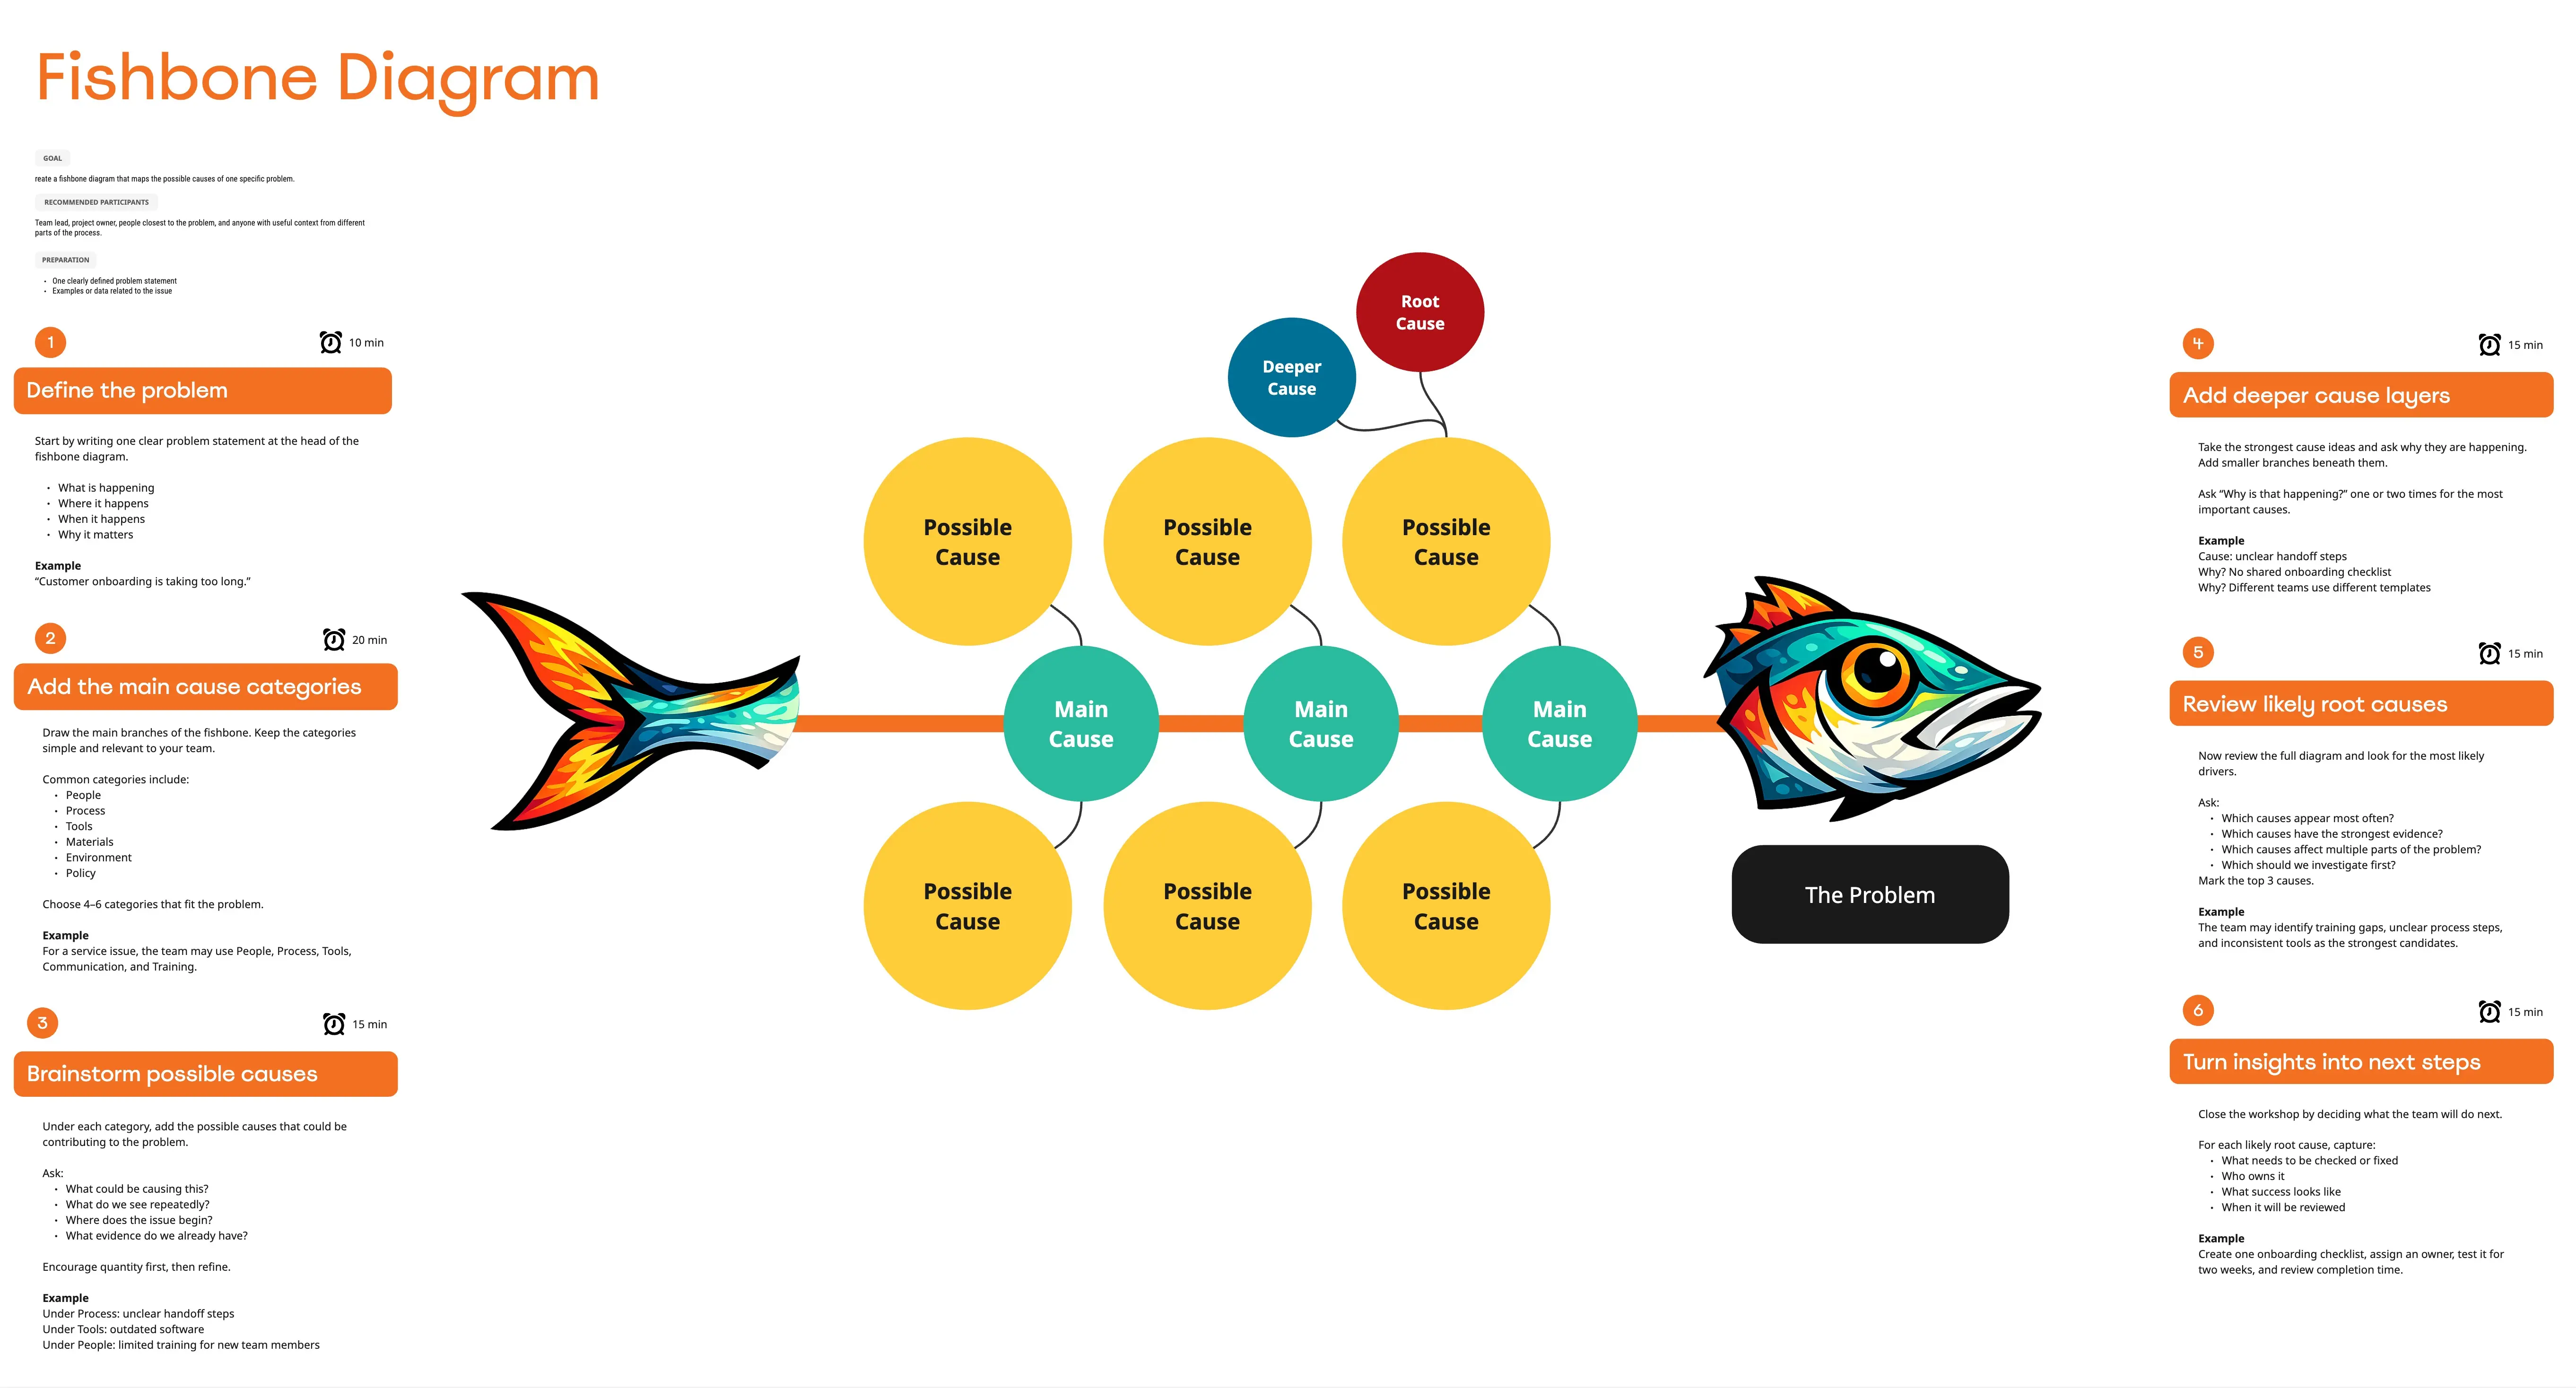
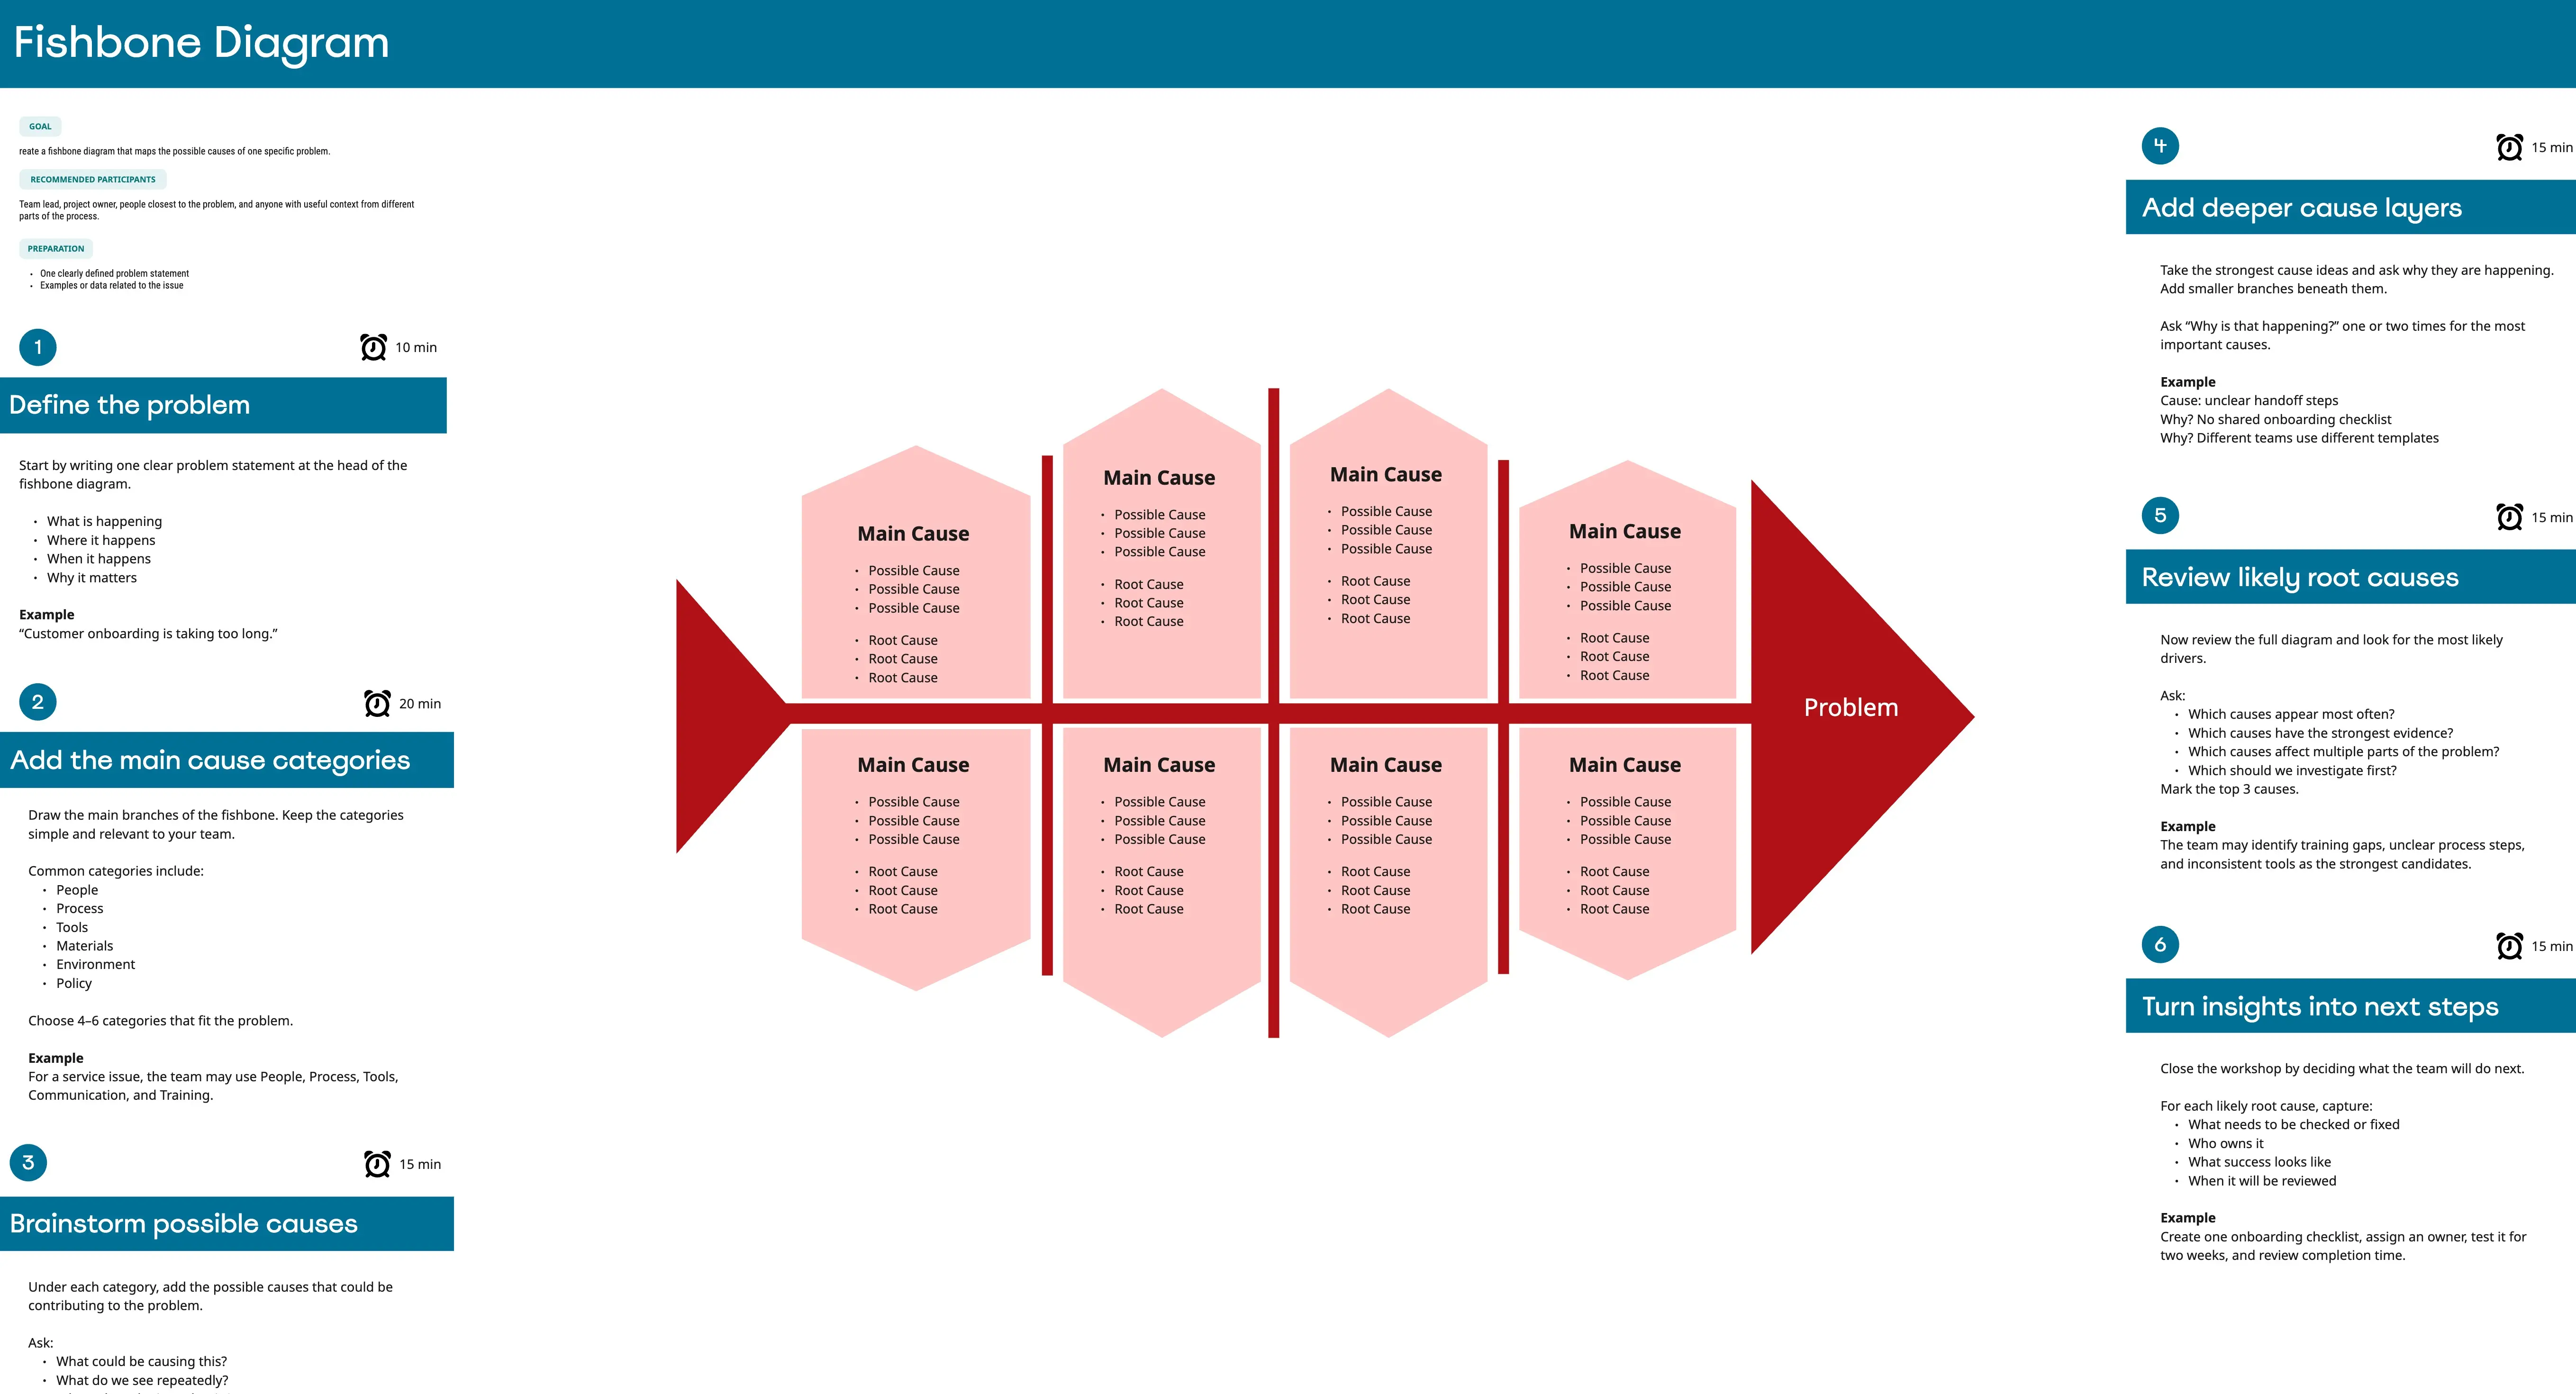
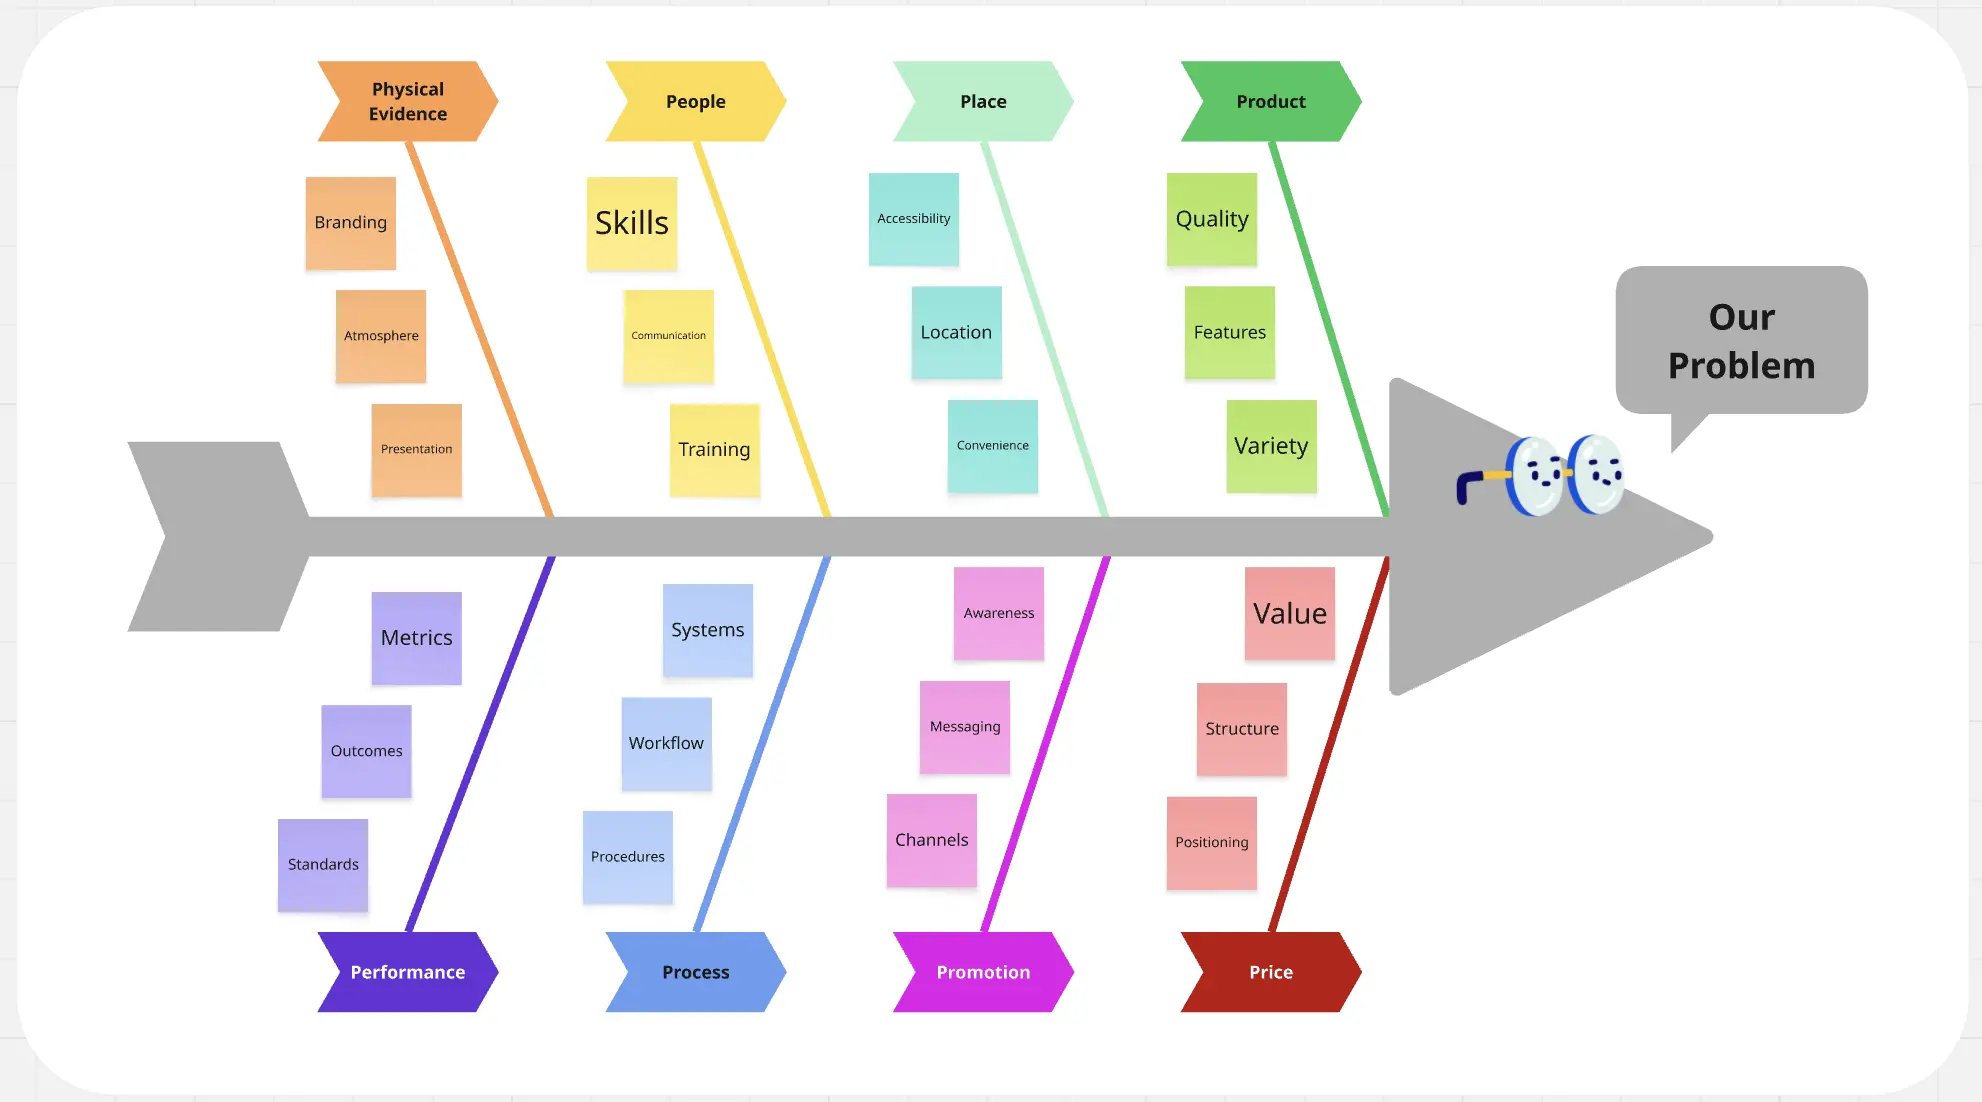
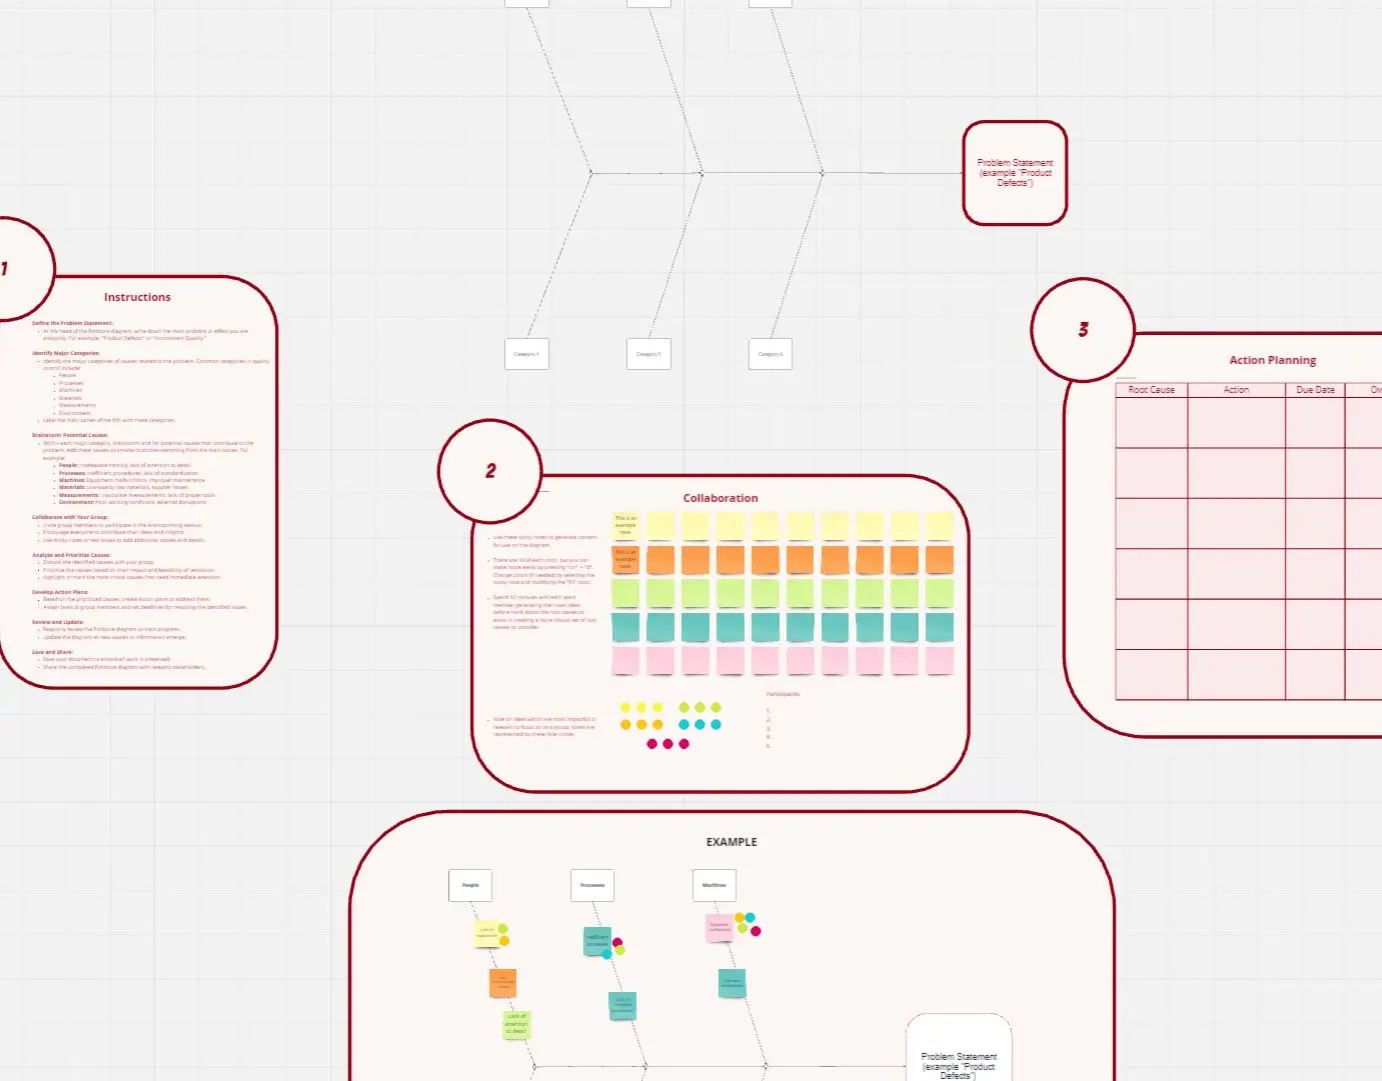
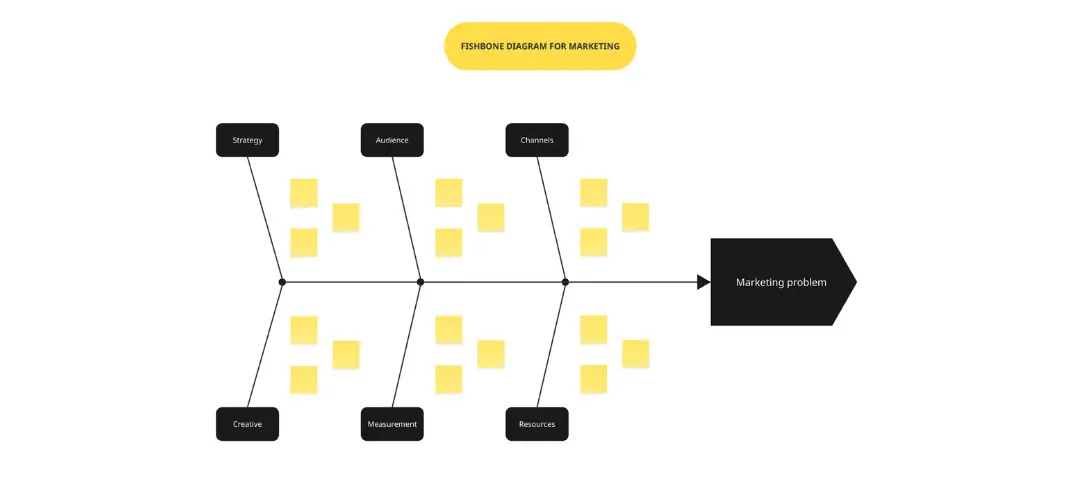
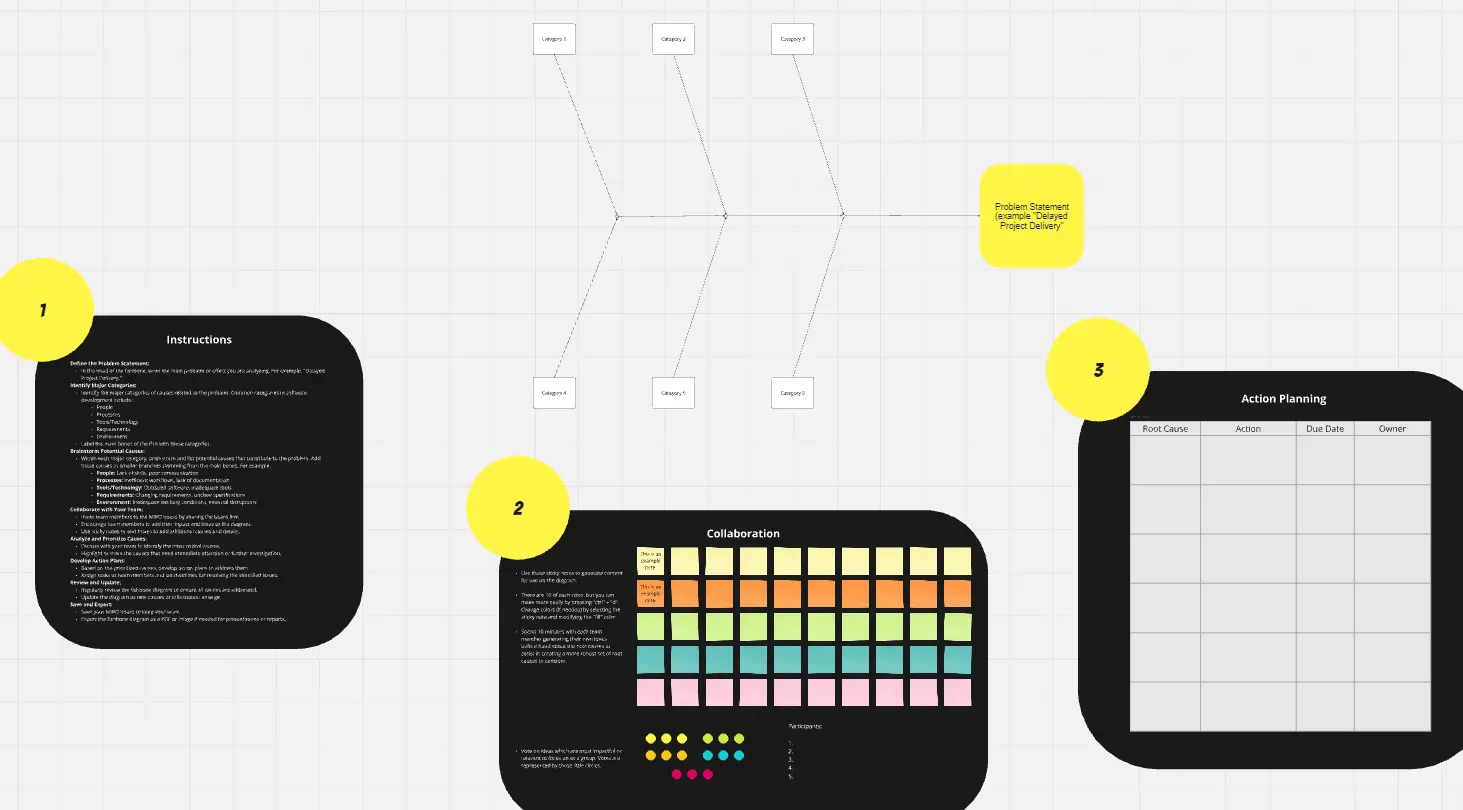
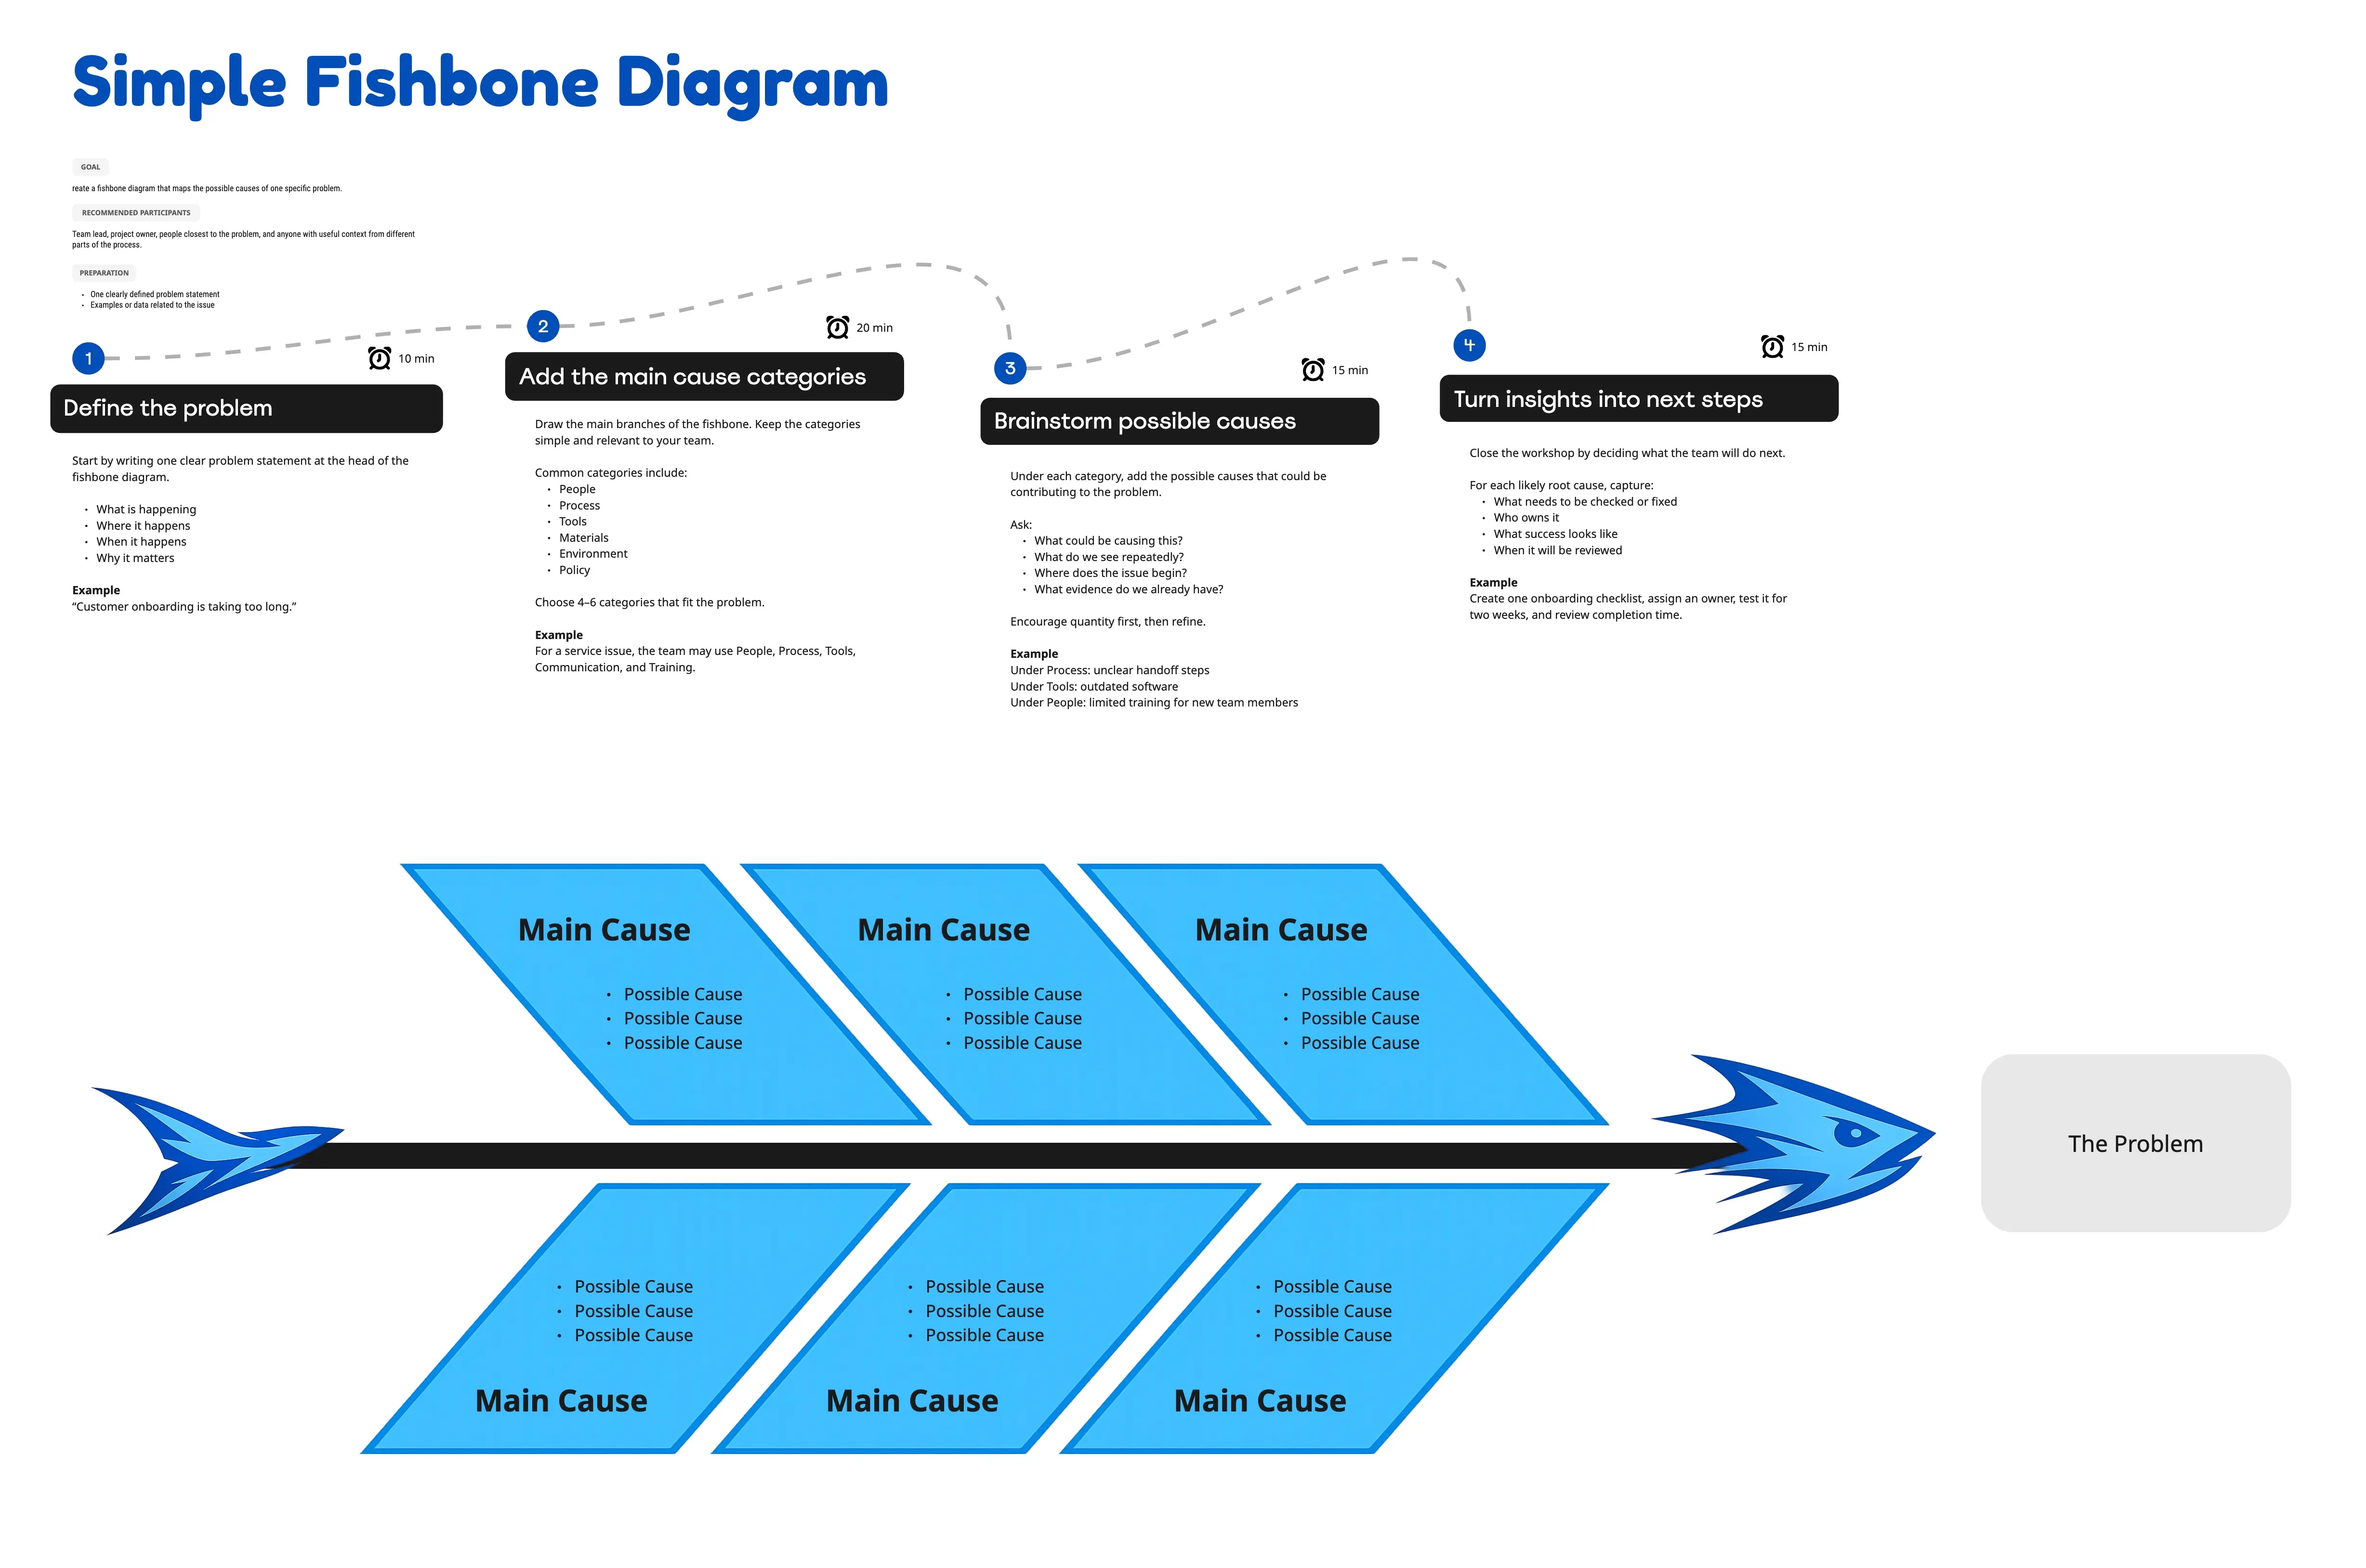
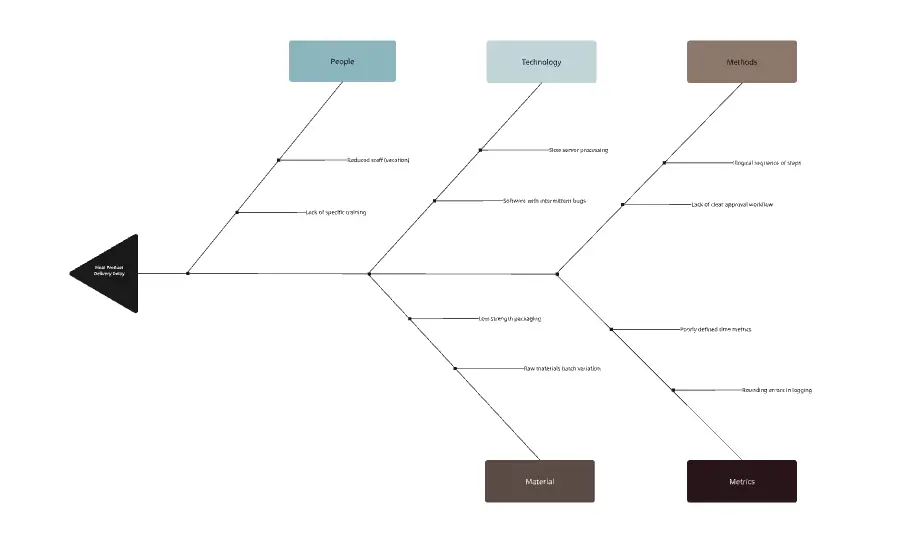
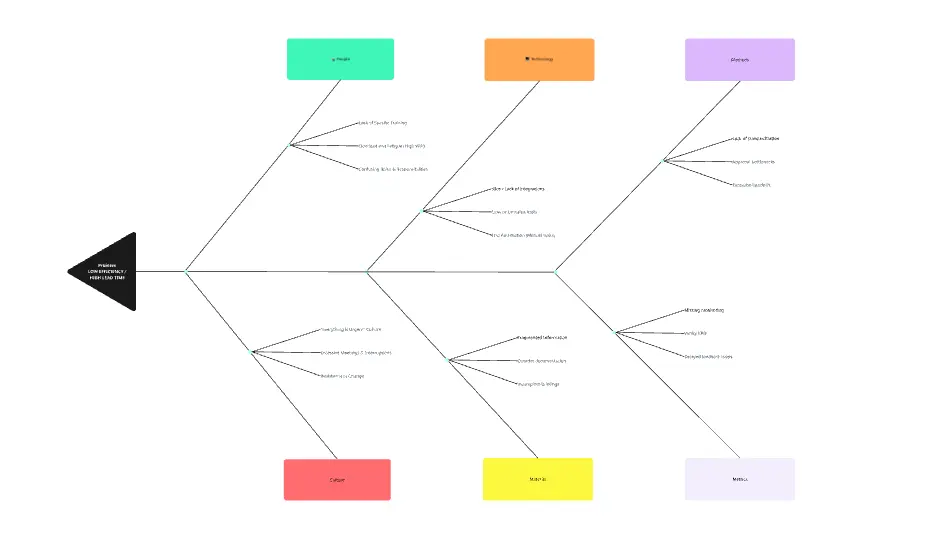
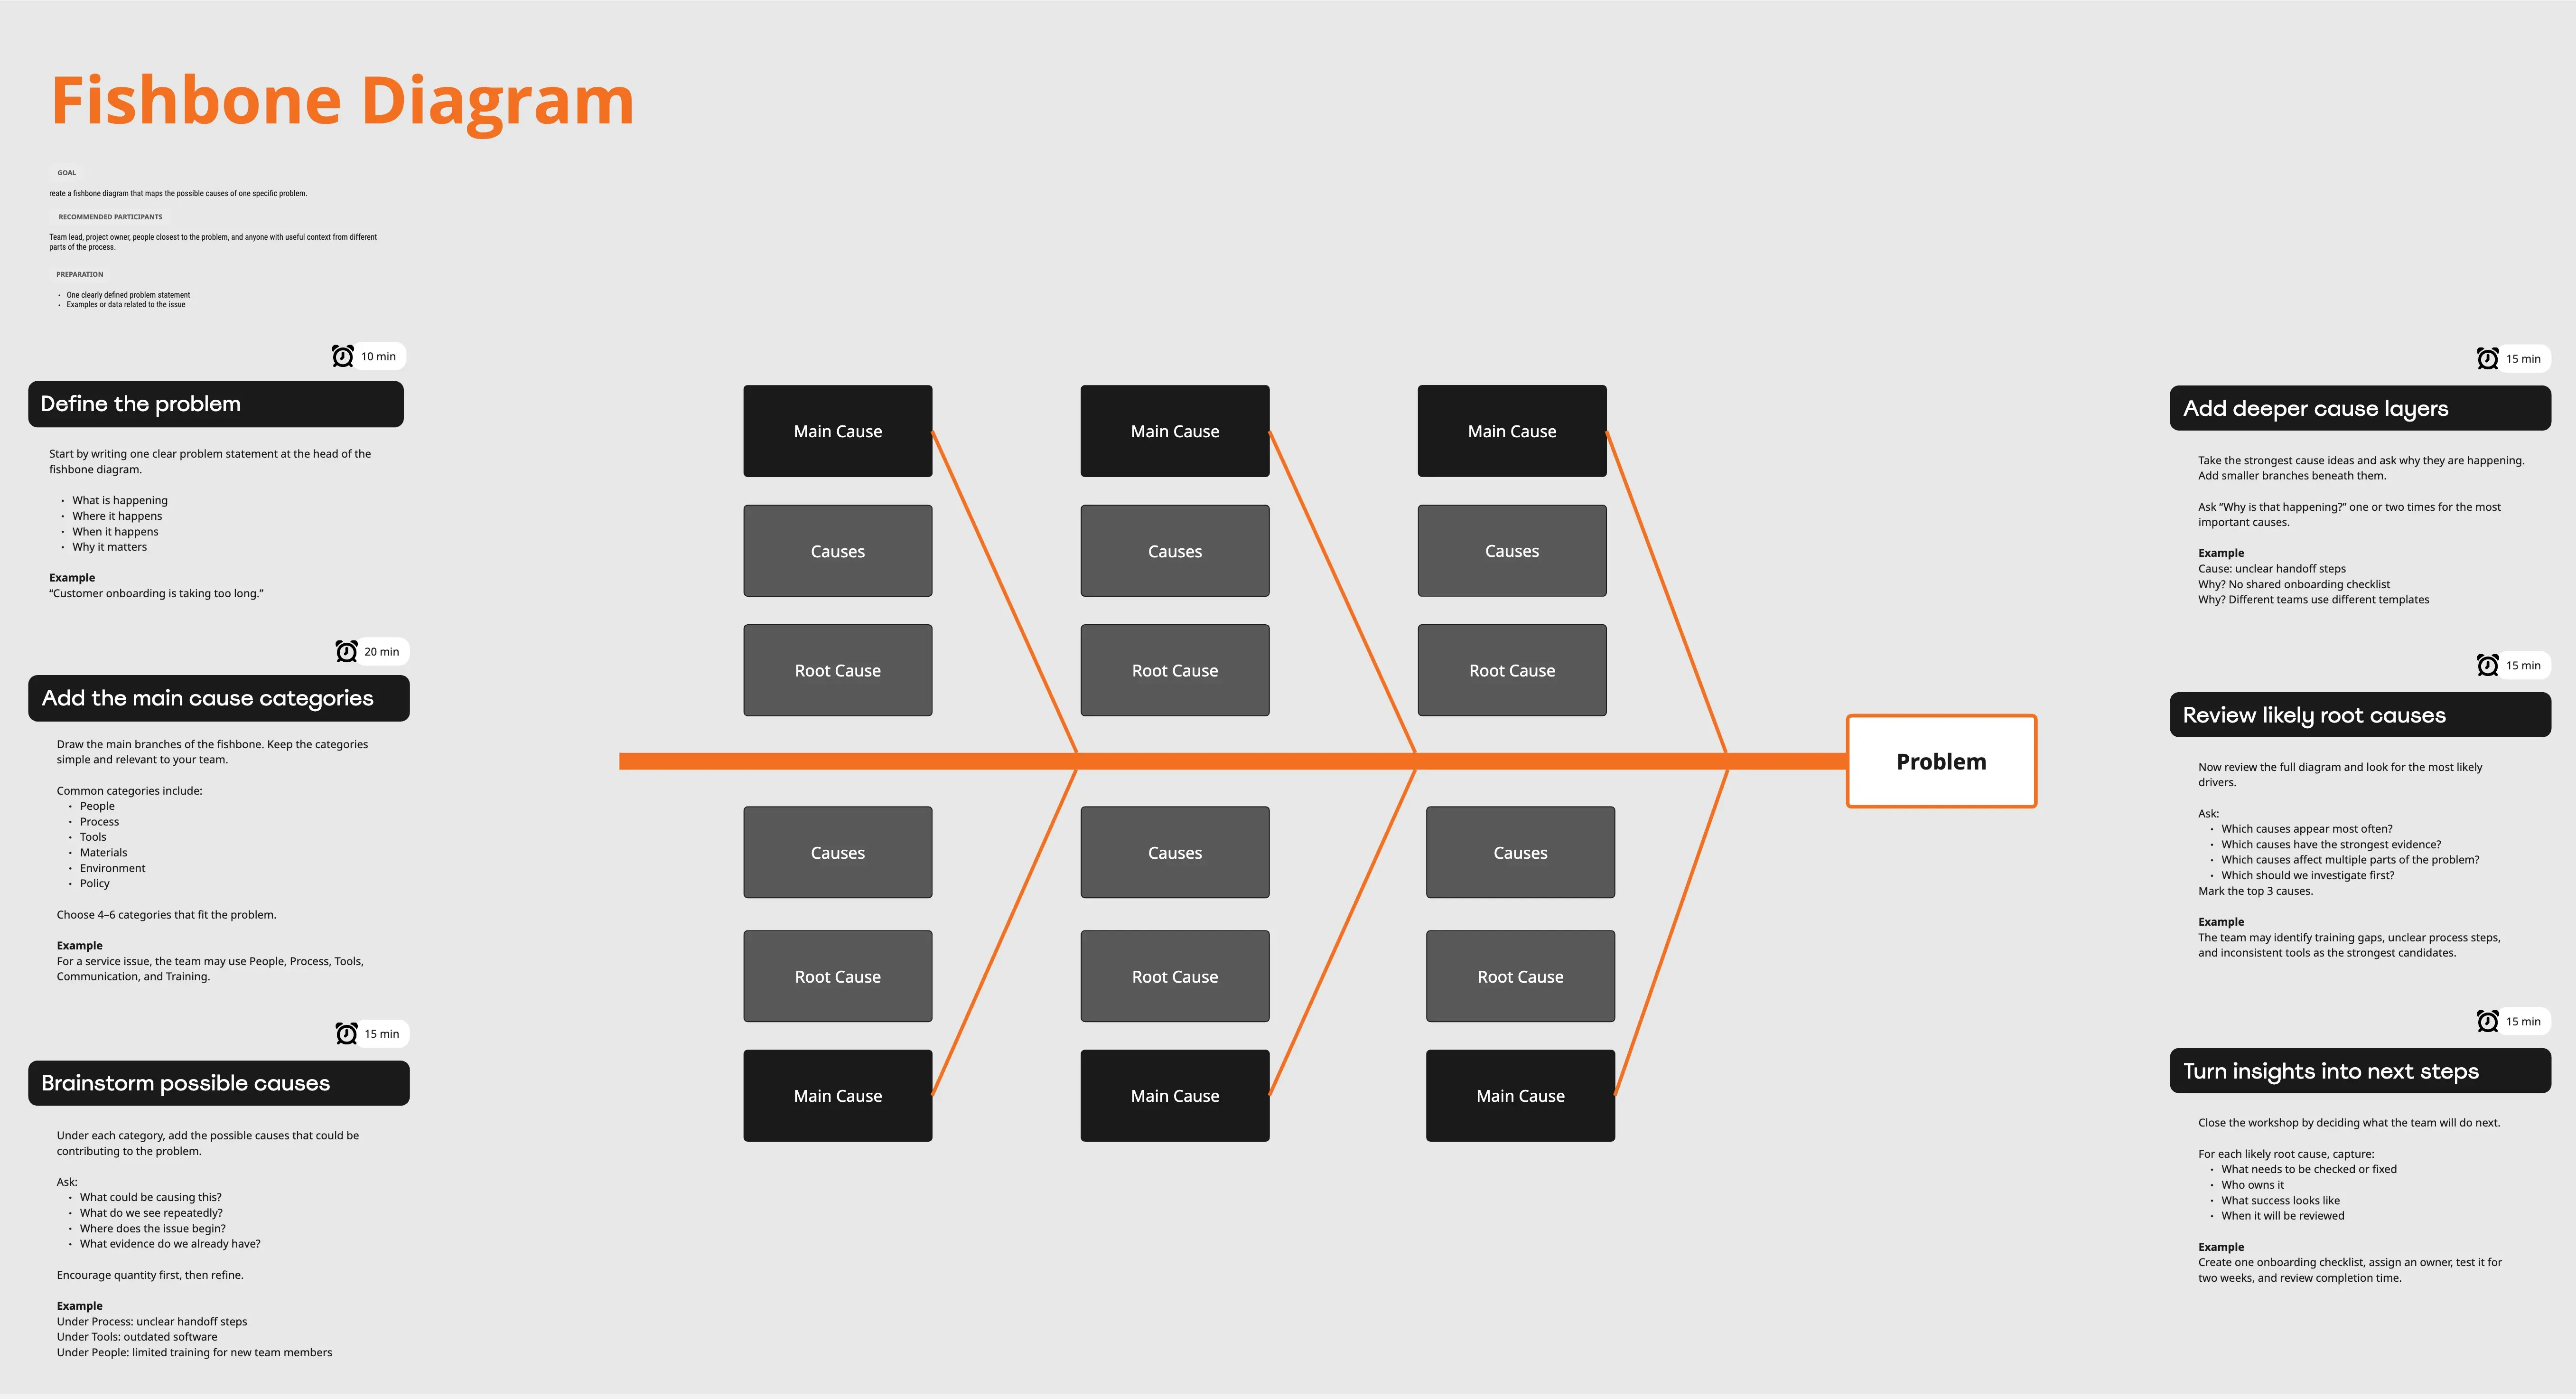
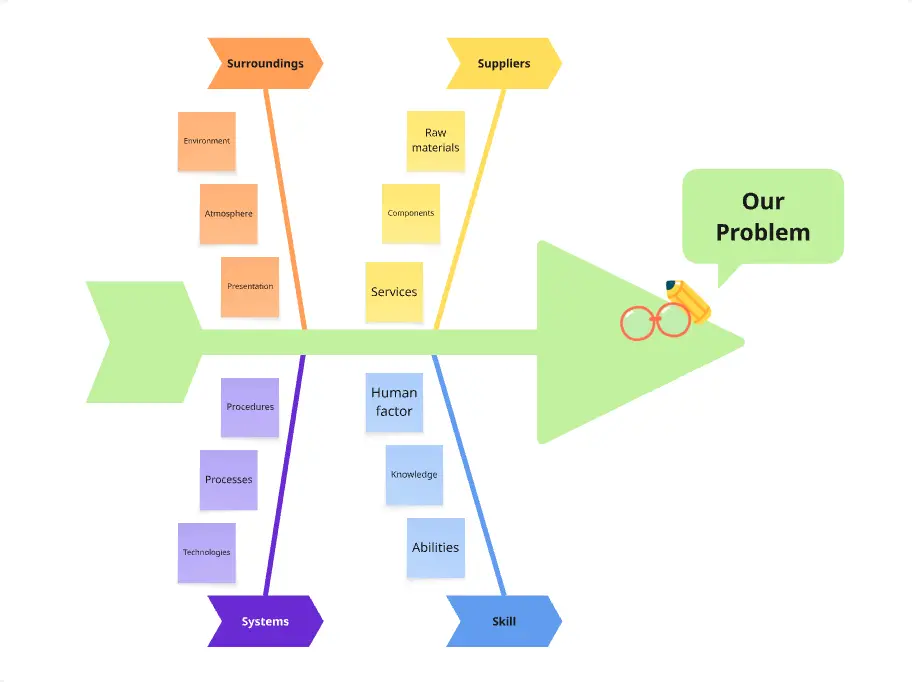
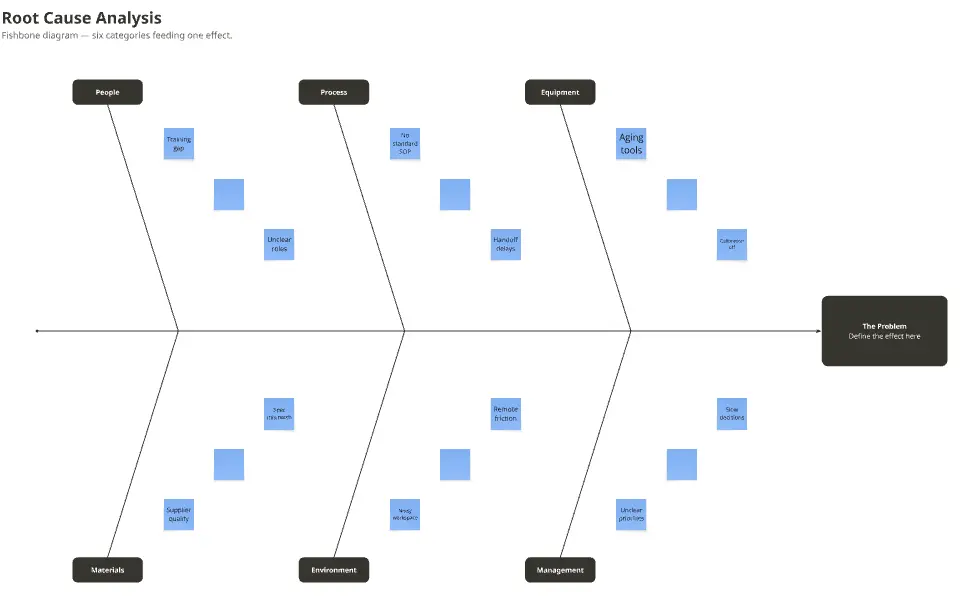
Start by identifying the problem or effect and place it at the head of the fishbone.
Invite your team to join the board and collaborate in real time.
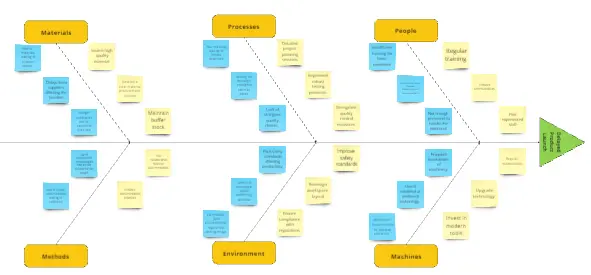
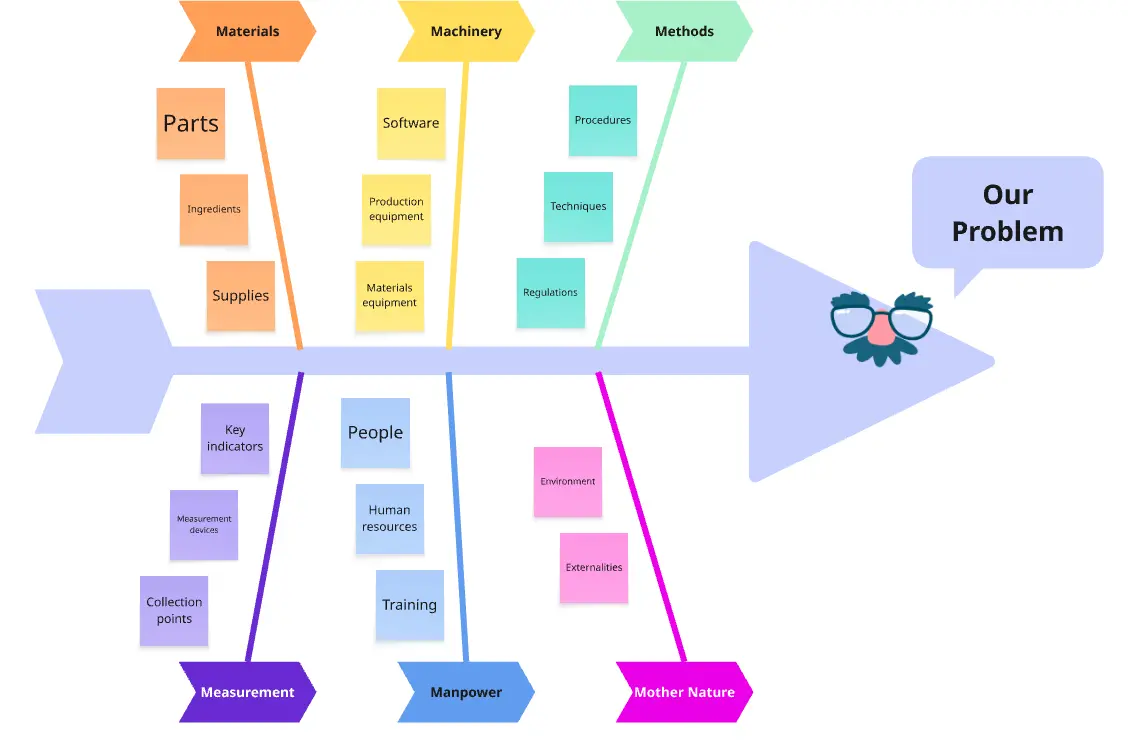
Brainstorm potential cause categories and use them as the "bones" off the main arrow. Common categories include Methods, Equipment, People, Materials, Environment, and Processes.
Under each category, add branches that represent specific causes within that category. Encourage your team to contribute their insights.
Use Miro's features to vote on the most likely causes or to group similar causes together.
Once all potential causes are identified, discuss and prioritize them to determine which ones to investigate further.
Develop an action plan based on your findings and assign tasks directly within Miro to ensure follow-through.
By following these steps, your team can harness the full potential of Miro's fishbone diagram templates to foster a collaborative environment, streamline the problem-solving process, and move forward with clarity and consensus.