Crowd Sourced Cause and Effect
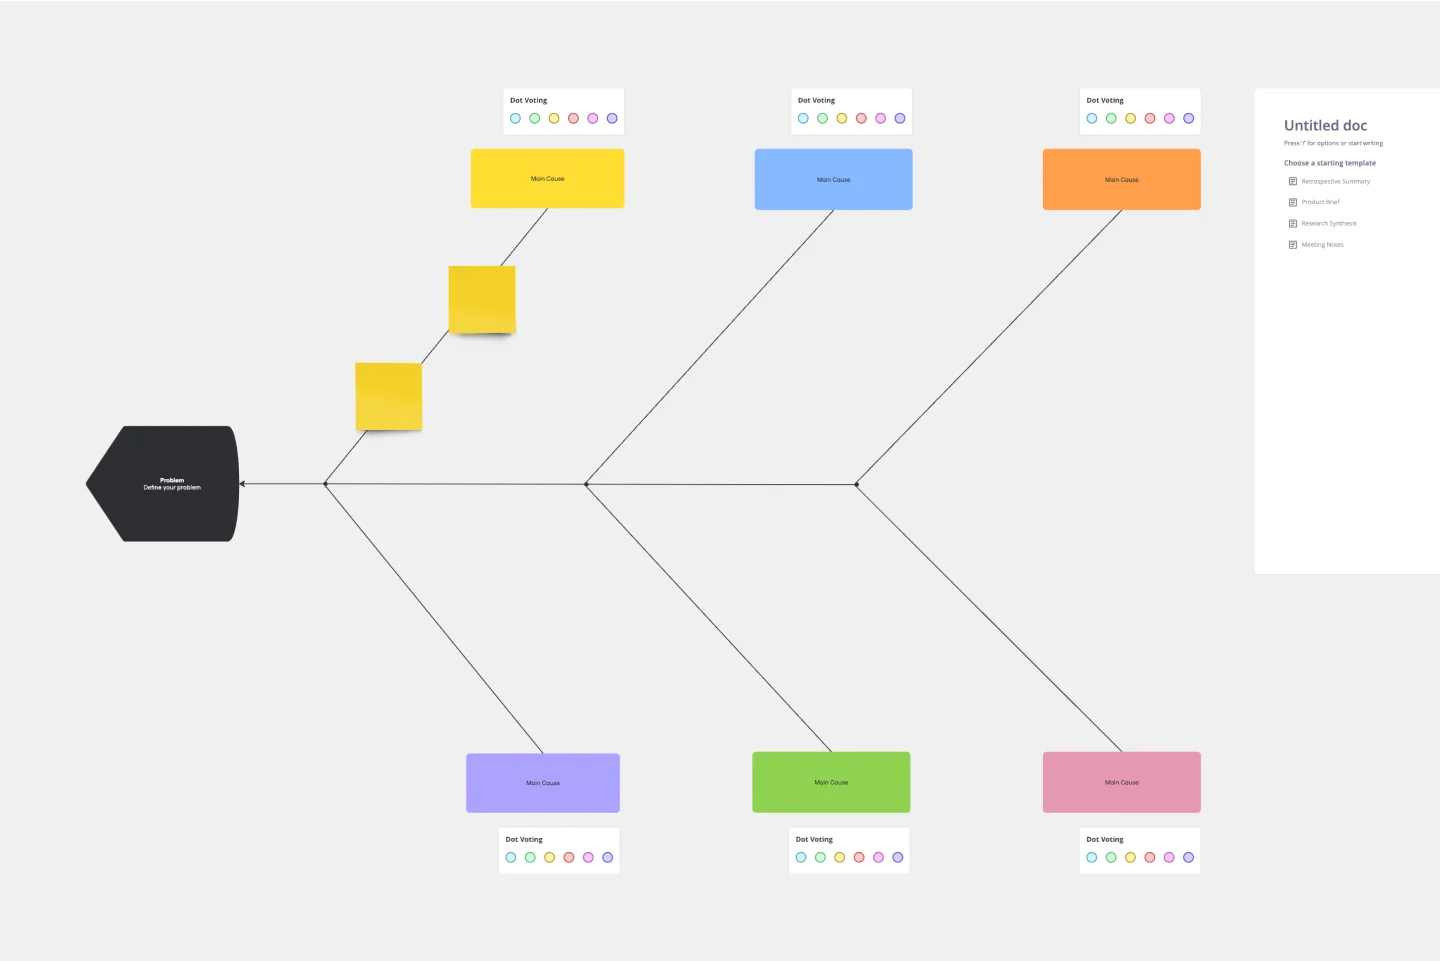
CEDAC stands for Cause and Effect Diagram with the Addition of Cards.
To many, CEDAC is a fishbone diagram with ribs that contain issues on one side of the rib and solutions on the other. But really, it was intended to be more than that. It’s inventor, Fukuda won a Deming Prize for its development. To him, CEDAC was a management technique. So, unlike many other techniques used by practitioners of lean that assume the answer/solution can be created from what is already available, Fukuda’s CEDAC can spawn experiments and research to gain better understanding.
The CEDAC tool is highly diverse and can be used to visualize and problem solve across a wide variety of issues. You can use it to understand issues with new product development, to discern why certain software features are not working as intended, to define possible failure modes in product design, or to comprehend why your accounts receivable backlog is growing (just to name a few). Perhaps the most interesting applications come in defining obstacles where the problem is “created” and the solution is not readily apparent. Created problems don’t necessarily look back historically at what happened to get us here but define a future state not yet achieved. Utilizing CEDAC it’s possible to visualize obstacles that must be overcome before reaching our defined target. These targets could be driven by a desire to increase market share, launch a new business, increase our customers spend per transaction, the list really goes on and on.
Using this tool in Miro you have the ability to gain insights from far more resources than what is available to you with a physical board. Perhaps you can make the board public and get insights from other industry professionals via a post of your favorite social media outlet. Or, you can imbed the board into a collaboration space that you use frequently and challenge your team members to add a number of cards throughout their workday. Think of the possibilities for crowdsourcing solutions!
This template was created by NEXT LEVEL Partners.
Get started with this template right now.
Technology Roadmap Template
Works best for:
Agile Methodology, Roadmaps, Agile Workflows
A technology roadmap helps teams document the rationale of when, why, how, and what tech-related solutions can help the company move forward. Also known as IT roadmaps, technology roadmaps show teams what technology is available to them, focusing on to-be-scheduled improvements. They allow you to identify gaps or overlap between phased-out tech tools, as well as software or programs soon to be installed. From a practical point of view, the roadmap should also outline what kinds of tools are best to spend money on, and the most effective way to introduce new systems and processes.
BPM
Works best for:
Diagramming
The BPM (Business Process Management) template is a visual tool for modeling, analyzing, and optimizing business processes. It provides a structured framework for documenting process flows, identifying bottlenecks, and improving efficiency. This template enables organizations to streamline operations, enhance productivity, and drive business performance. By promoting process transparency and agility, the BPM template empowers teams to achieve operational excellence and deliver value to stakeholders.
Cisco Network Diagram Template
Works best for:
Software Development, Diagrams
Cisco offers data center and access networking solutions built for scale with industry-leading automation, programmability, and real-time visibility. The Cisco Data Network Diagram uses Cisco elements to show the network design of Cisco Data Networks visually.
Product Roadmap (Now, Next, Later, Trash)
Works best for:
Planning, Mapping
The Product Roadmap (Now, Next, Later, Trash) template allows teams to organize their product development initiatives into four distinct categories: current priorities, upcoming features, future plans, and discarded ideas. By visualizing the roadmap in this manner, teams can maintain focus on immediate objectives while keeping an eye on future opportunities and managing stakeholder expectations effectively.
5-Set Venn Diagram
Works best for:
Venn Diagram
Analyze complex data with the 5 Set Venn Diagram template. This tool allows you to compare and contrast five different sets of data, highlighting intersections and unique elements. Perfect for in-depth data analysis, research, and strategic planning. Ideal for analysts, researchers, and educators looking to present comprehensive data insights in a clear and visual manner.
ERD Supply Chain Management System Template
Works best for:
ERD
The ERD Supply Chain Management System Template streamlines and optimizes supply chain operations. It serves as a visual support that helps businesses understand and manage the complex relationships between different entities within their supply chain, such as suppliers, products, inventory, orders, and shipments. By providing a clear visualization of these relationships, the template enables users to identify inefficiencies and areas for improvement, facilitating strategic decision-making.