About the Concept Map Templates Collection
Concept maps are powerful for visualizing relationships between ideas, concepts, or pieces of information. Our concept map templates collection offers a variety of editable concept map templates designed to help your team brainstorm, plan, and organize their projects effectively. These templates are adaptable and can be customized to fit the specific needs of any project, making them an essential resource for anyone looking to improve their collaborative efforts.
What are concept maps used for?
Teams use concept maps for everything, from brainstorming new product ideas to organizing complex research projects. Think of them as visual roadmaps for your thoughts. They're especially handy when you're dealing with a lot of information and need a clear way to see the connections between different ideas. Whether you're planning a marketing campaign, mapping out a software feature, or just trying to get your thoughts in order, concept maps can be a game-changer. They help with:
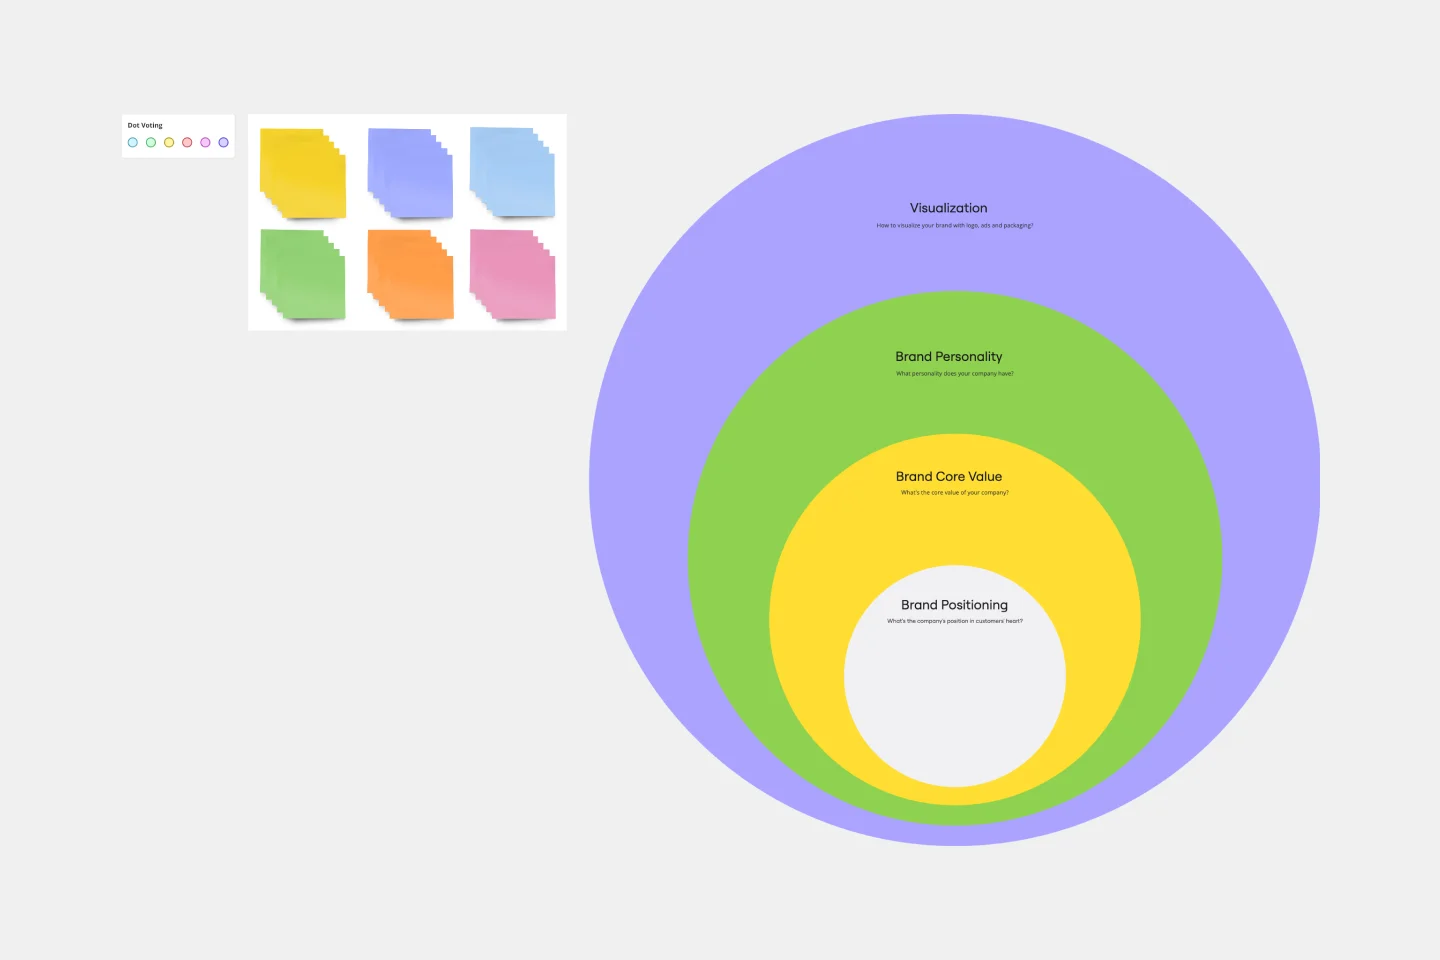
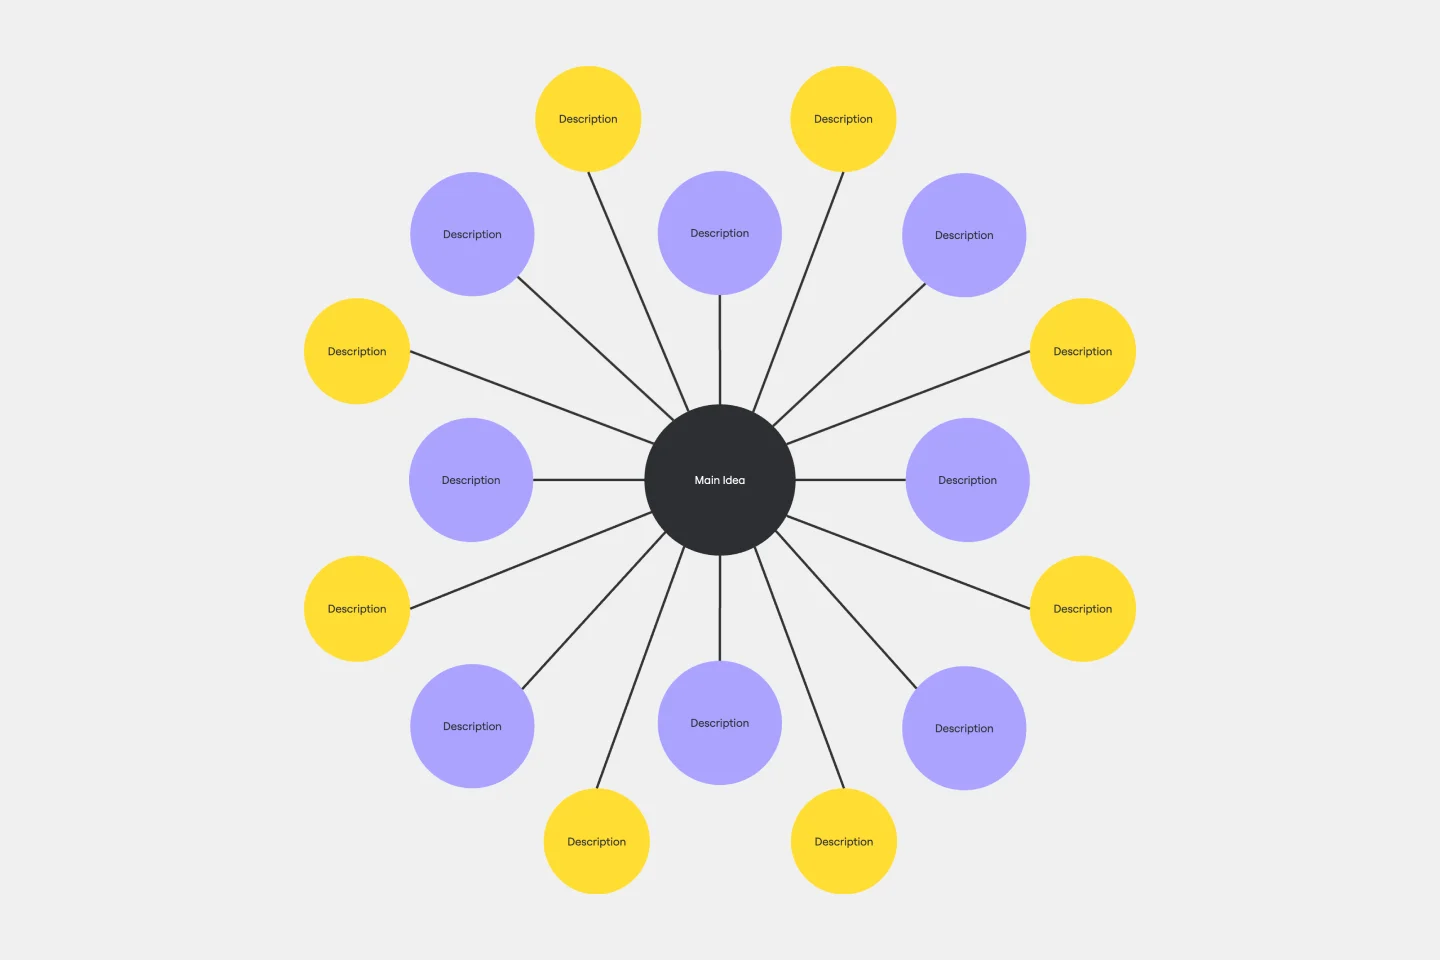
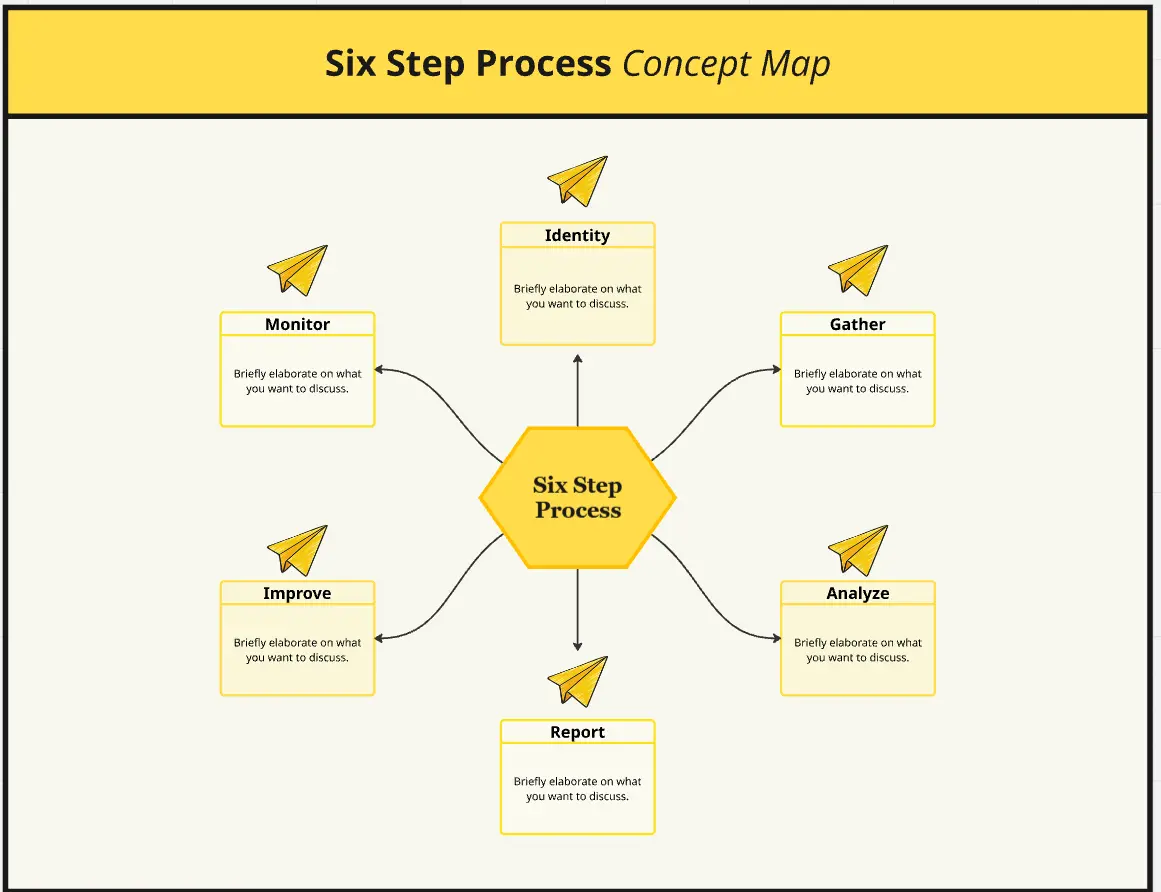
Brainstorming: A blank concept map template can be a fantastic springboard for generating new ideas. Start with a central topic and branch out with related concepts, allowing your thinking to flow freely.
Knowledge management: Concept mapping is a powerful way to organize and visualize information. It helps you see the big picture and understand how different pieces of knowledge fit together.
Problem-solving: When facing a complex problem, a concept chart template can help you break it down into smaller, more manageable parts. This makes it easier to identify the root causes and find effective solutions.
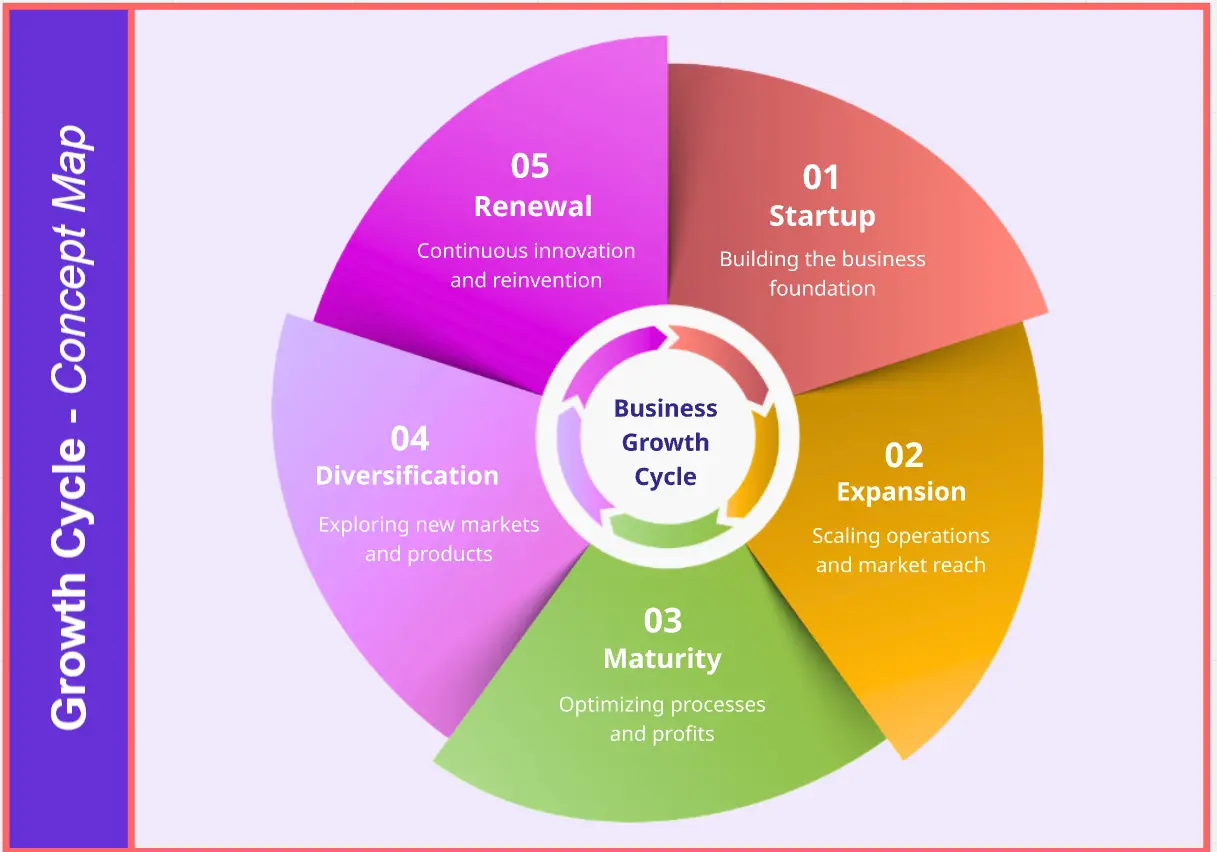
Project planning: Teams use concept maps to plan projects, define tasks, and track progress. It helps everyone stay on the same page and understand their roles.
Gaining insights: Concept mapping helps identify patterns, trends, and connections that might not be obvious otherwise. This can lead to valuable insights and better decision-making.
By using concept maps, teams clarify thinking and foster collaboration. They use concept map tools to visualize and organize complex ideas, making them ideal for knowledge mapping and idea visualization. Whether starting with a blank concept map template or using conceptual map templates, teams find these visual aids invaluable for creative thinking techniques. This helps them improve communication, gain insights, and plan projects more effectively. Concept maps help teams break down complex information, fostering a shared understanding and facilitating better decision-making.
Why you'll love our concept map templates
Using our concept map templates can significantly improve your project planning and idea generation processes. Here are some detailed benefits:
Enhanced visualization: Concept maps provide a clear visual representation of complex ideas, making it easier to understand and communicate relationships between different concepts.
Improved collaboration: Miro's editable concept map templates allow multiple team members to contribute and edit in real time, fostering a collaborative environment.
Time efficiency: Pre-designed templates save time by providing a structured starting point, allowing teams to focus on content rather than design.
Flexibility: The templates are fully customizable, enabling users to adjust them according to their specific project requirements.
Accessibility: Miro's platform is accessible from anywhere, making it easy for remote teams to work together seamlessly.
Free resources: Miro offers a free concept map template, allowing users to explore the benefits without any initial investment.
When to use the concept map template
From helping someone learn a new idea to plotting out customer journeys, concept maps are useful in all kinds of situations. Here are a few scenarios where Miro’s concept map template will come in handy:
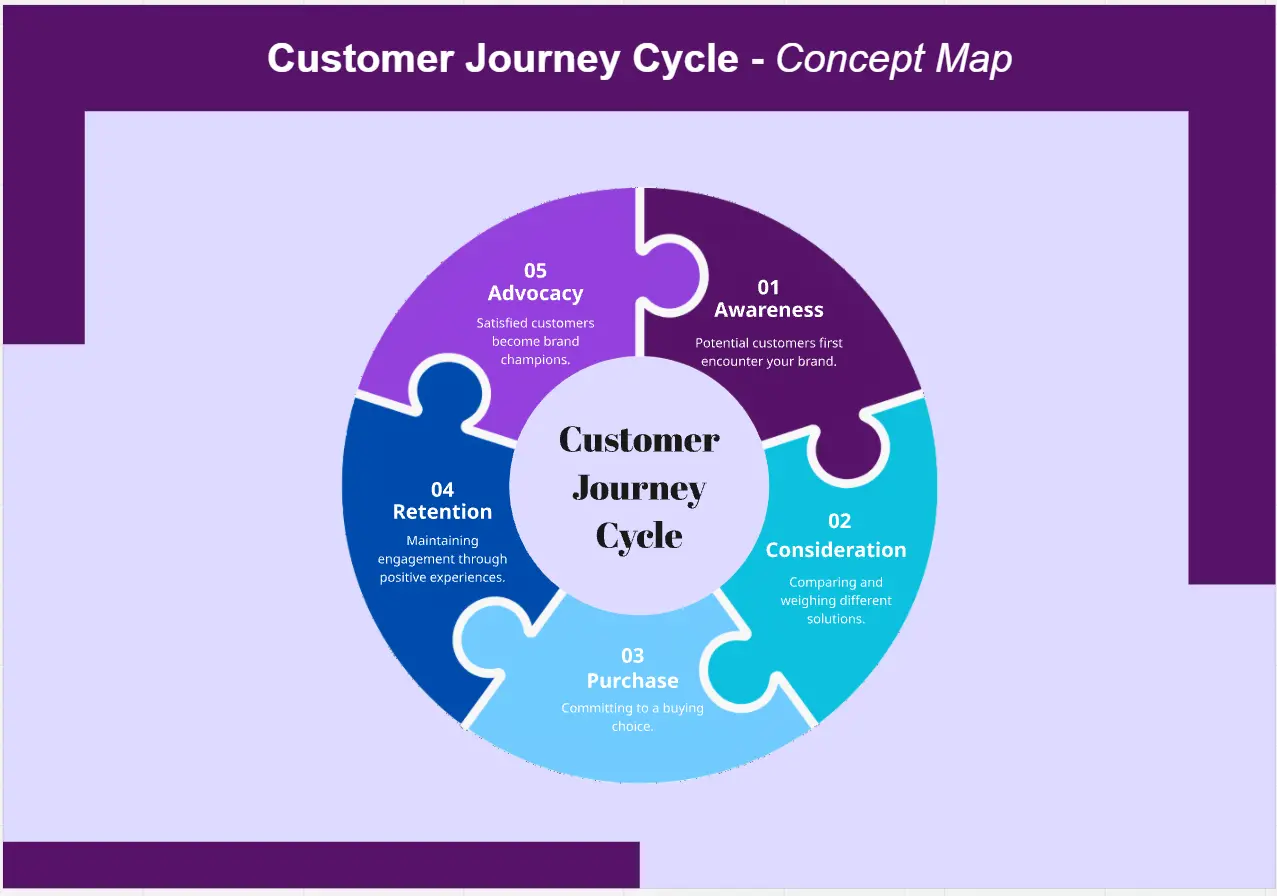
Mapping user flows and customer journeys
Businesses commonly use concept maps to walk through a product’s user flow or customer journey. With a clear visual breakdown, you’ll be able to think about a product from different angles, including how your customers see it. This makes it easier to identify any challenges your users might be facing and think about ways to improve their experience.
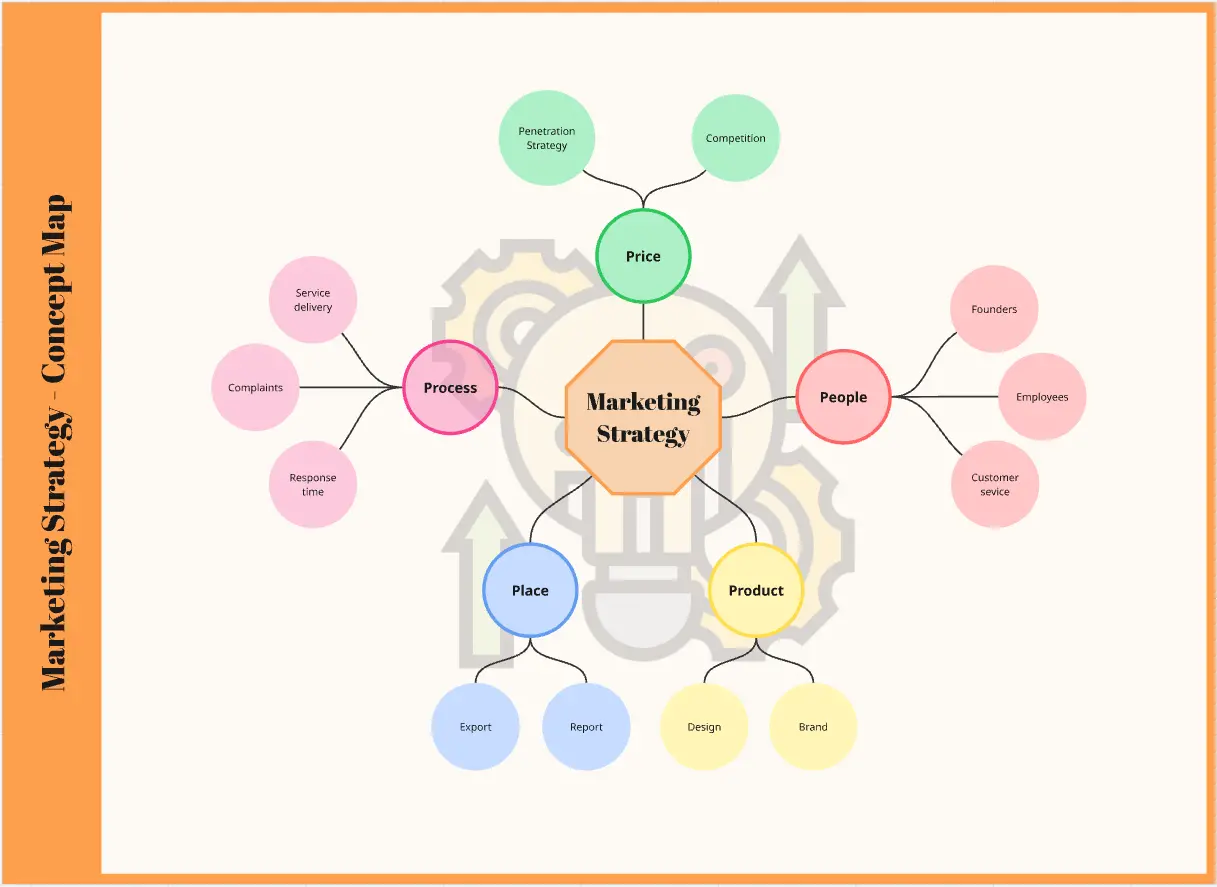
Running brainstorming sessions
Concept maps are excellent brainstorming tools — whether you’re planning a creative project or coming up with quarterly goals at work. By continuously breaking an idea down, you can use your concept map to explore all kinds of paths you could take, decisions you could make, or even different outcomes you might encounter — depending on what topic you’re brainstorming for.
Training and education
Creating training and education materials is probably one of the most common reasons to use a concept map, especially if you’re teaching or learning about a complex subject. Breaking things down visually provides a nice alternative to text-heavy learning materials, making complex subjects more accessible — especially if you’re a visual learner.
How to use the concept map templates in Miro
Using Miro's concept map templates is straightforward. Follow these steps to get started:
Select a template: Browse through Miro's collection of concept map templates and choose one that best fits your project needs.
Customize the template: Use Miro's intuitive editing tools to customize the template. Add, remove, or change nodes and connections to reflect your ideas accurately.
Collaborate with your team: Invite team members to join the board. They can add their input, make edits, and provide feedback in real time.
Organize information: Arrange the concepts logically, ensuring that the relationships between them are clear and easy to follow.
Review and refine: Regularly review the concept map with your team to ensure it remains aligned with your project goals. Make adjustments as necessary.
Share and present: Once the concept map is complete, share it with stakeholders or use it as a visual aid in presentations to communicate your ideas effectively.
By following these steps, you can use Miro's concept map templates to streamline your project planning and idea generation processes, ultimately helping your team to thrive.
Benefits of using Miro’s concept map template
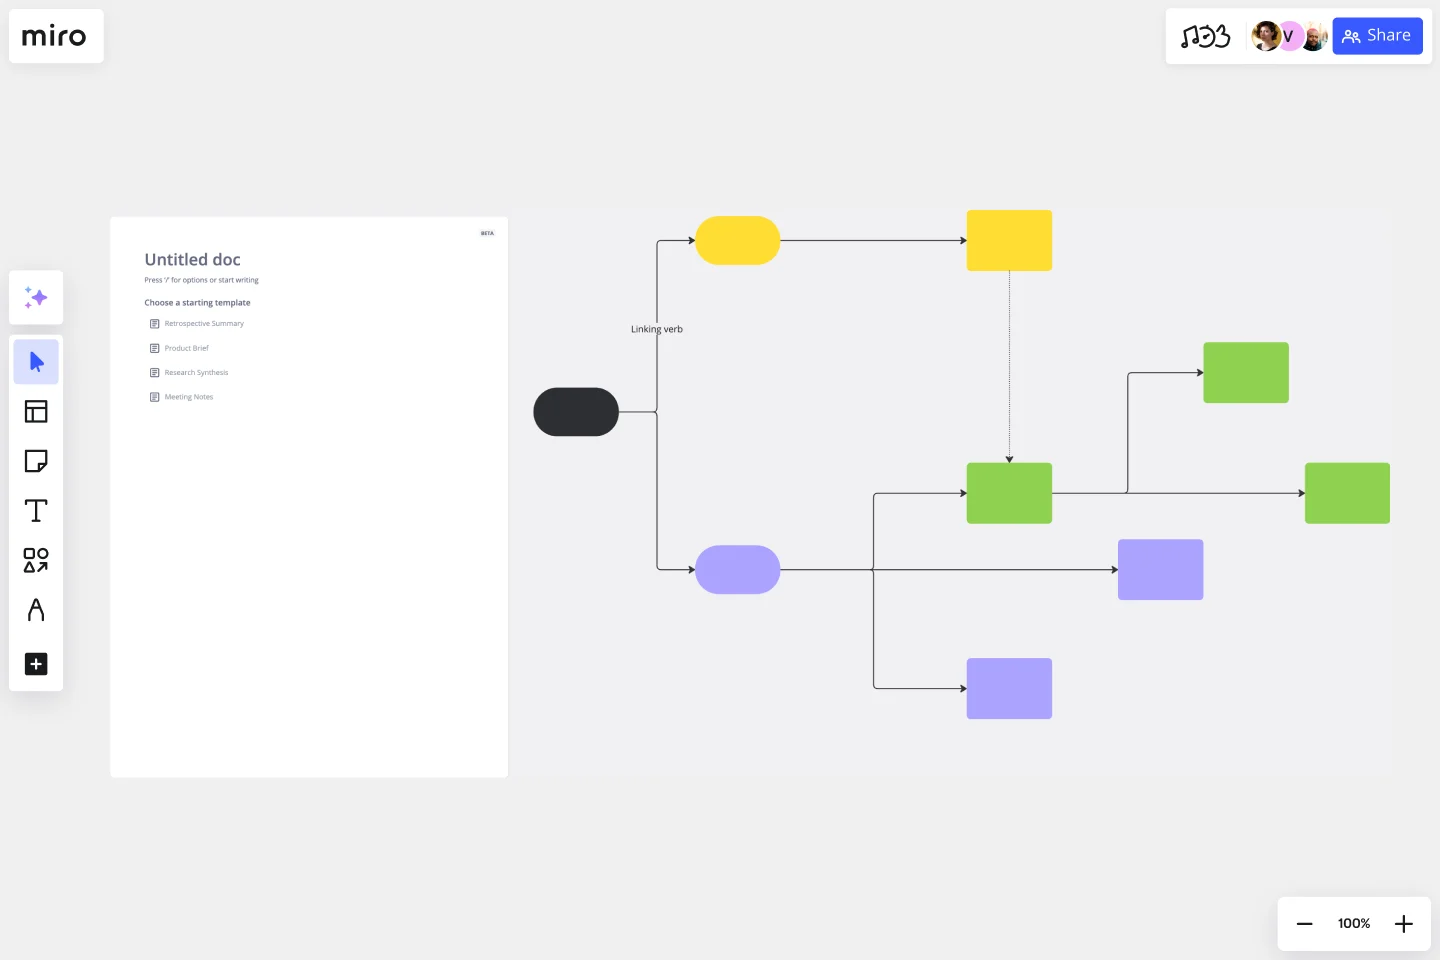
When you open Miro’s free concept map template, you also get access to our visual workspace — allowing you to customize the diagram to your liking, easily share your content, and even present your work.
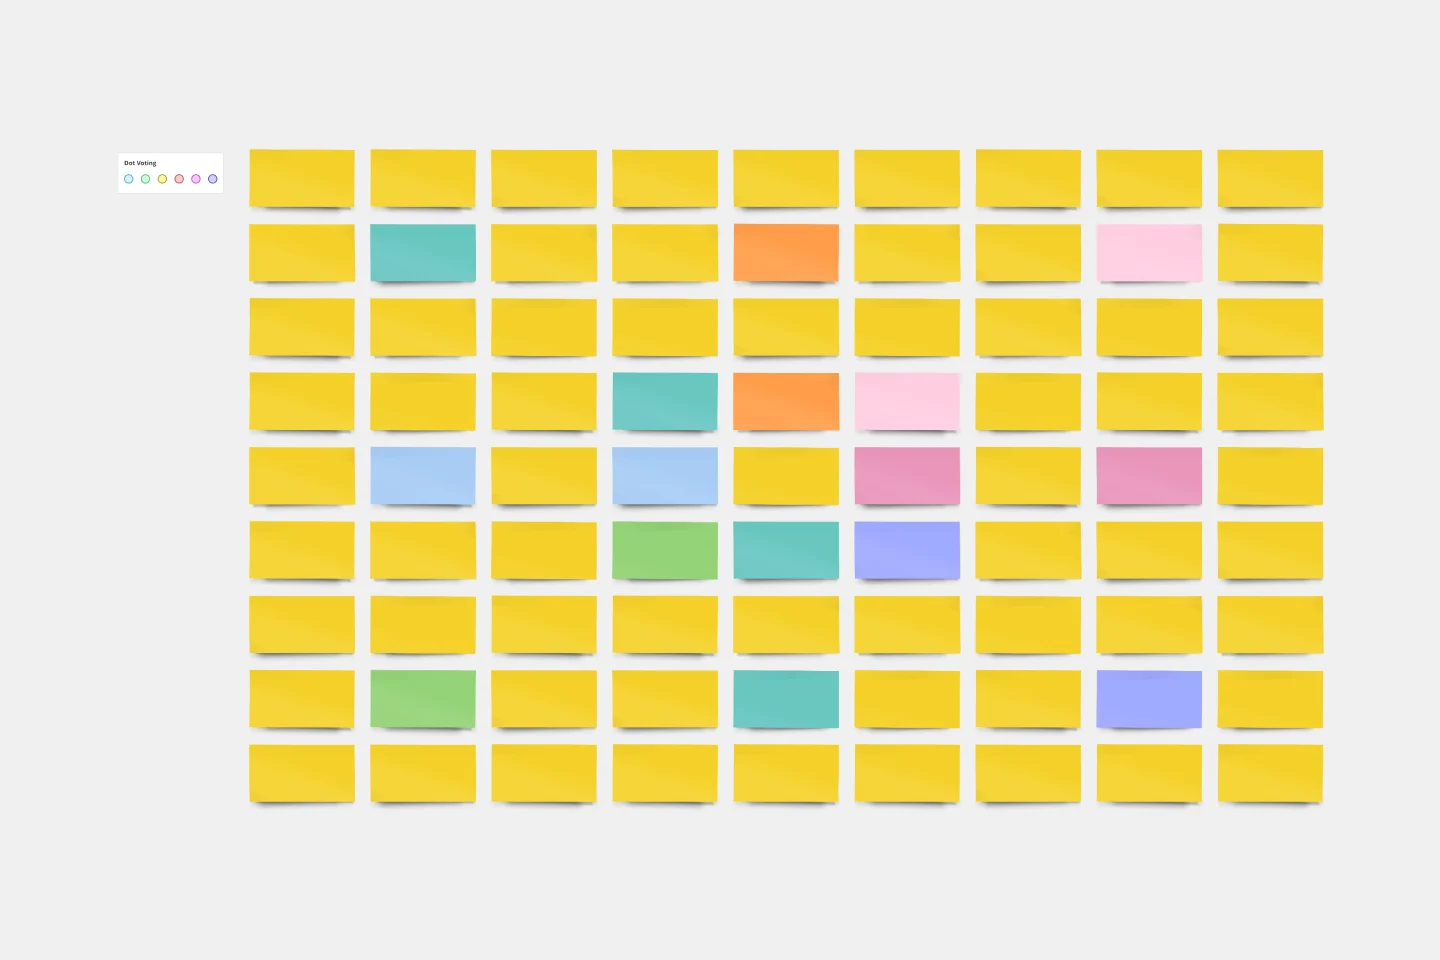
Change up the colors of your sticky notes, connection lines, text, and even your board’s background. Adjust the thickness and style of your lines, make sticky notes bigger or smaller, and change the size of your text. You can also swap out the sticky notes for cards to add more detail and give your ideas some context. In other words, you get to make the concept map template your own.
You already know multiple ways to share the concept map template, but did you know you can run presentations straight from your Miro board? Use Presentation Mode to host live sessions with interactive features to keep your audience engaged.
But if you’re not up for another meeting, use TalkTrack to record immersive audio and video walkthroughs to share with your team async — allowing everyone to dive into your concept map in their own time.