About the Outcome Mapping Template
Our Outcome Mapping Template allows you to easily visualize all the possible outcomes for your upcoming project. You can peer inside the black box to increase operational efficiency, reduce waste, and ensure success.
What is outcome mapping?
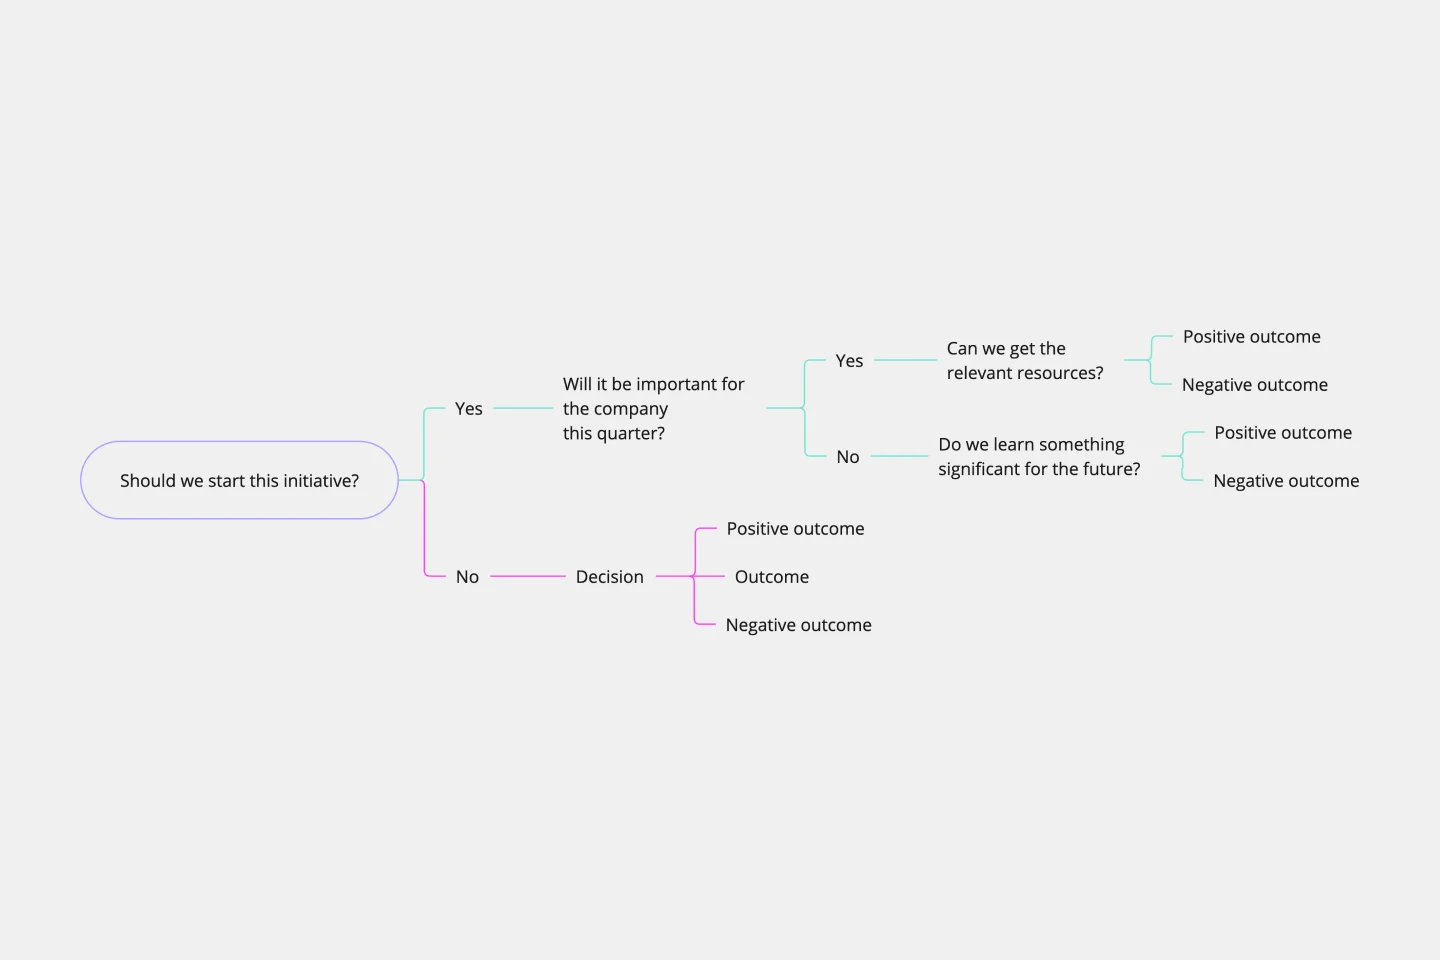
Outcome mapping is a method of planning and assessing projects to understand possible outcomes and anticipate change.
When you’re planning a complex project, it’s important to consider all possible outcomes. The beginning and end of a project are sometimes separated by a black box of process and evolution. If you can’t unpack the black box, you risk encountering unforeseen or unintended downstream effects.
This is where outcome mapping can help.
Whenever you undertake a project, you expect a certain level of uncertainty, but outcome mapping aims to reduce unknowns. Rather than reacting to changes and obstacles as they arise during a project, outcome mapping allows you to plan. The project team collaborates on a framework that encourages self-monitoring and assessment throughout your project.
In outcome mapping, outcomes are conceptualized as “behavioral changes.” Thinking in terms of changes rather than results encourages you to focus on how the change happens rather than treating each change as a forgone conclusion. Once you’ve identified how a behavior change came about, outcome mapping empowers you to adapt and plan accordingly.
When to use outcome mapping
Outcome mapping originated in the public policy space. People used the method to track outcomes resulting from a policy initiative, such as environmental, economic, political, or demographic changes. The method is meant to unpack the black box at the heart of development activities like social welfare programs.
But outcome mapping is applicable in other contexts, as well.
Outcome mapping is simply a suite of tools that help your team think about change. It allows you to gather information before embarking on a new project to ensure that you account for all potential outcomes. These principles can be applied to a variety of purposes.
Let’s look at some use cases to demonstrate:
To pinpoint your target audience. Use outcome mapping to carefully articulate the audience you intend to target throughout the project. You might have more than one buyer persona you wish to target, and using the outcome map will help you visualize your plan of action for each audience.
To identify potential challenges. Use outcome mapping to predict the challenges you might face and changes you might see as the project progresses. This will help you identify potential hurdles and figure out how to overcome them ahead of time.
To monitor internal processes. As we’ve already mentioned, the outcome mapping process allows you to dig deeper into your processes. You’ll see all the steps that happen between your inputs and outputs so you can make sure that your projects are running as smoothly and efficiently as possible.
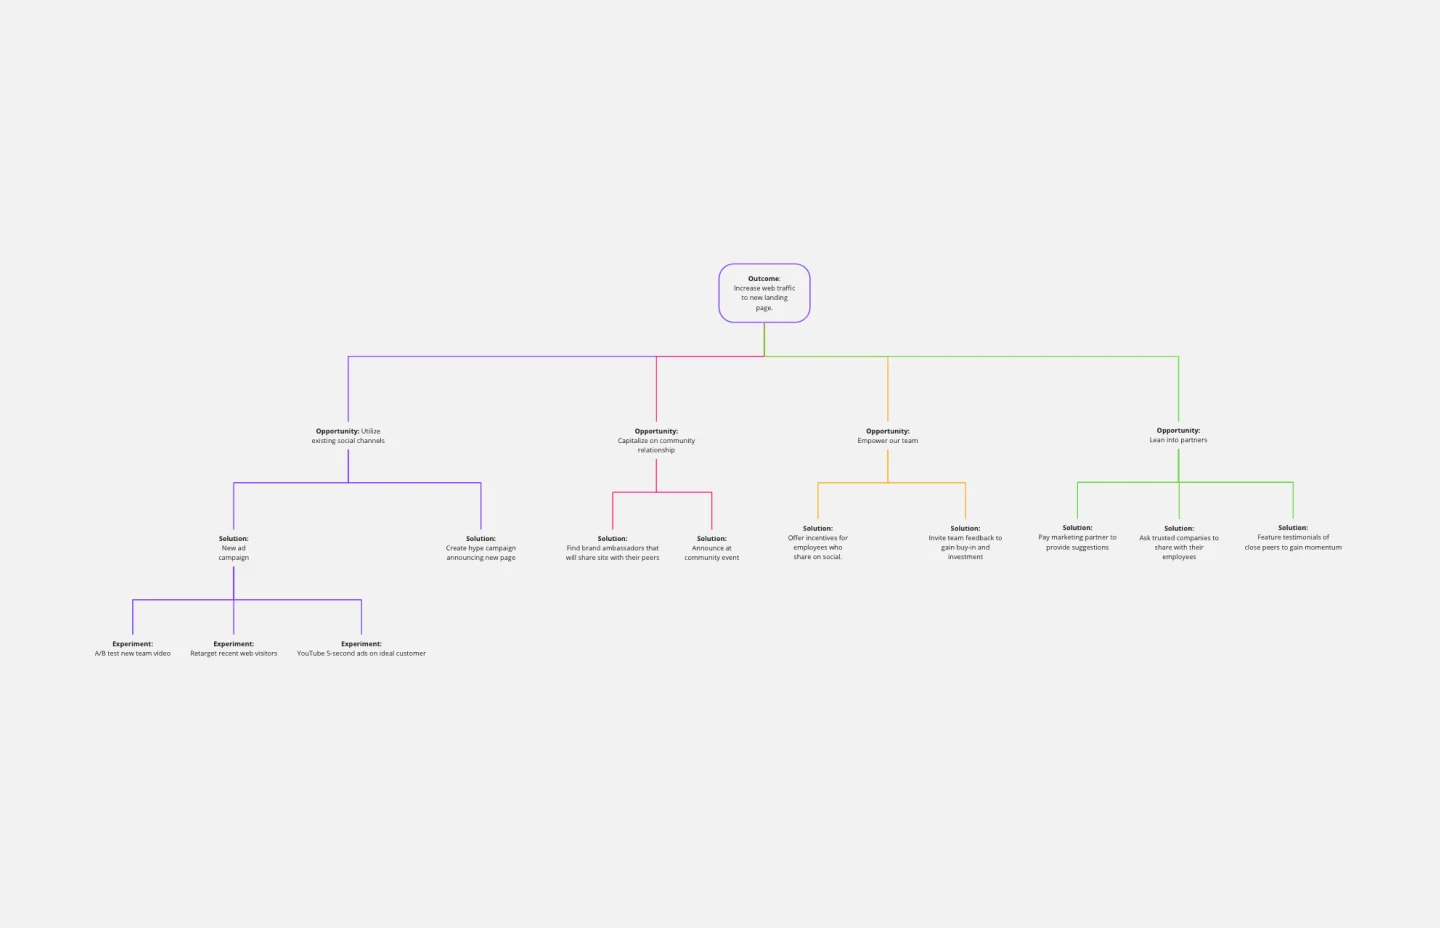
To reach your goal. Use outcome mapping to identify the evolving strategies you’ll use to achieve your desired outcome. In other words, you’ll be able to see the best path forward to help you reach your goal.
To track project progress. Check that your projects are on track to reach their goal. Because outcome maps outline every step of your process, you can use this to see how your project is performing in real-time.
Why use outcome mapping?
Now that we’ve covered some examples of when to use outcome mapping, let’s outline some of the benefits of using this process.
To think strategically. Outcome mapping forces you to think strategically about your decisions. It allows you to think systematically and practically about what you’re doing throughout the project and why you’re doing it.
To deal with challenges. When you’re creating an outcome map, you’ll be looking at how certain challenges and hurdles might crop up. By doing this, you’re proactively thinking about how to manage variations in your strategy. If these challenges crop up, you’ll be well equipped to handle them and make sure that you still reach your desired outcome.
To monitor progress. Outcome mapping introduces ongoing monitoring and evaluation during the early stages of a project. As a result, you’ll have a good understanding of how to track success before the project or process has even begun.
To involve stakeholders. Part of the mapping process involves learning about the influence and progression of change among boundary partners (otherwise known as direct partners such as stakeholders) as part of a project or program. This helps you understand how each stakeholder relates to your project and encourages multi-stakeholder dialogue.
To offer flexibility. All outcome mapping approaches are flexible when it comes to managing change. They’re not linear, so project managers can effectively manage change as and when it happens.
Create an outcome map with Miro
Making an outcome map is easy with Miro. It’s the perfect canvas to create and share your outcome maps with your entire team. Get started by selecting the Outcome Mapping Template, then take the following steps to make one of your own.
1. Do some prework. The initial stage of outcome mapping is often called the intentional design stage. It aims to answer four questions: First, what is the vision of this project? Second, who are your primary stakeholders? Third, what tangible goals do you hope to achieve? Fourth, how will you reach those goals? Answer all of these questions to start your outcome mapping off on the right foot.
2. Provide a framework for monitoring. In the outcome and performance monitoring stage, think about how to monitor your progress toward your intended outcomes. For example, how you’ll track your progress against pre-established markers, such as project milestones.
This will allow you to test and adapt your strategy map to changing circumstances and log organizational practices and procedures as they evolve. You should also build self-assessment into your project so you can reflect on the successes of your processes.
3. Develop an evaluation plan. Finally, in the evaluation planning stage, develop the priorities you’ll use to test your processes in depth throughout the project. When you’re in the middle of a project, you won’t always have the time or resources to test everything as thoroughly as you’d like. That’s why it’s important to prioritize before you get started.
4. Circulate your plan. Share your outcome map with all key stakeholders to make sure everyone is aligned before circulating the plan outside your team. Using Miro makes it easy to share your outcome mapping with colleagues and stakeholders (both internally and externally). You can work together remotely to streamline your collaboration and finalize your outcome map.
What do you mean by outcome mapping?
Outcome mapping is a methodology for planning projects. It allows teams to assess their options and figure out the best way to achieve their ultimate goal. In essence, the process involves mapping out each step involved in a project or process. There can be multiple processes within the same map. The aim is to identify which processes will help you reach your goal and anticipate any challenges that might arise.