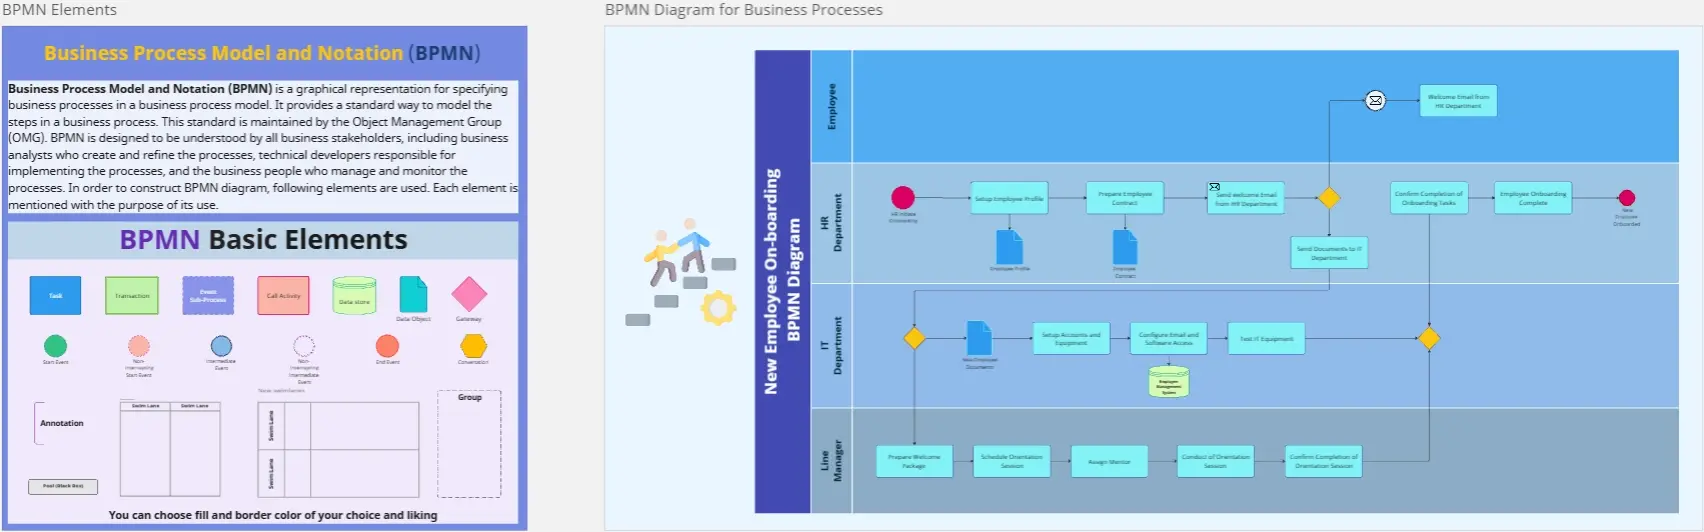
What is the BPMN Template?
A BPMN template is a standardized graphical representation used to specify business processes in a business process model. Unlike a basic flowchart, BPMN uses a specific set of symbols (Events, Activities, Gateways, and Flows) that can be read by both business analysts and technical developers. It allows organizations to visualize complex internal procedures, ensuring that every handoff and decision point is documented with mathematical clarity.
Key Components of a BPMN Template
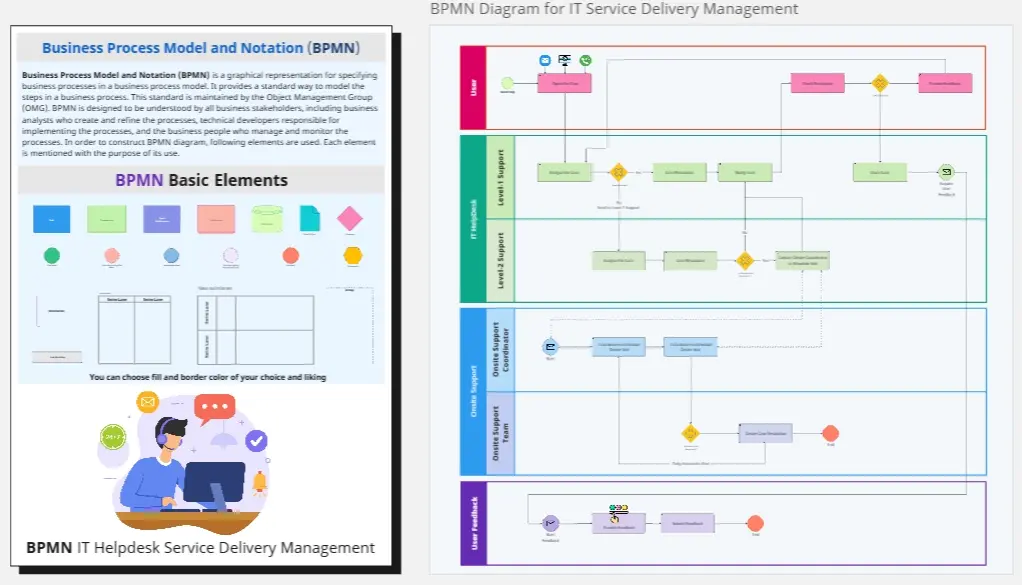
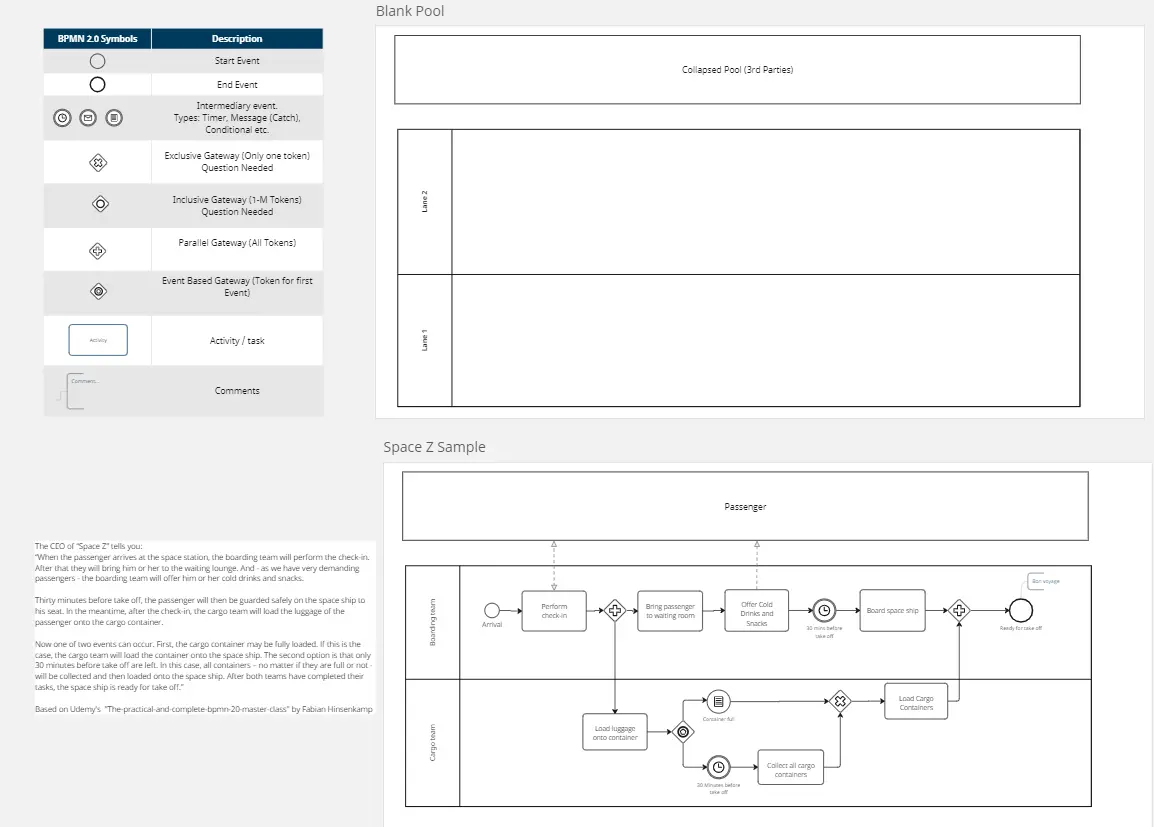
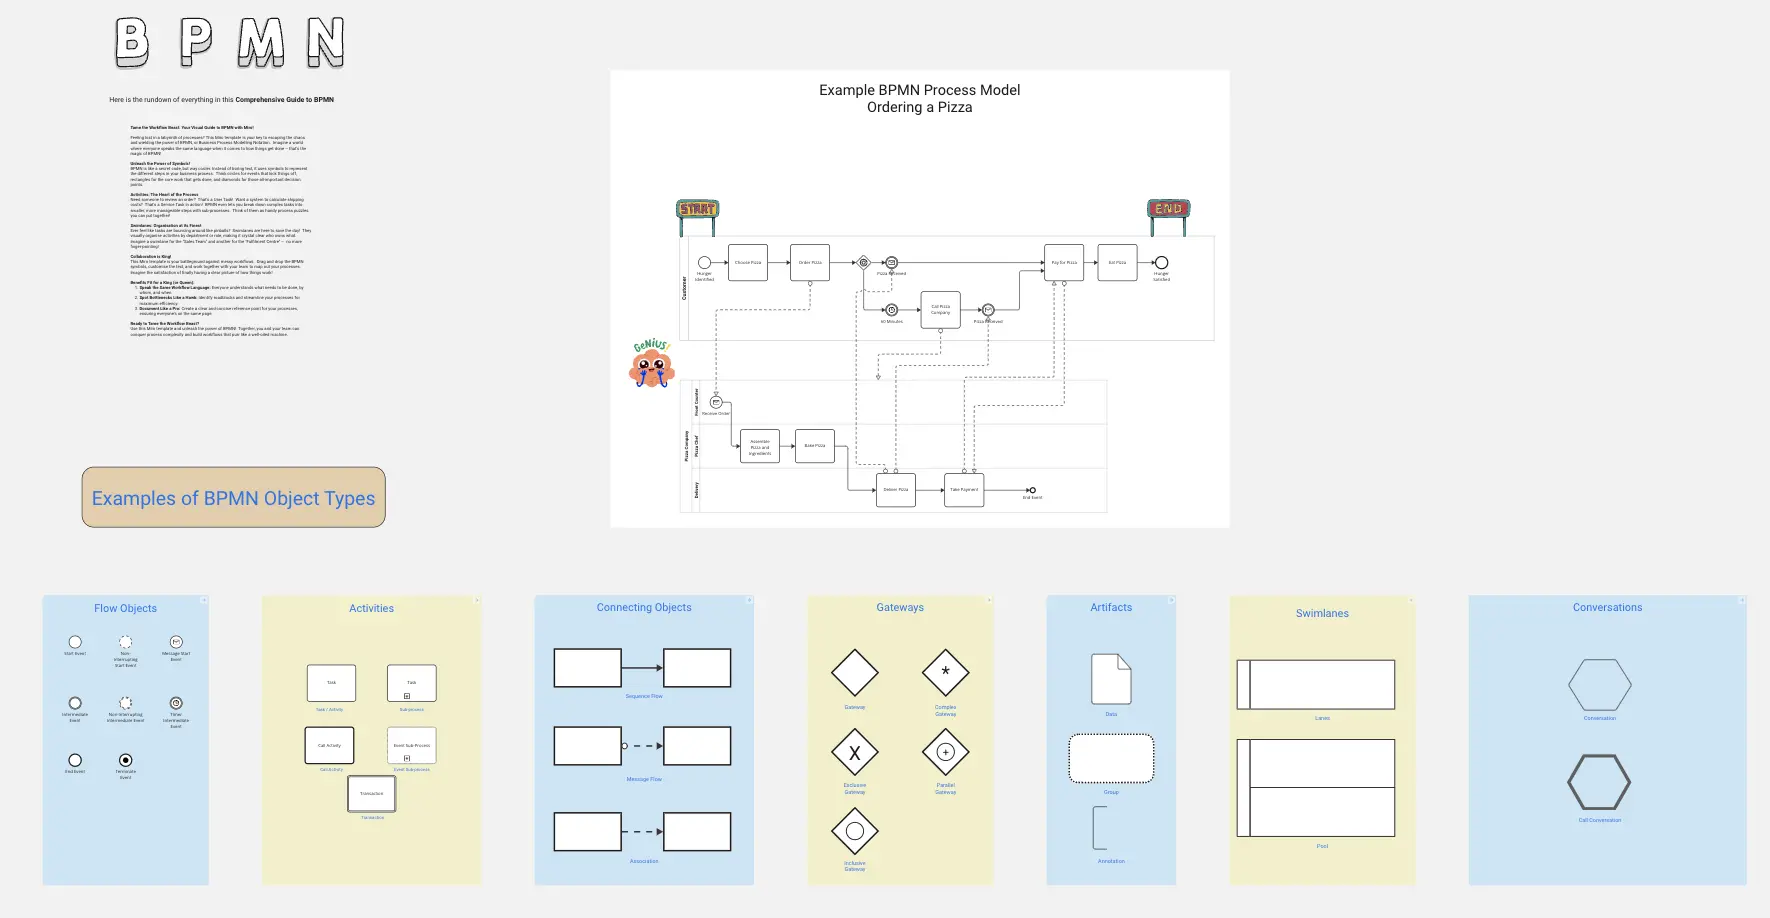
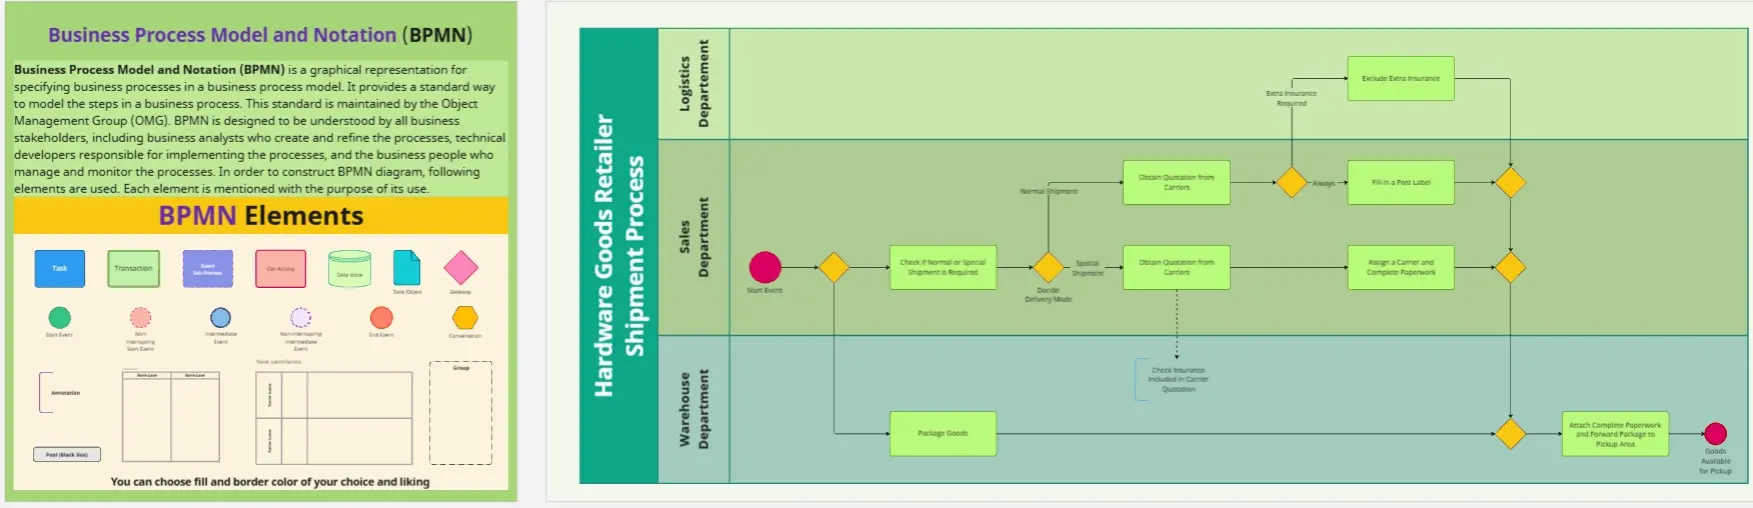
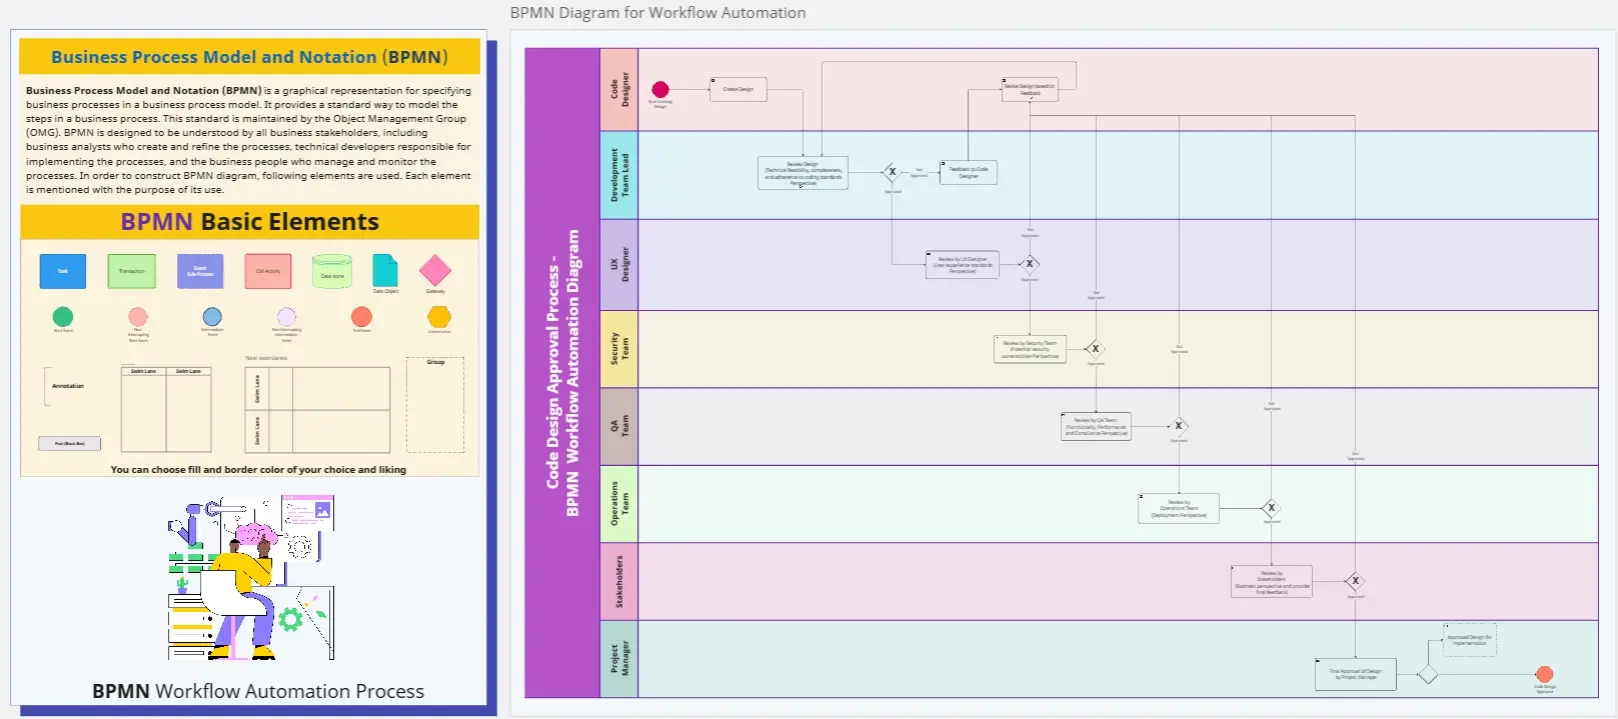
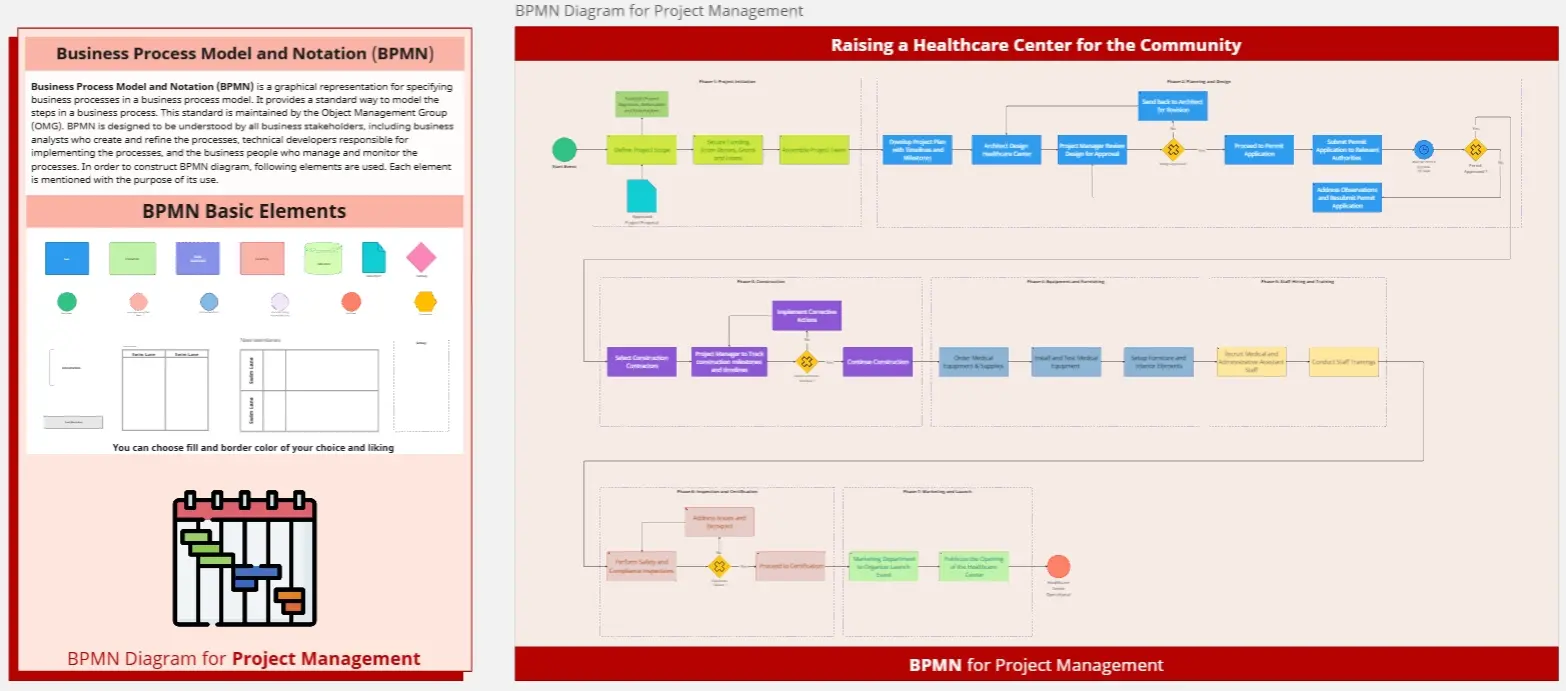
A professional BPMN template is built from four basic element categories:
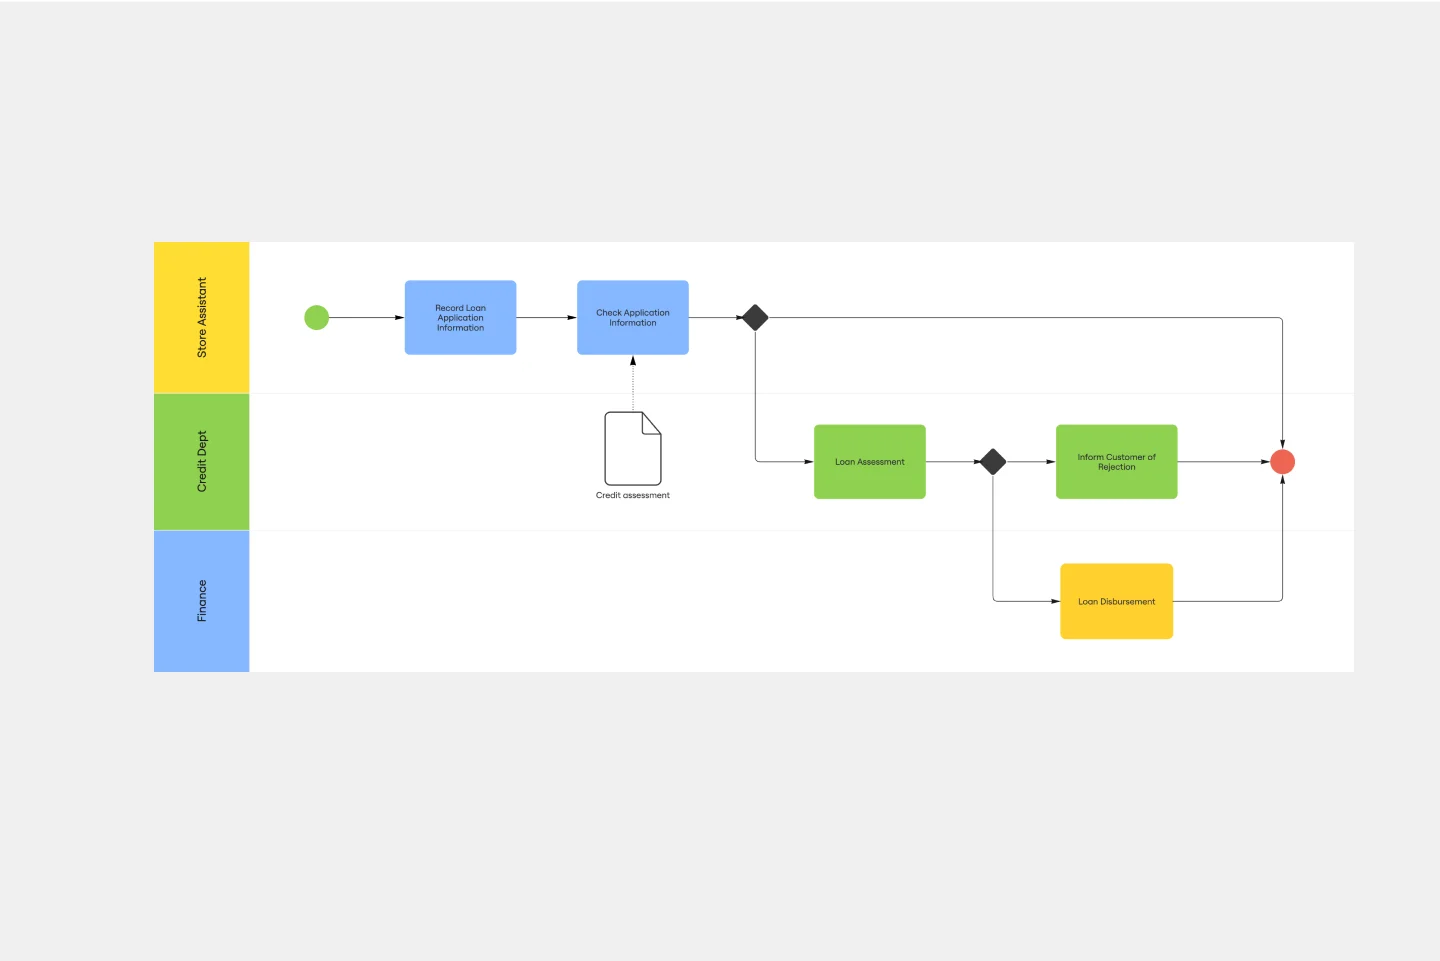
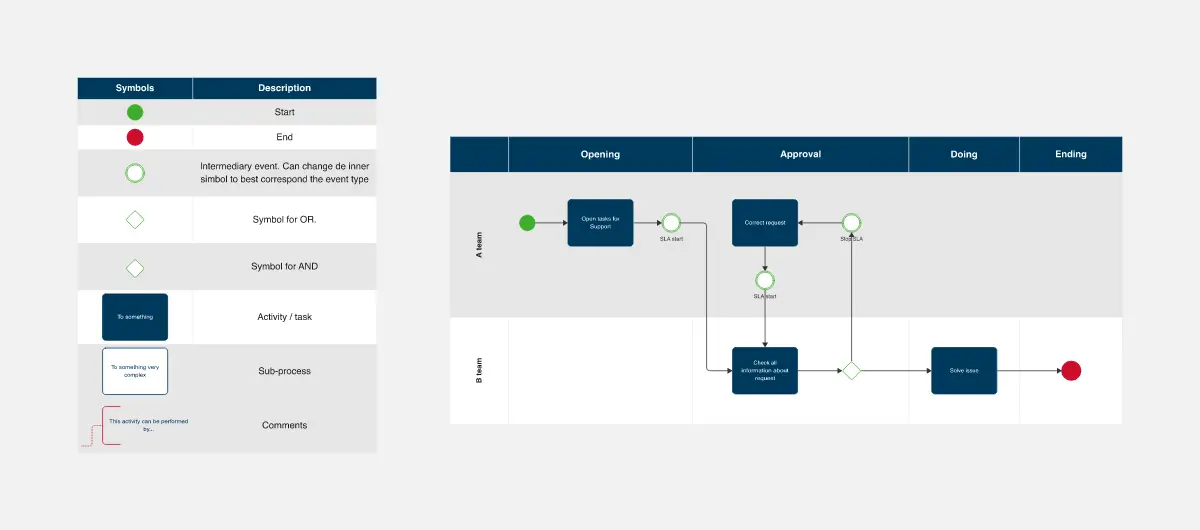
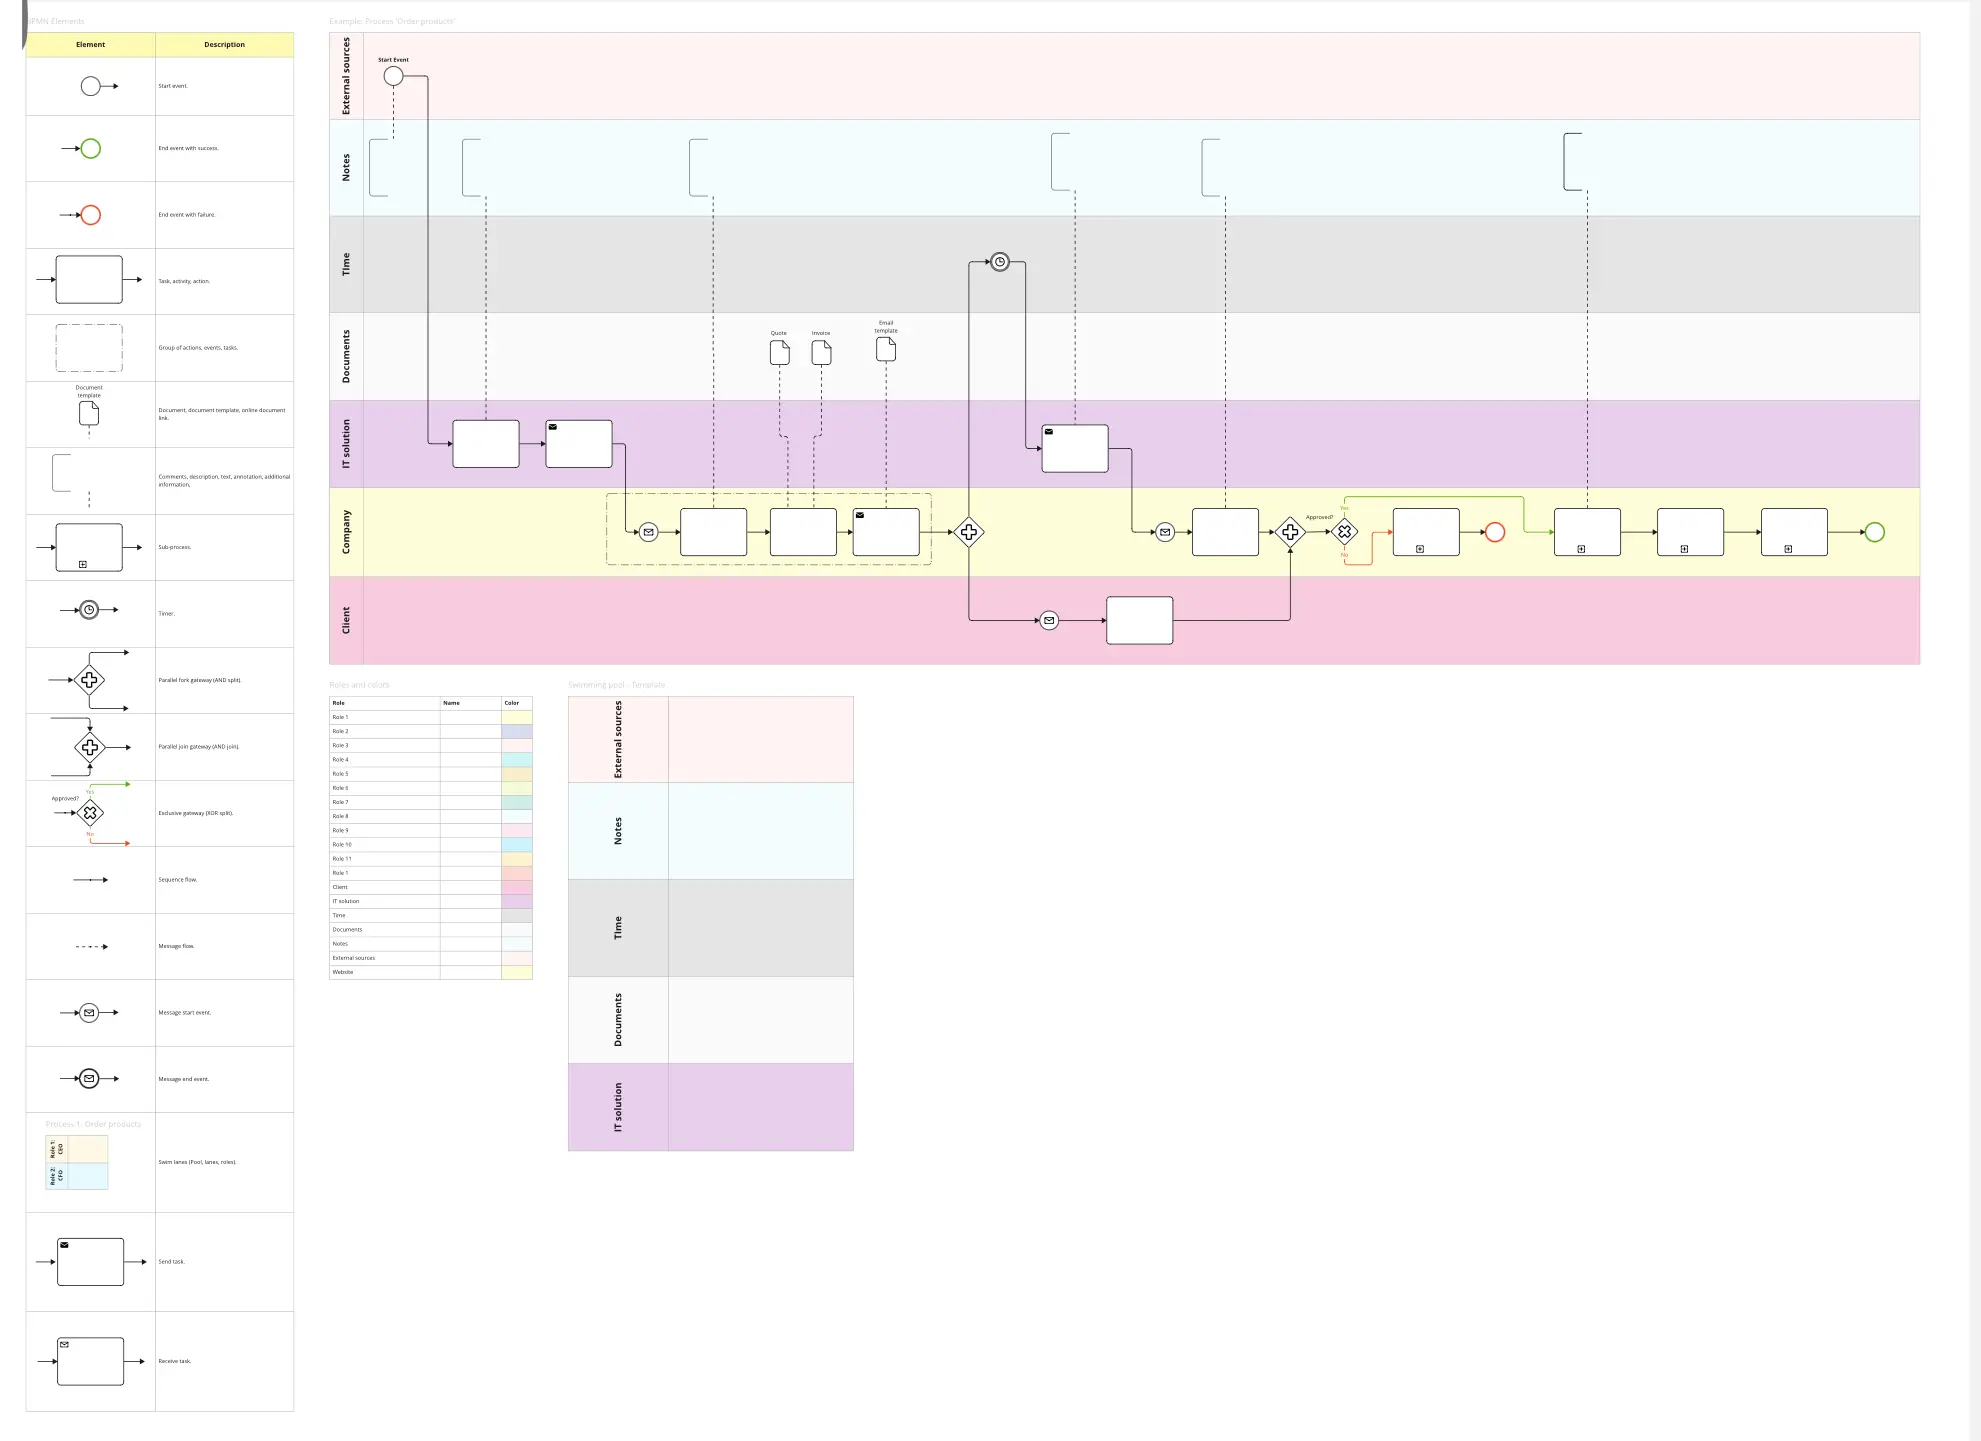
Flow Objects: The core elements: Events (circles), Activities (rectangles), and Gateways (diamonds).
Connecting Objects: Sequence Flows (solid), Message Flows (dashed), and Associations (dotted).
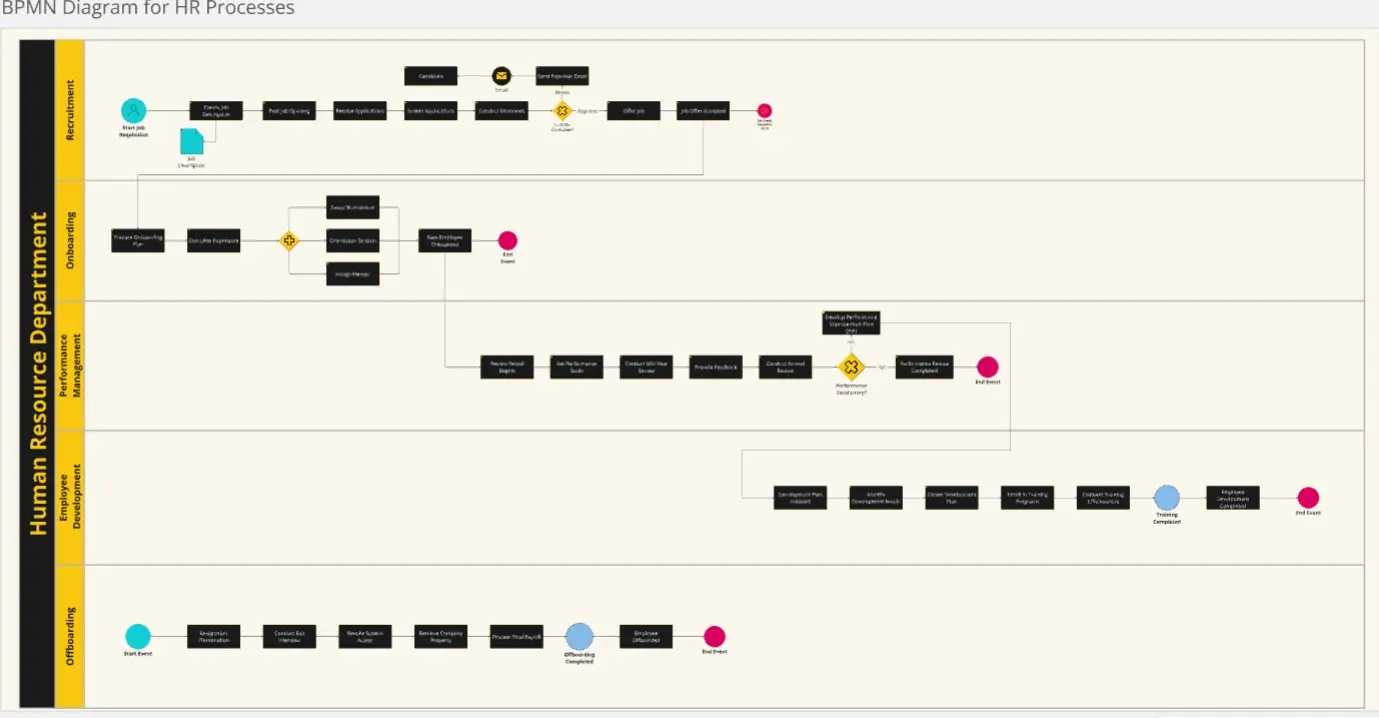
Swimlanes: Pools and Lanes used to organize the responsibility of tasks.
Artifacts: Data Objects and Groups that provide additional context without affecting the flow of the process.
Which BPMN Template Do You Need?
Select the Miro template that matches the level of detail required for your audience:
The Descriptive Model (Level 1):
The Analytical Model (Level 2):
Best For: Business Analysts and Process Improvement teams.
The Goal: To include all exceptions, error events, and compensation paths (what happens if the credit card is declined?).
The Executable Model (Level 3):
3 Ways to Ensure Technical Accuracy
A BPMN diagram is only functional if it follows the rules of the "Token." Before finalizing your Miro board, apply these three expert "health checks":
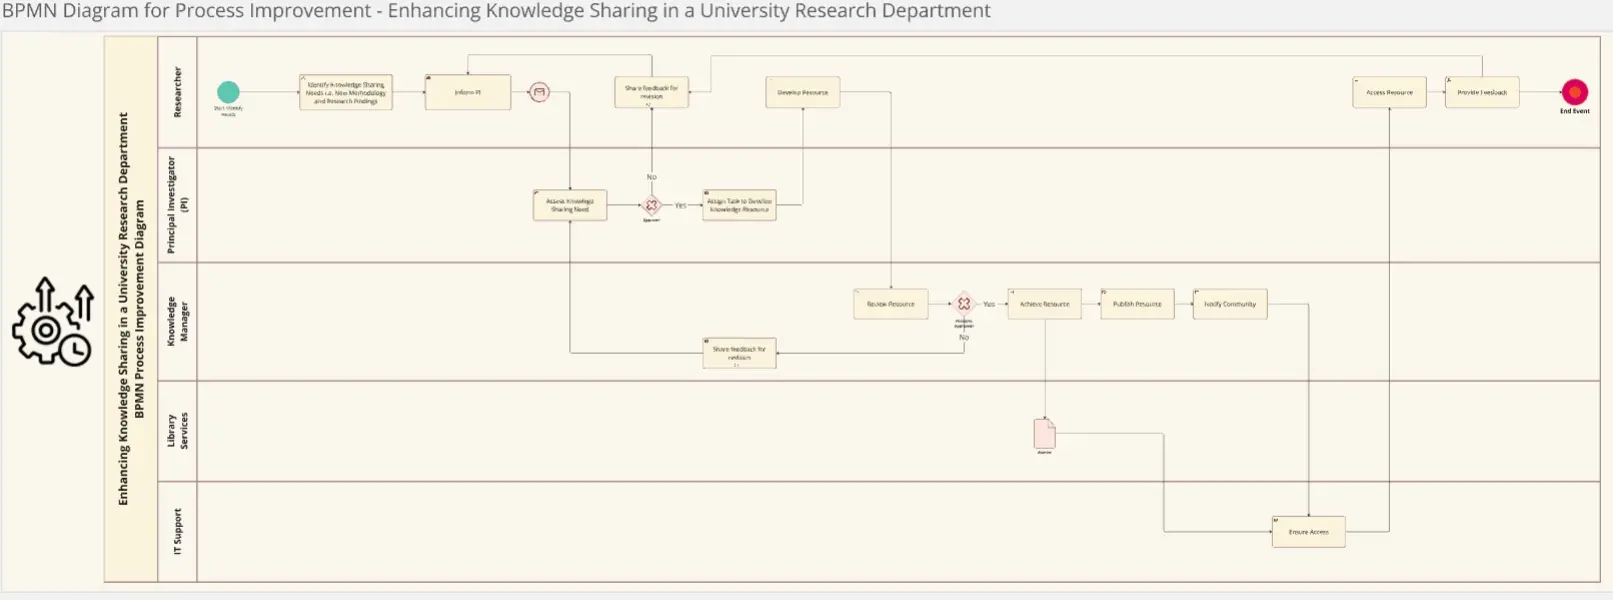
1. The "Token Flow" Audit
The Audit: Can a single "Token" (the unit of work) travel from the Start Event to an End Event without getting stuck?
The Fix: Audit your Connectivity. Every path must lead somewhere. If you have a task with an incoming arrow but no outgoing arrow, the "Token" dies, and the process fails. Use your template to trace the path of a single request from "Trigger" to "Resolution" to ensure there are no logical dead ends.
2. The "Gateway" Integrity Test
The Audit: Are you using a generic diamond for every decision?
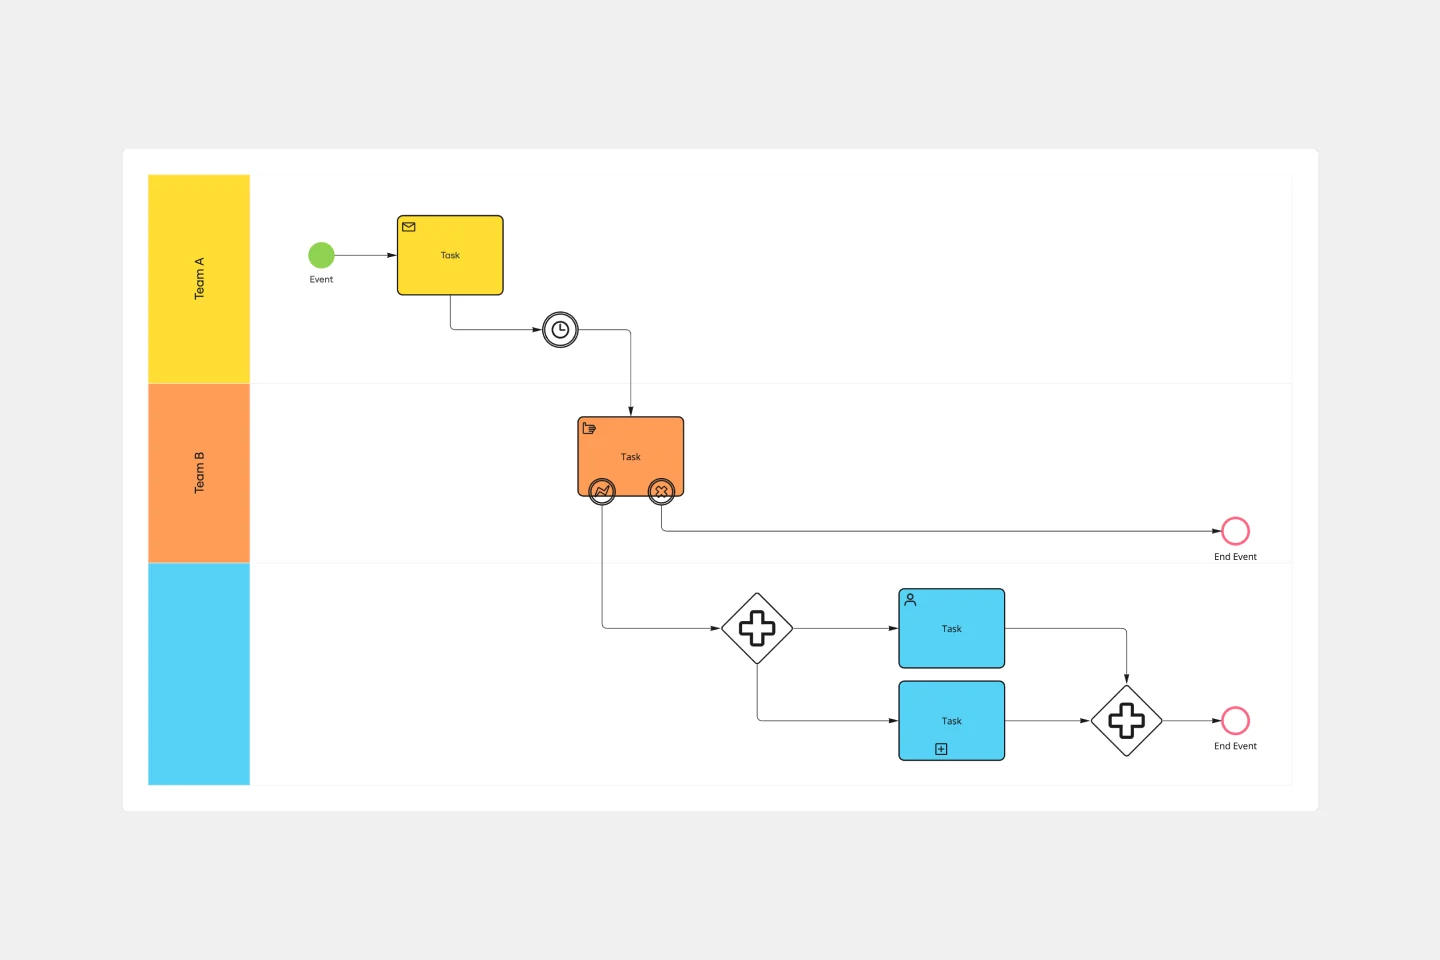
The Fix: Audit your Gateways. BPMN requires specific symbols for different logic:
Exclusive (X): Only one path can be taken.
Parallel (+): All paths happen simultaneously.
Inclusive (O): One or more paths can be taken. Using the wrong symbol changes the fundamental behavior of the process. If two tasks must happen at once, a "Parallel Gateway" is mandatory to avoid "Sequence Error."
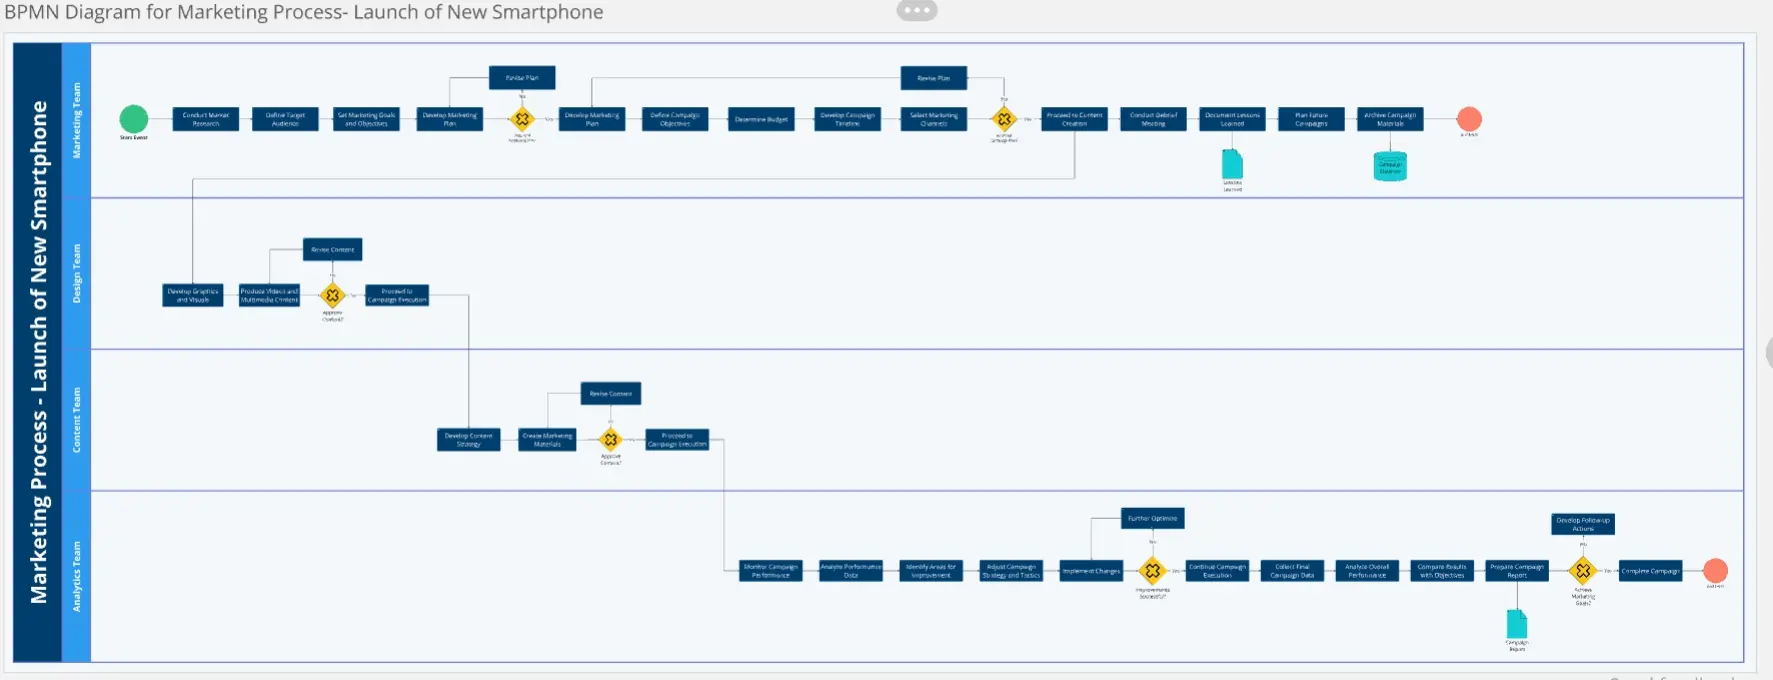
3. The "Pools vs. Lanes" Audit
The Audit: Are you using Lanes to represent separate companies?
The Fix: Audit your Boundaries.
Pools: Represent independent entities (e.g., Your Company vs. The Customer). Communication between pools happens via Message Flows (dashed lines).
Lanes: Represent roles or departments within the same company (e.g., Sales vs. Finance). Communication between lanes happens via Sequence Flows (solid lines). Confusing these two is the most common reason BPMN diagrams fail a technical audit.
Building your BPMN diagrams with Miro
Here's how to create your BPMN diagram template with Miro:
Select the right template: Browse our collection and choose a template that aligns with your business process requirements.
Customize it: Tailor the template to capture the unique aspects of your workflow. Define activities, events, gateways, and participants.
Engage your team: Invite your team to collaborate. Miro enables inclusive teamwork, allowing every voice to be heard and valued.
Draft and adapt: Use our automated diagramming features to outline your process. Easily adjust activities and connections with drag-and-drop functionality as your workflow evolves.
Incorporate feedback: Encourage an open dialogue. Refine your diagram by integrating input from your team.
Track progress: Review your diagram regularly to monitor the development of your process. Update as necessary to stay on track and maintain efficiency.
Share updates: Keep stakeholders informed about progress and changes using the diagram as a powerful communication tool.
By following these steps, you'll harness the full potential of Miro's BPMN diagram templates, ensuring your team remains coordinated, and your business processes are clearly defined and efficiently managed.