484 likes
2.6K uses
Miro's use case diagram templates help you visualize system interactions and define requirements effortlessly. Whether you're planning, designing, or analyzing, these templates provide a clear structure to map user actions, identify relationships, and streamline development.
5 templates
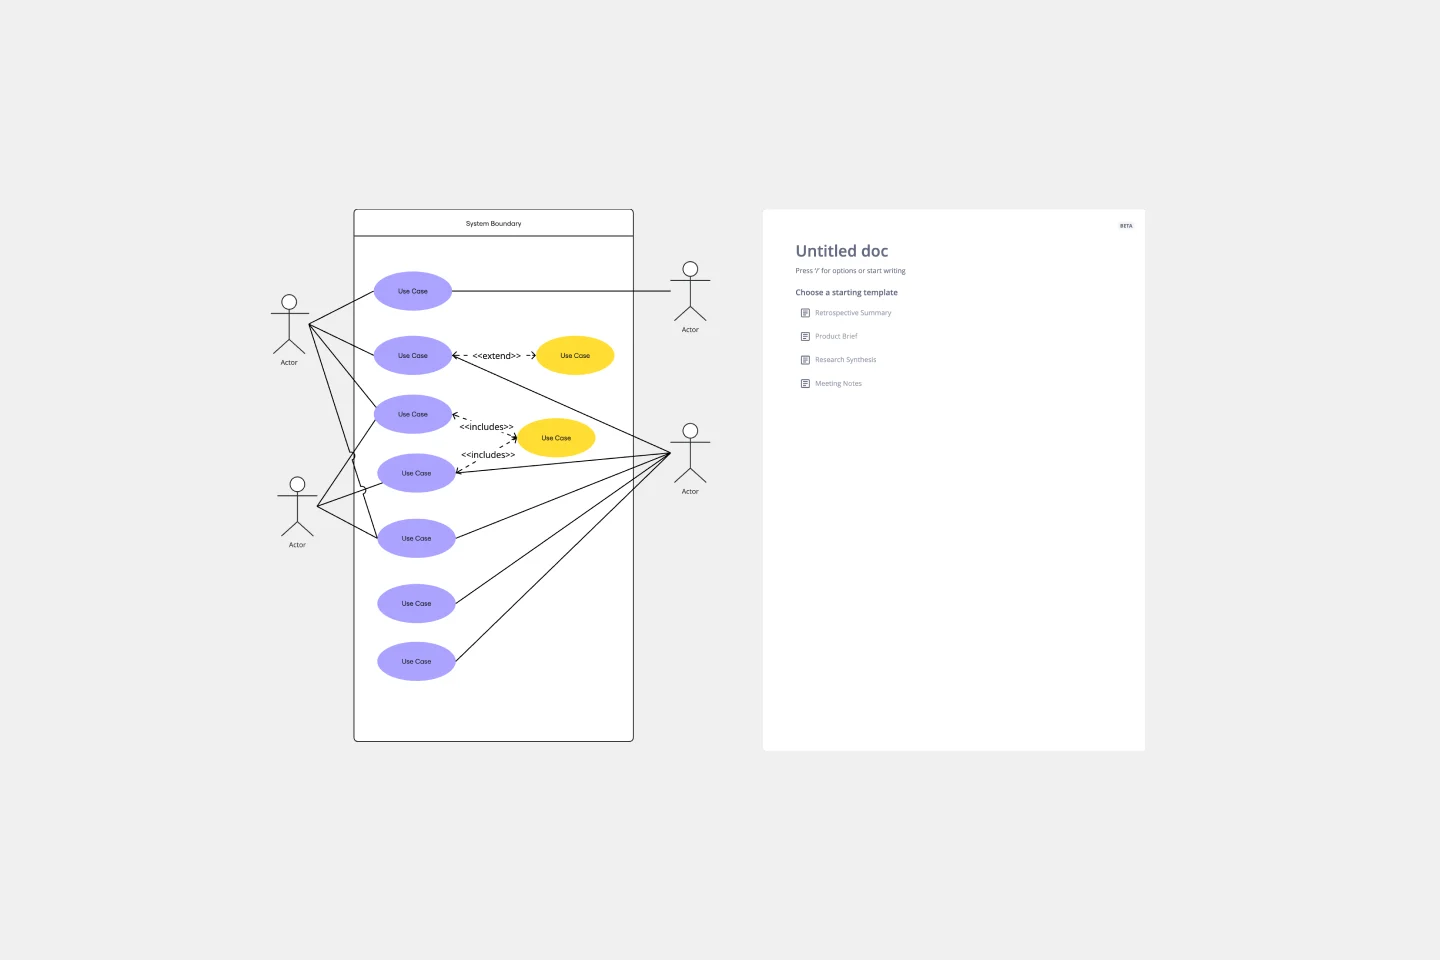
Use Case Diagram Template
A use case diagram is a visual tool that helps you analyze the relationships between personas and use cases. Use case diagrams typically depict the expected behavior of the system: what will happen and when. A use case diagram is helpful because it allows you to design a system from the perspective of the end user. It’s a valuable tool for communicating your desired system behavior in the language of the user, by specifying all externally visible system behavior.
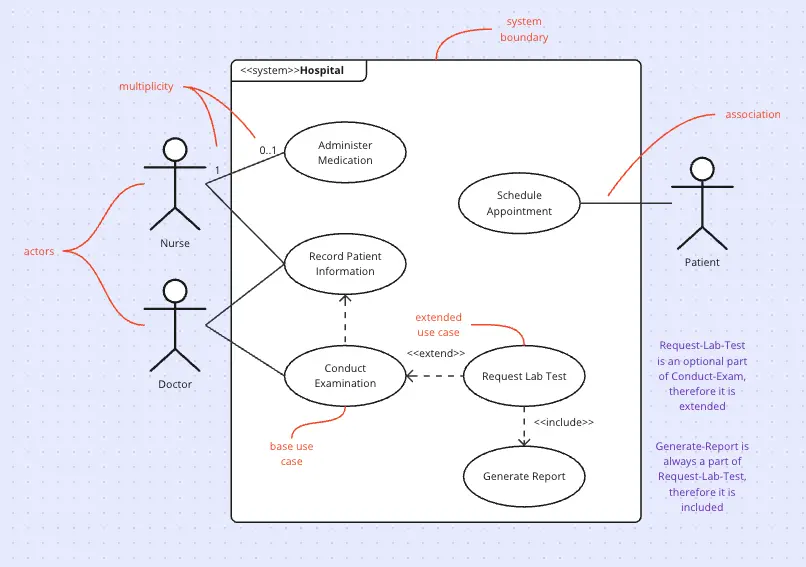
UML Use Case Diagram
Visualize system interactions with the UML Use Case Diagram. This template helps you map out user interactions and system processes, providing a clear overview of functional requirements. Ideal for software developers, business analysts, and project managers, it supports planning and communicating system functionalities. Use it to ensure all user scenarios are considered and to facilitate better design and implementation of software systems.
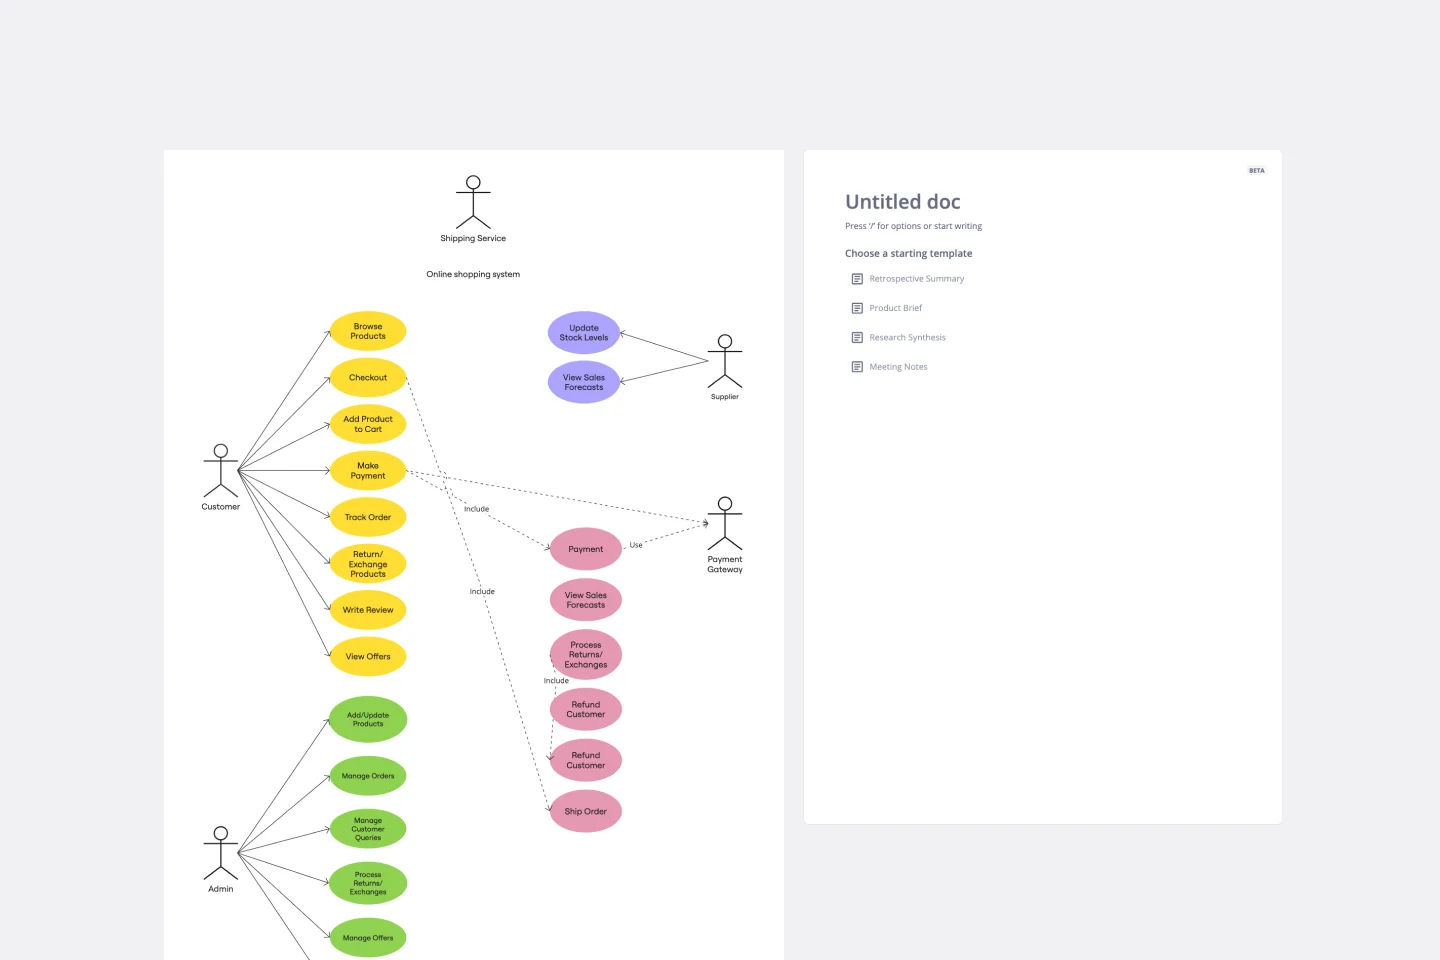
UML Use Case Online Shopping System Template
The Online Shopping System Template simplifies the process of documenting and visualizing how users interact with an online shopping system. It provides a standard way to map out user interactions, such as product listings, inventory management, shopping carts, order processing, payments, and shipping details. By using this template, teams can collaborate effectively in real-time or at different times, adjusting the diagram to meet their project's specific needs. This not only improves clarity and efficiency but also fosters better communication among team members and stakeholders, ensuring a thorough understanding of the system's design and requirements.
Use case diagram templates are essential tools for visualizing the interactions between users and systems. These templates help teams map out the functional requirements of a system, making it easier to understand and communicate complex processes. Our collection of use case diagram templates is designed to simplify this process, providing a range of customizable options that cater to different project needs. Whether you're working on software development, business analysis, or process improvement, these templates can help you create clear and effective diagrams.
Use case diagrams help teams with system modeling, particularly for visualizing the functional requirements of a system. They capture the dynamic aspects of a system, showing the interaction between users (actors) and the system itself. Here are some scenarios where use case diagrams are handy:
Requirements analysis: During the initial stages of software development, system use case templates help gather and define the functional requirements of the system. They provide a clear picture of what the system should do from the user's perspective.
System architecture design: Software use case diagrams help in outlining the system architecture by identifying the main functionalities and how users will interact with them. This is crucial for designing a robust software architecture.
Business process modeling: Use case diagrams for business processes help in identifying and streamlining workflows. They are beneficial for the visual communication of complex business processes.
Collaborative design: Use case design templates are excellent for collaborative environments where multiple stakeholders need to understand and contribute to the system design. They facilitate discussions and ensure everyone is on the same page.
Documentation: Use case diagrams serve as a part of the use case document, providing a visual representation that complements textual descriptions. This makes the documentation more comprehensive and easier to understand.
Designing use case diagrams can be straightforward, but there are common pitfalls that can undermine their effectiveness. Here are some mistakes to avoid:
Overcomplicating the use case diagram: Including too many details can make the diagram cluttered and difficult to understand. Focus on high-level interactions and avoid unnecessary complexity.
Ignoring user perspective: The primary purpose of use case diagrams is to represent the system from the user's perspective. Ensure that the actors and their interactions with the system are clearly defined, mapping out the interaction flow entirely.
Lack of consistency: Inconsistent naming conventions and diagram styles can confuse stakeholders. Maintain consistency in naming actors, use cases, and other elements.
Missing relationships: Failing to show relationships between use cases and actors can lead to incomplete diagrams. Ensure that all relevant interactions are captured.
Neglecting non-functional requirements: While use case diagrams focus on functional requirements, it's important to consider non-functional requirements (like performance and security) in the overall system design.
By avoiding these common mistakes, you can create effective use case diagrams that are valuable tools for system modeling, user interaction, and functional modeling.
Using Miro's use case diagram templates offers many benefits:
Ease of use: Designed with beginners in mind, our templates are intuitive and easy to customize, allowing you to create professional, functional diagrams without any prior experience.
Time-saving: Pre-built templates save you time by providing a ready-made structure that you can quickly adapt to your specific needs.
Clarity and communication: Use case diagrams help clarify system requirements and improve communication among team members, stakeholders, and clients.
Collaboration: Miro's collaborative features enable real-time editing and feedback, ensuring that everyone is on the same page.
Flexibility: Our templates are versatile and can be used across various industries and project types, from software development to business process modeling.
Select a template: Start by choosing a use case diagram template from Miro's template library. You can find templates by searching for "use case diagram template" or "UML use case" in the library.
Customize the template: Once you've selected a template, customize it to fit your project's requirements. Add or remove elements, change text, and adjust the layout as needed.
Add actors and use cases: Identify the actors (users or systems) involved in your process and add them to the diagram. Then, define the use cases (interactions) and connect them to the relevant actors.
Detail the relationships: Use lines and arrows to illustrate the relationships between actors and use cases. This helps to visualize the flow of interactions and dependencies.
Collaborate and share: Invite team members to collaborate on the diagram in real time. Use Miro's commenting and feedback features to gather input and make necessary adjustments.
Finalize and present: Once your diagram is complete, use Miro's Presentation Mode to share it with stakeholders. You can also export the diagram in various formats for documentation purposes.
By leveraging Miro's use case templates for software development, teams can streamline their workflow, improve communication, and ensure that everyone has a clear understanding of the system requirements. These templates are not just tools; they are enablers of successful project outcomes, helping teams to thrive and achieve their goals.