About the value stream mapping templates collection
A Value Stream Map (VSM) template is a visual tool that illustrates the flow of materials and information as a product or service moves through a value stream. Unlike a standard flowchart, a VSM includes data such as processing time, wait time, and error rates. It allows organizations to see not just how work happens, but where value is being created and where it is being lost to "Muda" (Waste).
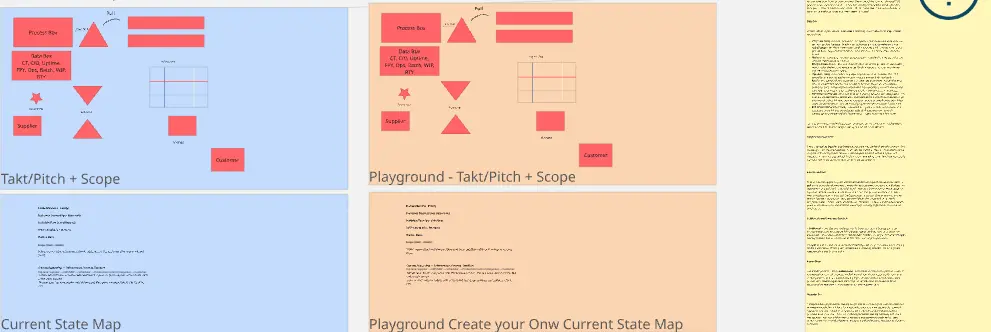
The Anatomy of a VSM Template
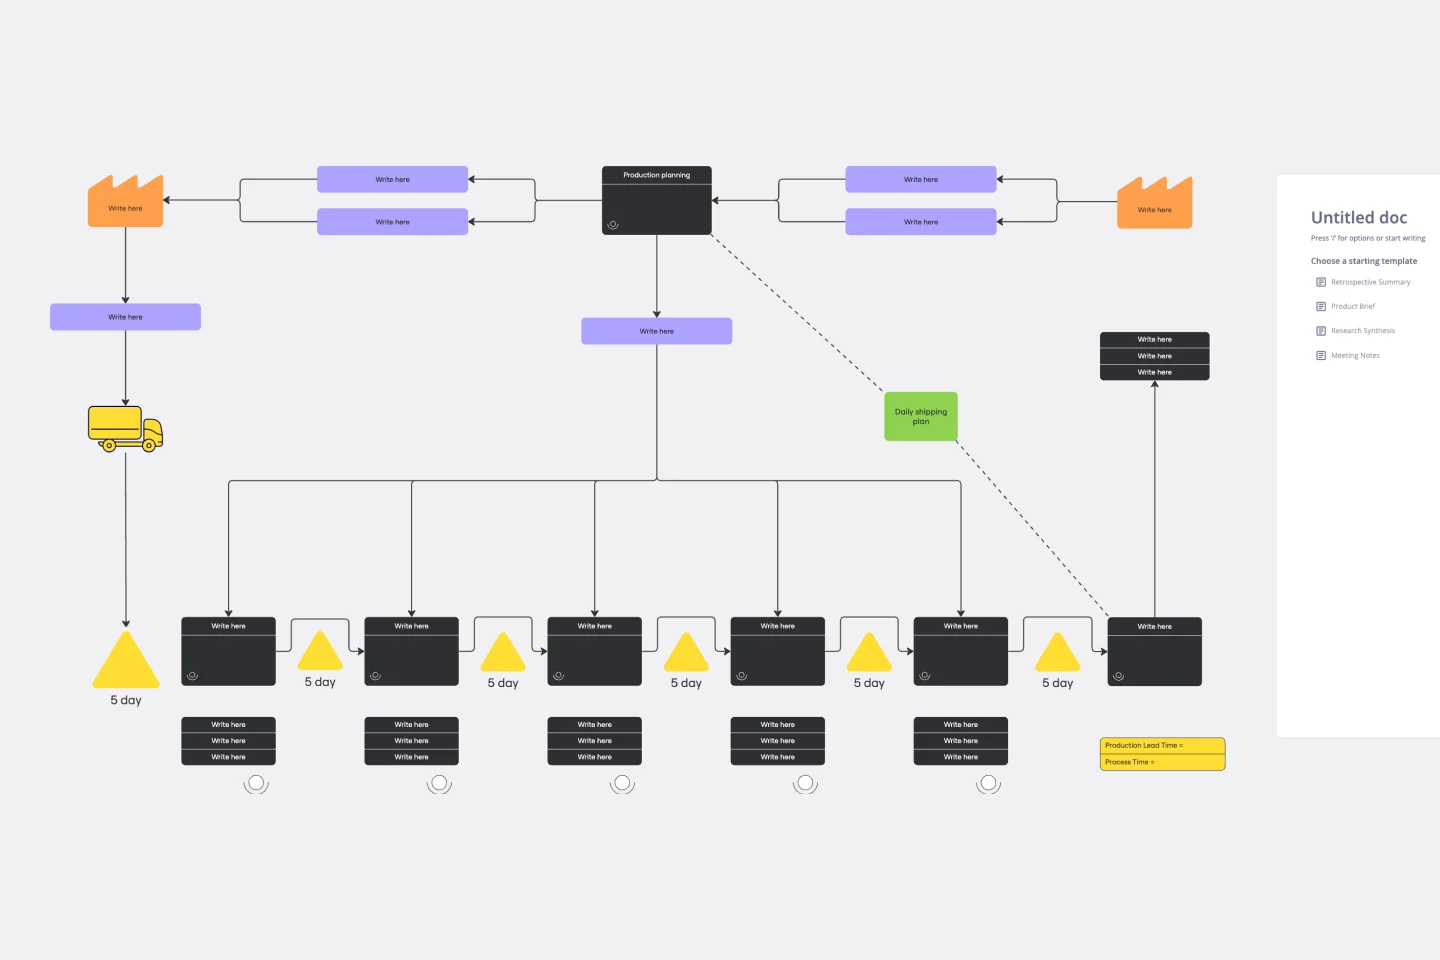
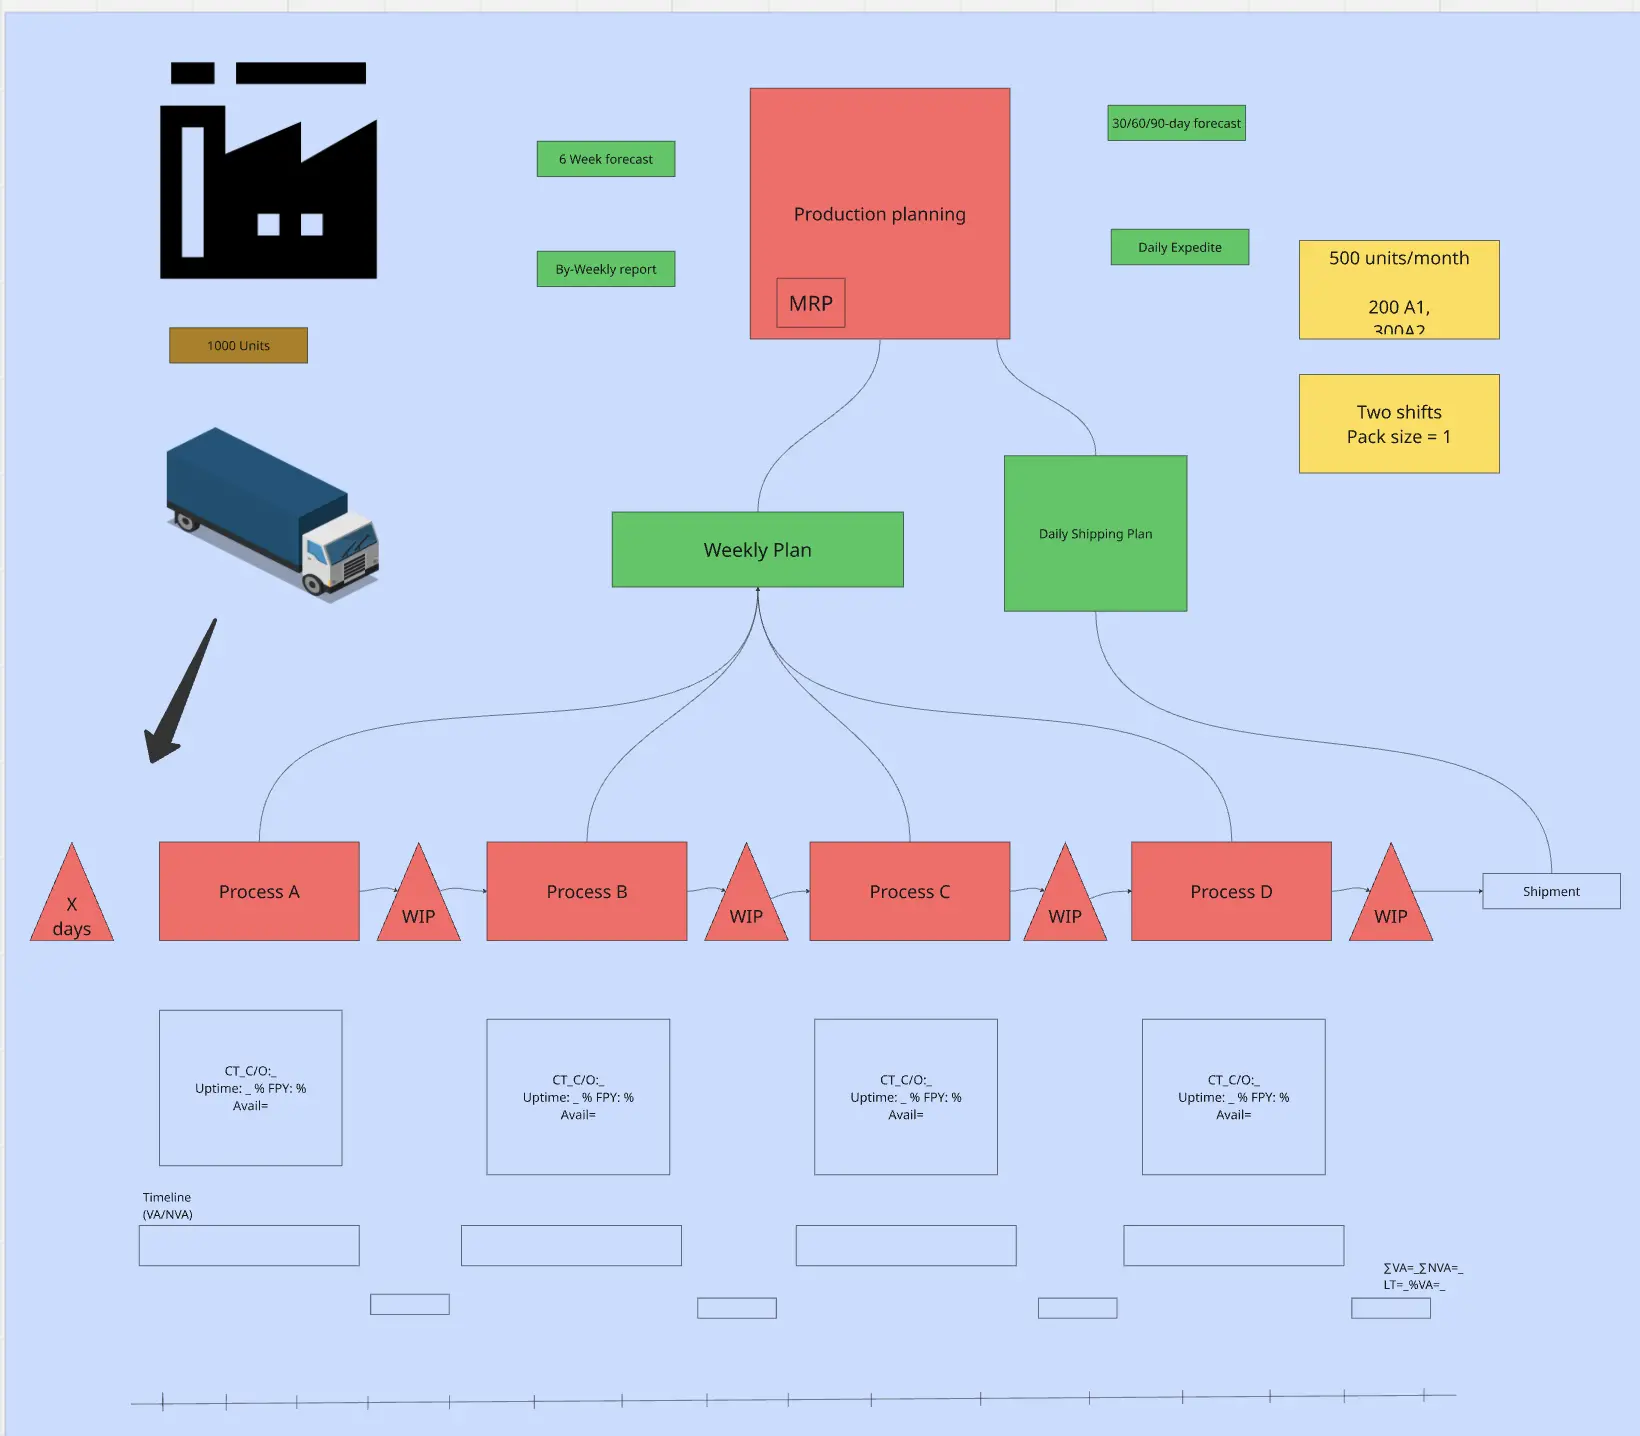
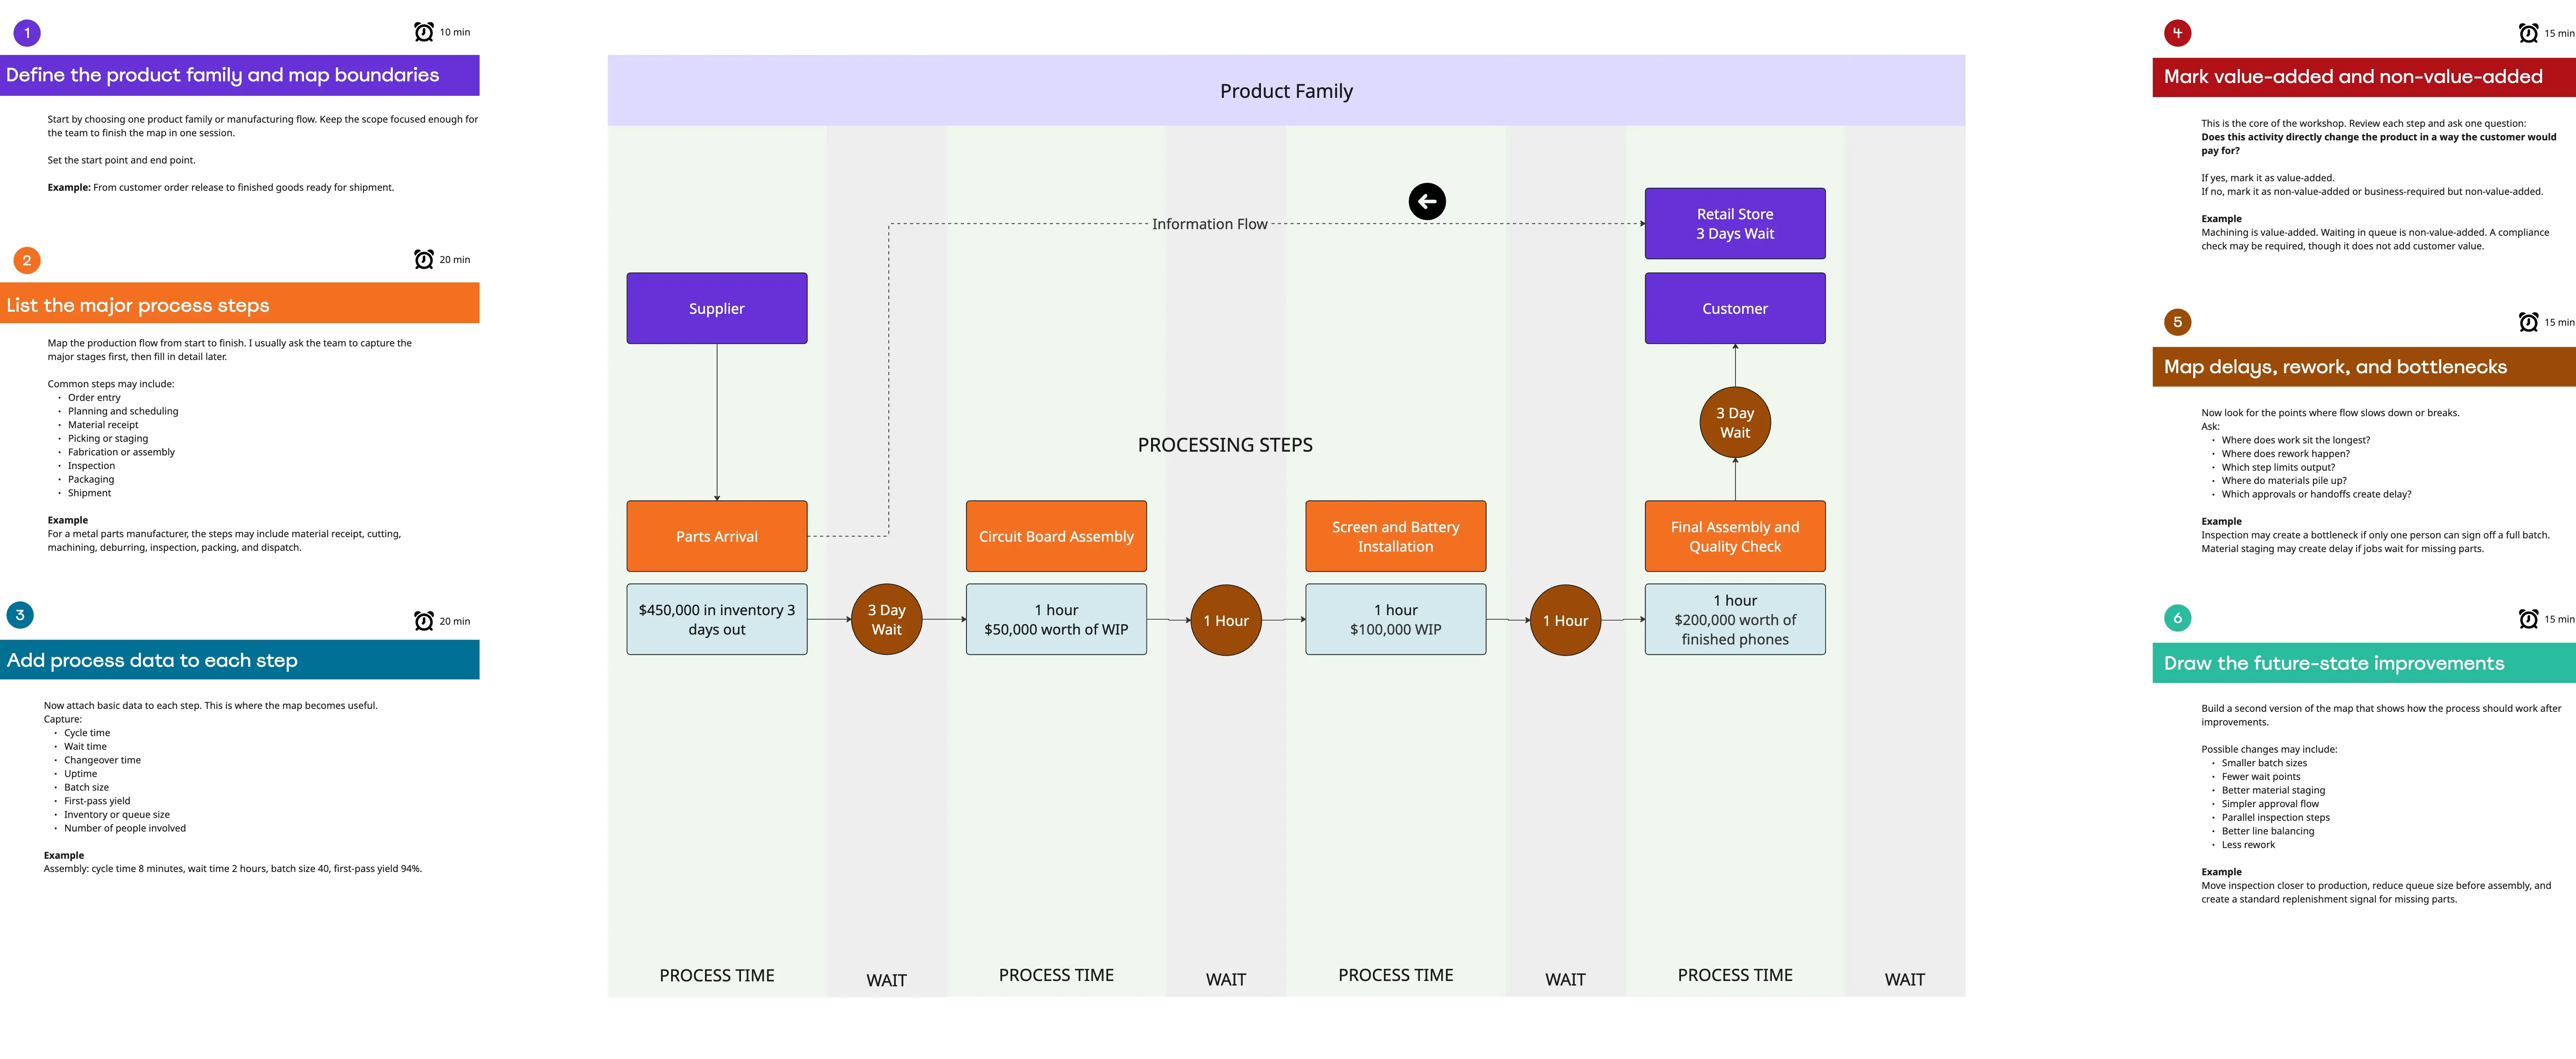
A professional Value Stream Map is divided into three distinct horizontal sections. Every high-performance Miro board must include:
1. The Information Flow (Top)
This section maps how the customer's order triggers production. It includes symbols for:
Production Control: The central hub managing schedules.
Electronic/Manual Info Flows: How data moves (e.g., via ERP or paper).
2. The Material/Process Flow (Middle)
This section shows the physical or digital steps the product takes.
Process Boxes: Each major step in the value stream.
Data Boxes: Metrics for each step (Cycle Time, Uptime, Batch Size).
Inventory Triangles: Visual markers for work waiting between steps.
3. The Timeline Ladder (Bottom)
The most critical part of the VSM. It looks like a staircase:
Top Step: Represents Non-Value-Added Time (waiting, moving, storage).
Bottom Step: Represents Value-Added Time (actual work).
The Goal: Calculate the Process Efficiency by dividing Value-Added Time by Total Lead Time.
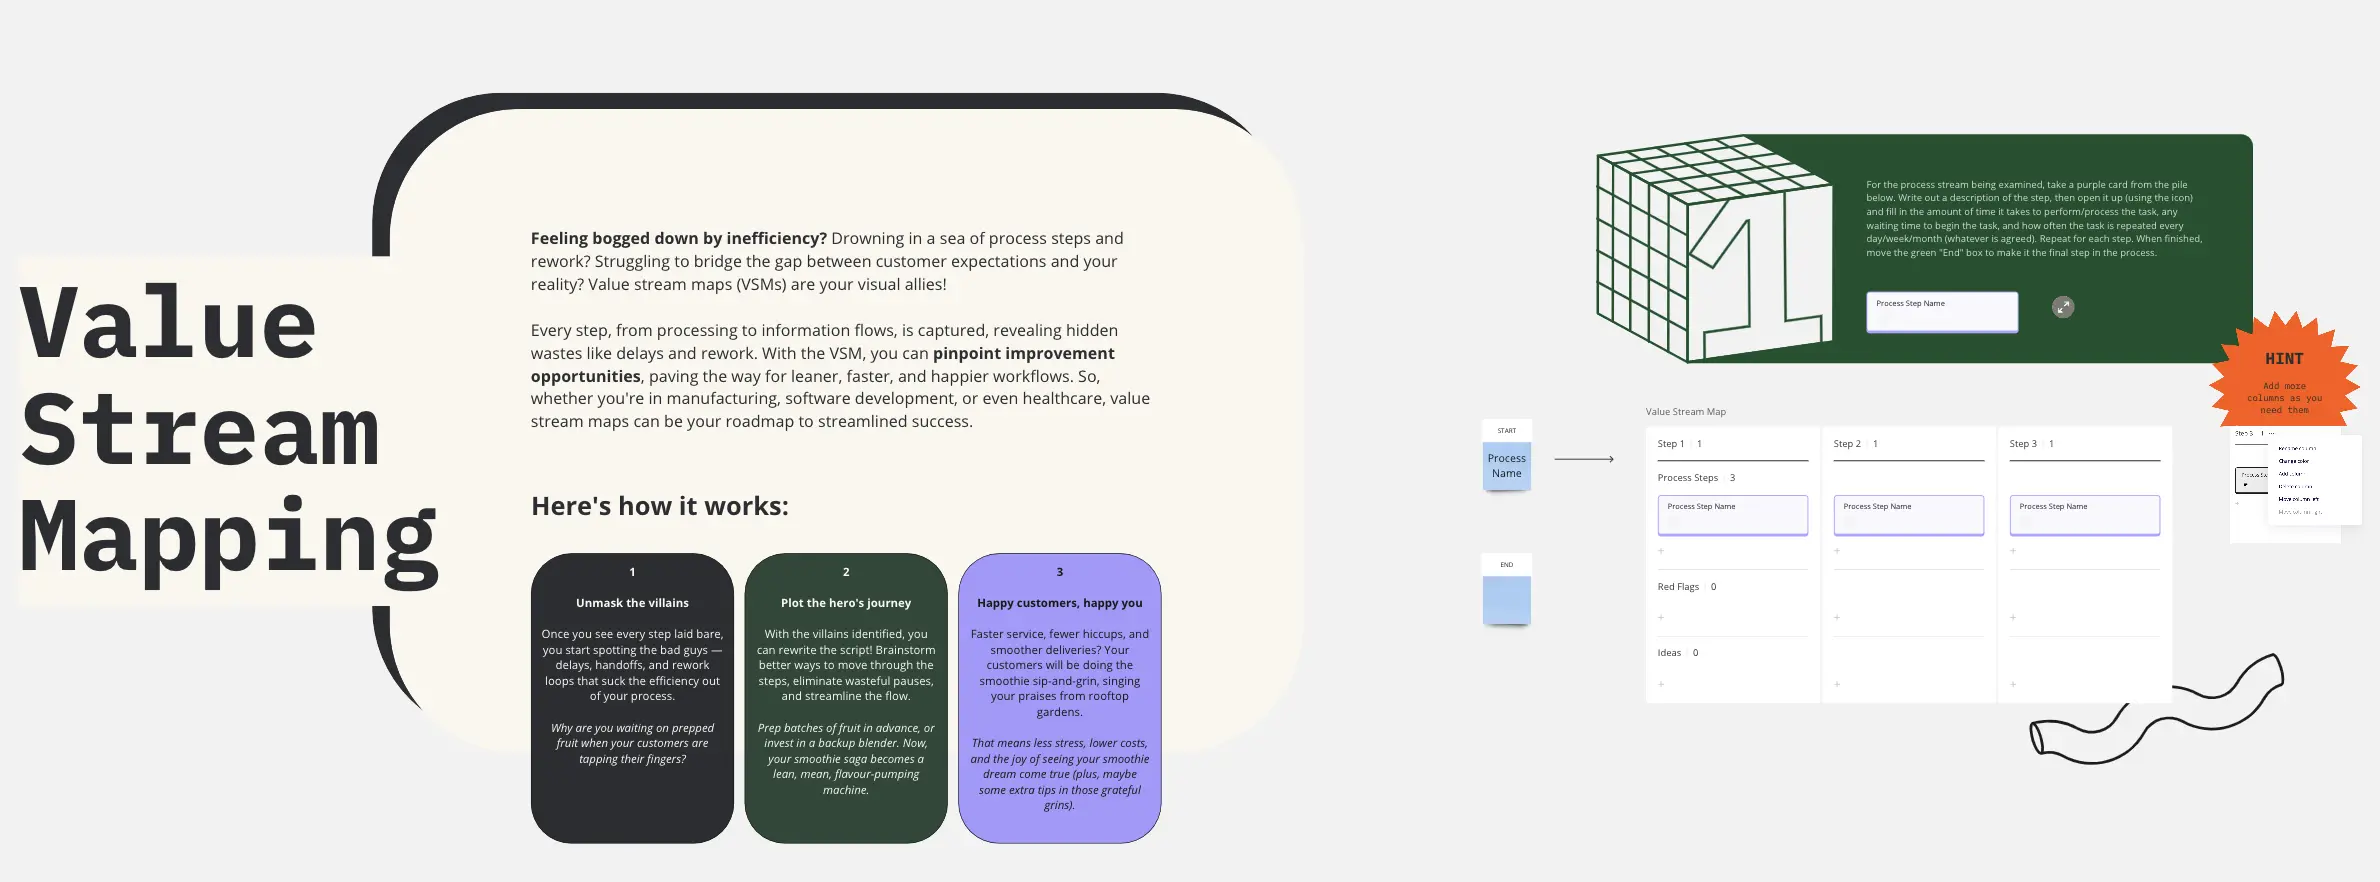
The "Flow" Audit: 3 Ways to Identify Hidden Waste
A VSM is a diagnostic tool. Before designing your "Future State" on Miro, apply these three expert "health checks" to your current process:
1. The "Lead Time vs. Processing Time" Audit
The Audit: Is your "Lead Time" (total time from start to finish) 10x longer than your "Processing Time" (actual work time)?
The Fix: Audit your Dead Zones. In most inefficient value streams, 90% of the time is spent waiting. If a task takes 1 hour to complete but sits in an inbox for 3 days, the bottleneck is the Handoff, not the worker. Your template must include a "Timeline Ladder" to visualize these gaps.
2. The "Information Silo" Test
The Audit: Are your "Information Flows" (the top half of the map) manual, fragmented, or redundant?
The Fix: Audit your Communication. Use the VSM to track how a work order travels. If information is being manually re-entered into three different systems, you have identified a major source of "Over-processing." A professional VSM tracks the data as much as the product.
3. The "First-Pass Yield" (FPY) Audit
The Audit: How often does a task have to be "reworked" or sent back for corrections?
The Fix: Audit your Quality at the Source. Use your template to record the % Complete and Accurate (%C&A) for each step. If a step has a 50% %C&A, half of your capacity is being wasted on fixing errors. Improving this metric is often faster than hiring more people.
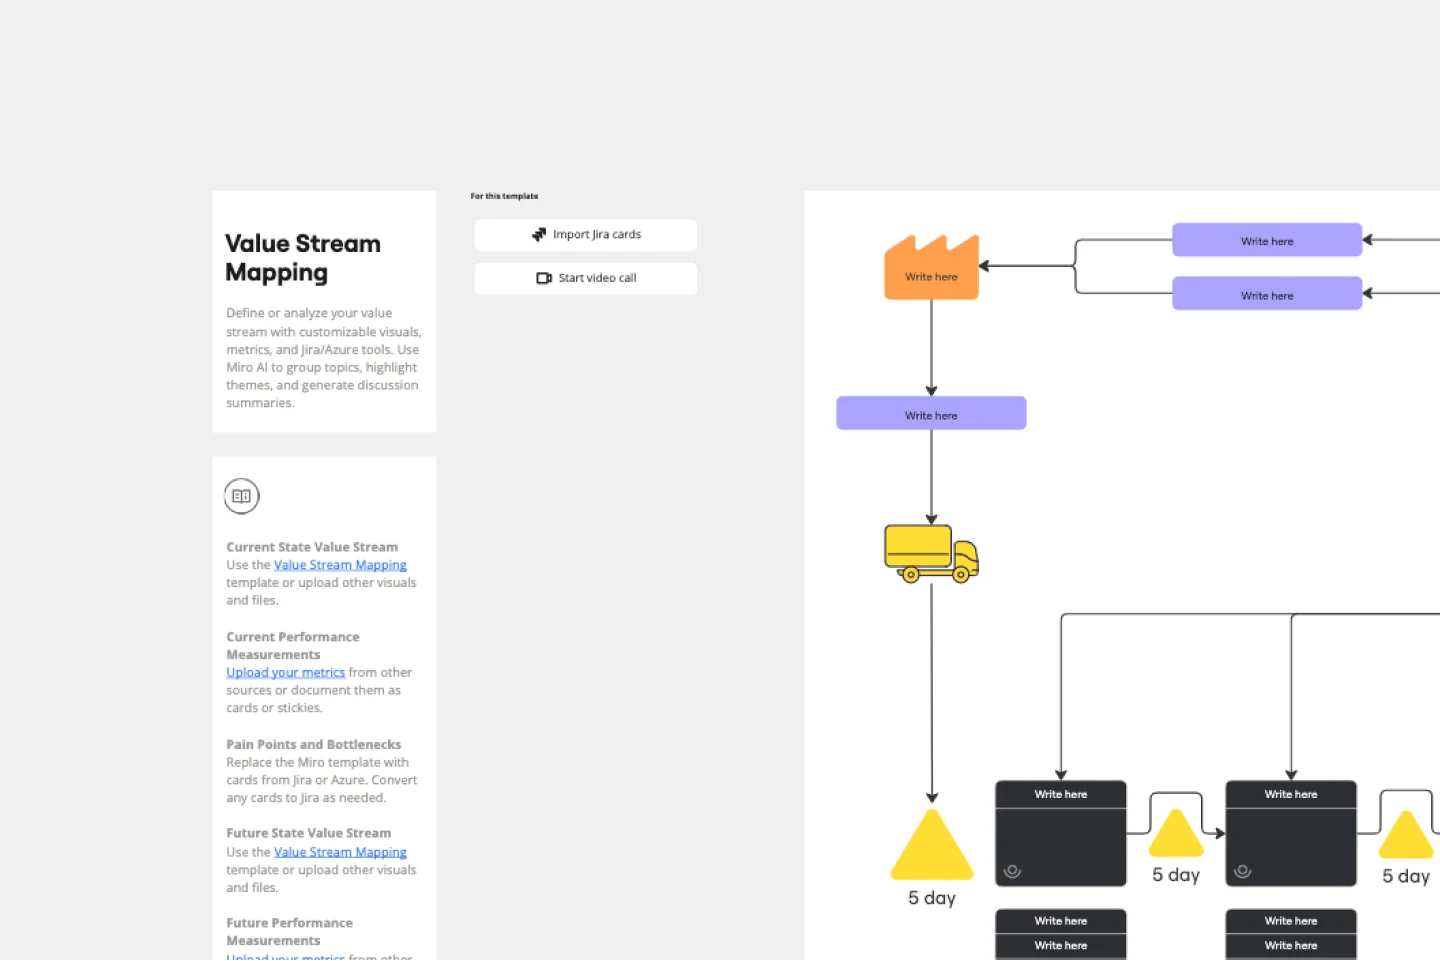
How to use the value stream mapping templates in Miro
Select a template: Start by choosing a value stream mapping template from Miro's template library. You can find templates that cater to various industries and use cases.
Define your process: Identify the process you want to map. This could be anything from product development to customer service workflows.
Map the current state: Use the template to map out the current state of your process. Include all relevant steps, activities, and information flows.
Identify bottlenecks: Analyze the current state map to identify any bottlenecks or inefficiencies. Look for areas where delays occur or resources are underutilized.
Design the future state: Create a future state map that outlines an optimized version of your process. Incorporate improvements and changes that address the issues identified in the current state.
Implement changes: Use the insights gained from your value stream maps to implement changes in your workflow. Monitor the impact of these changes and make further adjustments as needed.
Following these steps, you can use our value stream mapping templates to improve your team's efficiency and productivity. These templates not only help visualize and understand your processes but also provide a clear path for continuous improvement, enabling your team to thrive.