Company Organizational Chart Template & Example for Teams | Miro

Company Organizational Chart

Create a visual guide to the structure of your organization.

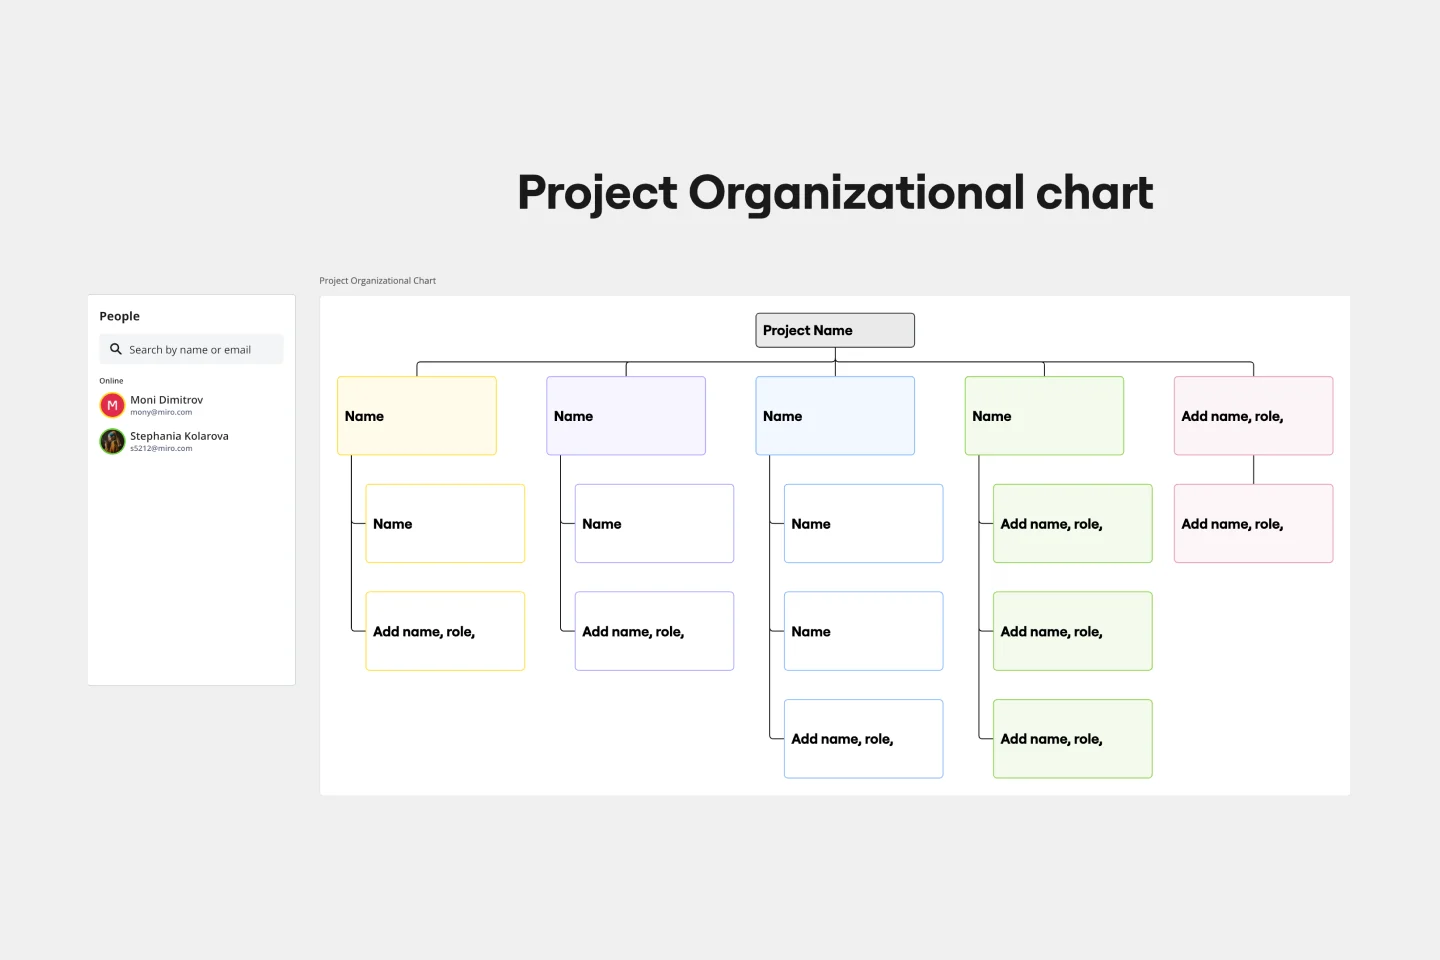
About the Company Organizational Chart template 

A company organizational chart is a visual guide to how your organization is structured. It will generally reflect reporting structure (who manages specific teams and people) and can be especially helpful for new employees to refer to as they familiarize themselves with your company. 

Keep reading to know more about the org chart template.

Why should you use a company organizational chart?  

In addition to showing the relations between employees at your company, you can also use a company organizational chart template to represent the structure of different departments or corporate functions inside your business.

When to use a company organizational chart template? 

You can use your company organizational chart when planning employees’ career plans, managing HR resources, or any presentation you see fit. 

How do you use the organizational chart template in Miro?

Creating an organizational chart is easy using Miro! Simply follow these easy steps to create an organizational chart that visually showcases your company structure:

  1. Start with our pre-made org chart template. Then, customize any elements you’d like, changing the sizes, shapes, and colors. For example, you may want to use colors or shapes to indicate people’s level of authority or department.

  2. Write the names of the people inside your organization, as well as their roles and responsibilities. You can either just leave it in written form or add photos or other images to represent each person visually in your company organizational chart.

  3. Invite your coworkers to collaborate in your company organizational chart template with you. Your company organizational chart can be a living document, and any changes you or your teammates make to the chart will be reflected in real-time. 

FAQs about company organizational chart

What are the four types of organizational structures?

The traditional four types of organizational structures. Functional: C-level is on the top of the structure, followed by senior management, management, etc. Divisional: where product lines and geography organize teams and people. Matrixed: people are organized in teams depending on the project/product they are working on Flat: where hierarchies are little to none and teams self-manage themselves. These are traditional company organization structures, but as we live in a more dynamic and decentralized work environment, those structures have been challenged and disrupted by new agile teams and businesses.

Where can I find a company organizational chart?

You can find a company organizational chart in our Templates Library or Miroverse.

Company Organizational Chart

Get started with this template right now.

Related Templates
BPMN template-thumb-web
Preview

BPMN Template

Works best for:

Mapping, Diagrams, Business Management

The BPMN template helps you track and get an overview of your business processes. It’s a great way to identify any bottlenecks and make your operations more efficient. The BPMN methodology became a universal language when managing business processes, and multiple industries use it as a management tool. Project managers, business analysts, and IT administrators use the BPMN process flow diagram to manage projects, visually communicate the process flows, and keep track of process constraints. Try it for yourself and see improvements in your organization’s agility.

BPMN Template
Org Chart Thumbnail
Preview

Organizational Chart Template

Works best for:

Org Charts, Operations, Mapping

Who makes up the team? What roles do they play? Who does each member report to? An organizational chart, or org chart, can answer it all at a glance. Ideal for onboarding new employees, these visual diagrams plot out company structure and the chain of command to help your team members understand reporting relationships, their role, and how they fit into the broader organization. Our template lets you choose your own chart structure and easily plot the connections between employees, roles, and departments.

Organizational Chart Template
azure-demand-forecasting-thumb
Preview

Azure Demand Forecasting Template

Works best for:

Software Development, Diagrams

The Azure Demand Forecasting diagram will show the architecture of a demand forecast, making it easier for you to predict data consumption, costs, and forecast results. Azure is Microsoft’s cloud computing platform, designed to provide cloud-based services such as remote storage, database hosting, and centralized account management. Azure also offers new capabilities like AI and the Internet of Things (IoT).

Azure Demand Forecasting Template
3×3 Prioritization Method-thumb-web
Preview

3x3 Prioritization Method Template

Works best for:

Operations, Prioritization, Strategic Planning

It’s all about assessing a task or idea, and quickly deciding the effort it will take and the potential impact it will have—ranked low, medium, or high. That’s what the 3x3 prioritization method does: Help teams prioritize and identify quick wins, big projects, filler tasks, or time-wasters. With nine bucket areas, it offers slightly greater detail than the 2x2 Prioritization Matrix (or Lean Prioritization Method). It’s easy to make your own 3x3 prioritization matrix—then use it to determine what activities or ideas to focus on with your valuable resources.

3x3 Prioritization Method Template
Research Design Thumbnail
Preview

Design Research Template

Works best for:

UX Design, Design Thinking, Desk Research

A design research map is a grid framework showing the relationship between two key intersections in research methodologies: mindset and approach. Design research maps encourage your team or clients to develop new business strategies using generative design thinking. Originally designed by academic Liz Sanders, the framework is meant to resolve confusion or overlap between research and design methods. Whether your team is in problem-solving or problem space definition mode, using a research design template can help you consider the collective value of many unrelated practices.

Design Research Template
Sequence diagram-thumb-web
Preview

UML Sequence Diagram Template

Works best for:

Software Development, Mapping, Diagrams

Analyze and showcase how external entities interact with your system using a sequence diagram. Get a bird’s-eye view of your work processes, business functions, and customer interactions using this diagram. Also, identify any potential problems early and solve them before implementation.

UML Sequence Diagram Template