AWS Solution Architecture
Helps improve AWS architectures per AWS best practices.
4 likes
118 uses
Bring everyone into your vision with our mapping and diagramming templates collection. Create diagrams, concept maps, and system mapping templates to communicate complex flows, creating a shared understanding.
AI Collaborators designed with specific skills like research, planning, or diagramming.
Helps improve AWS architectures per AWS best practices.

Create diagrams and docs for good software design.
511 templates
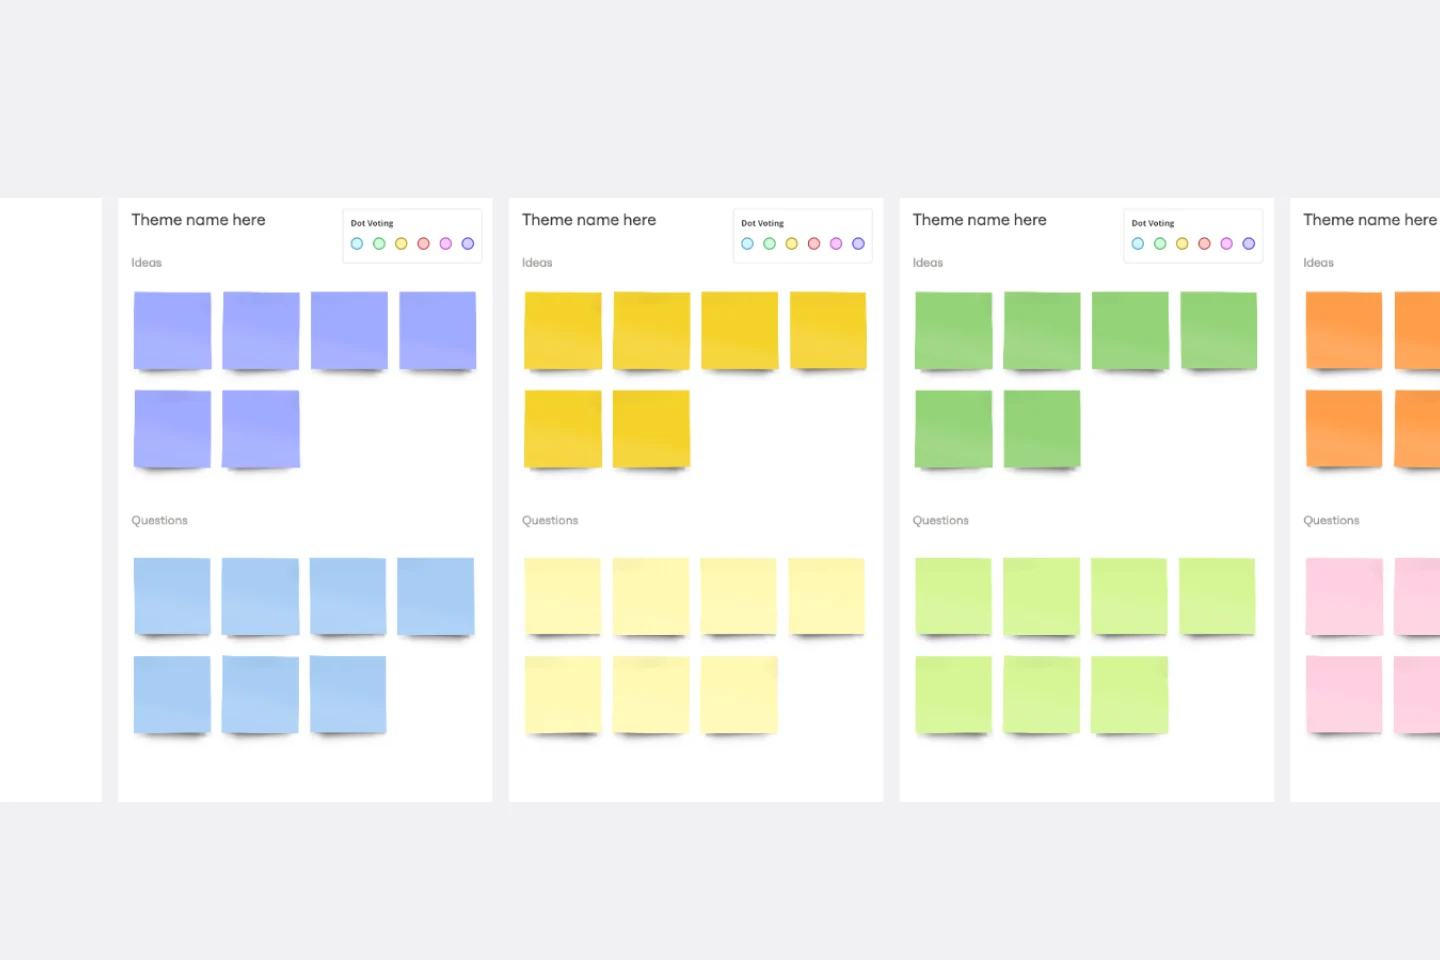
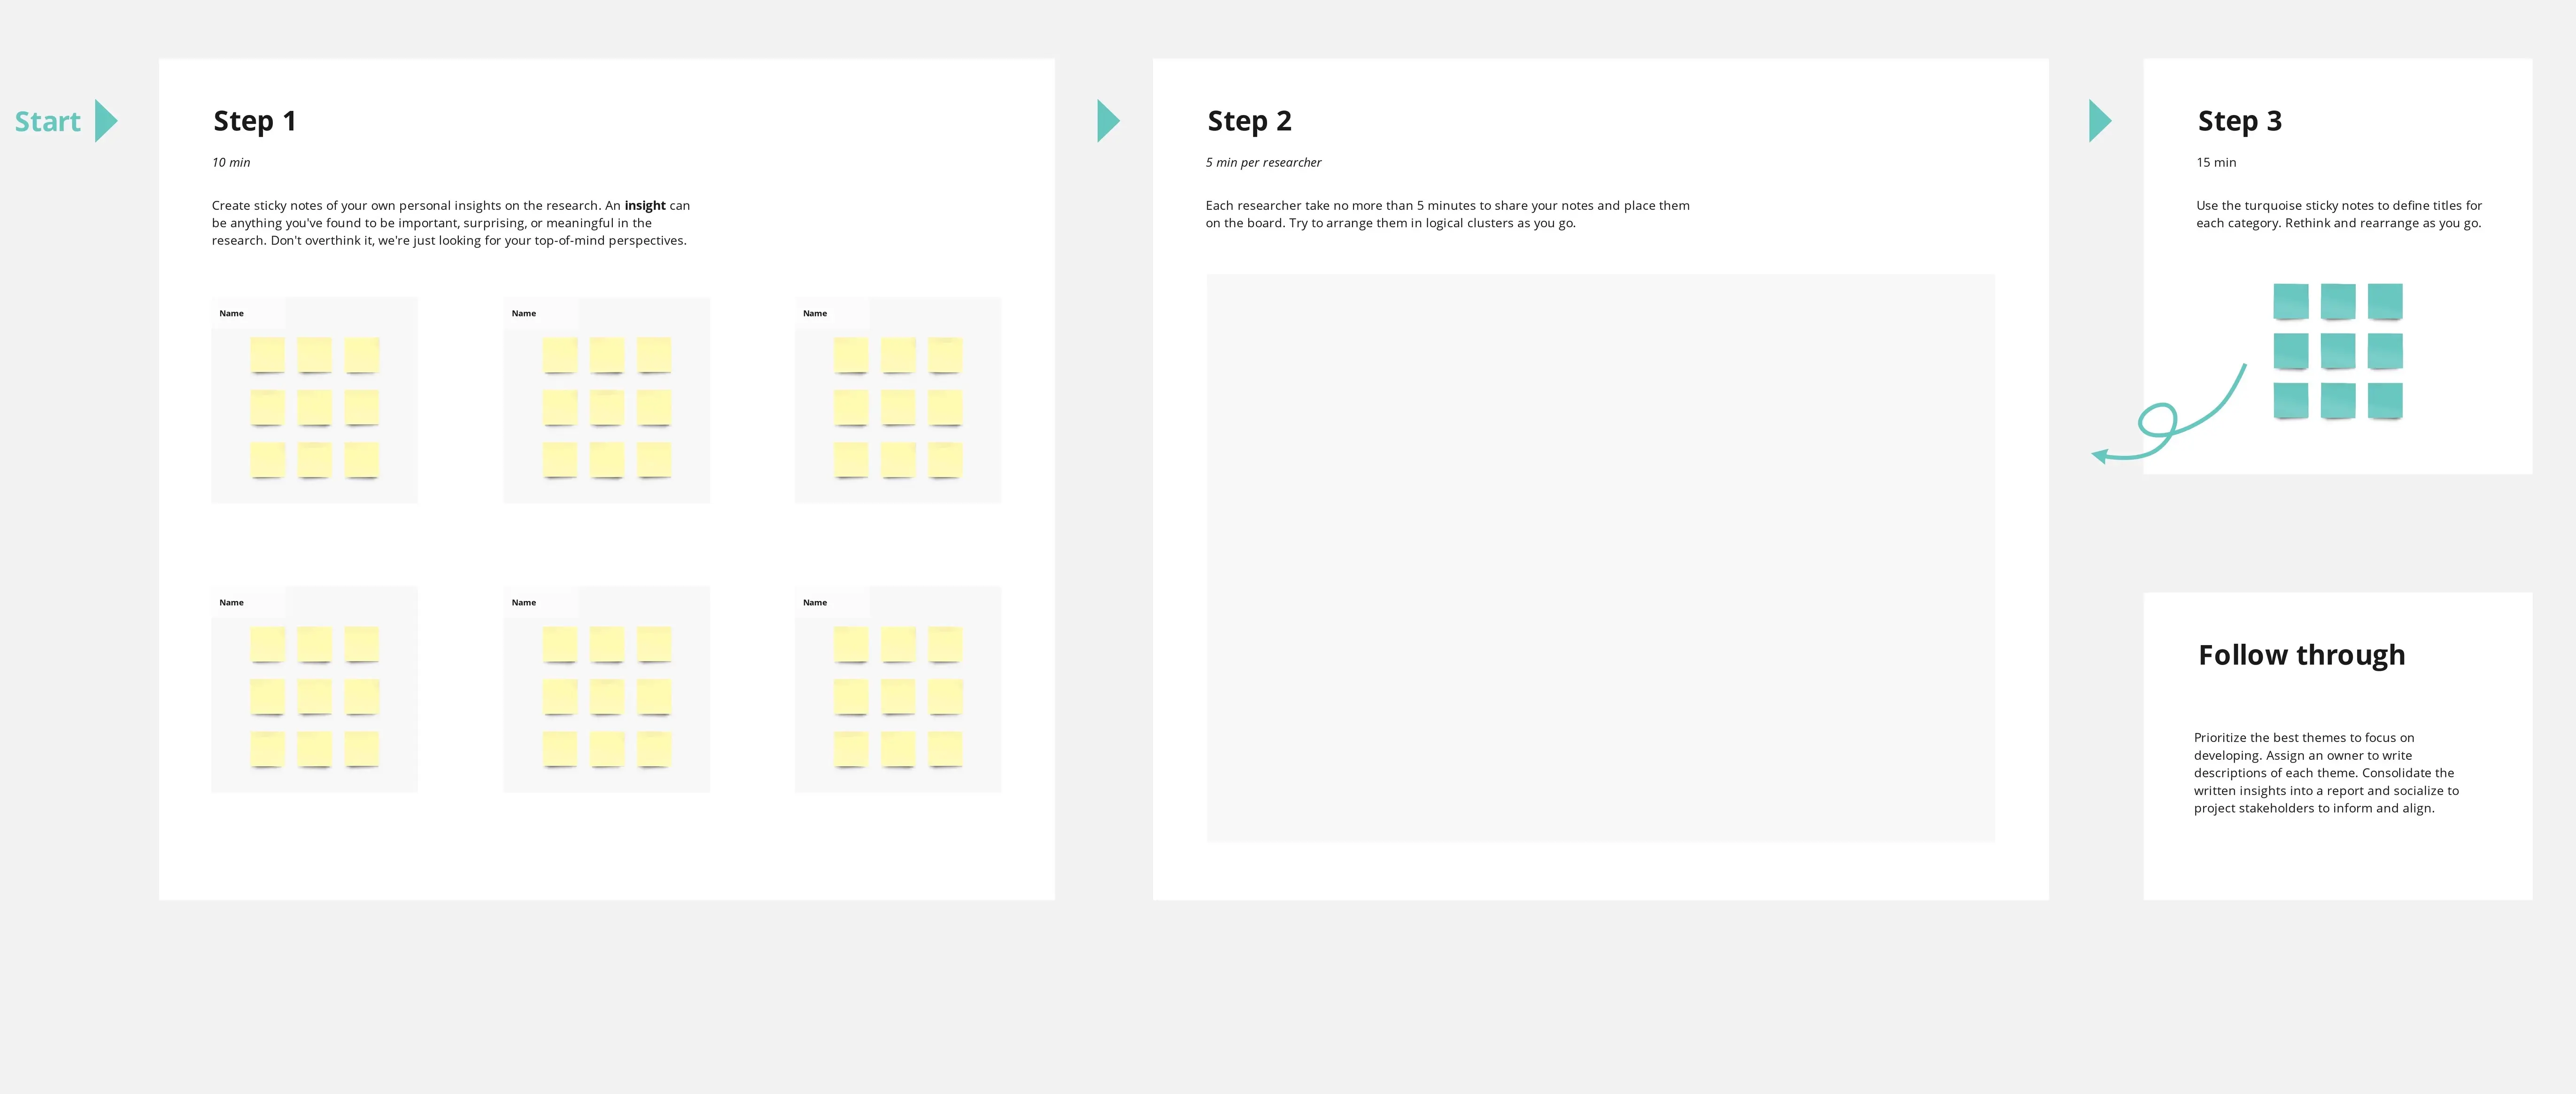
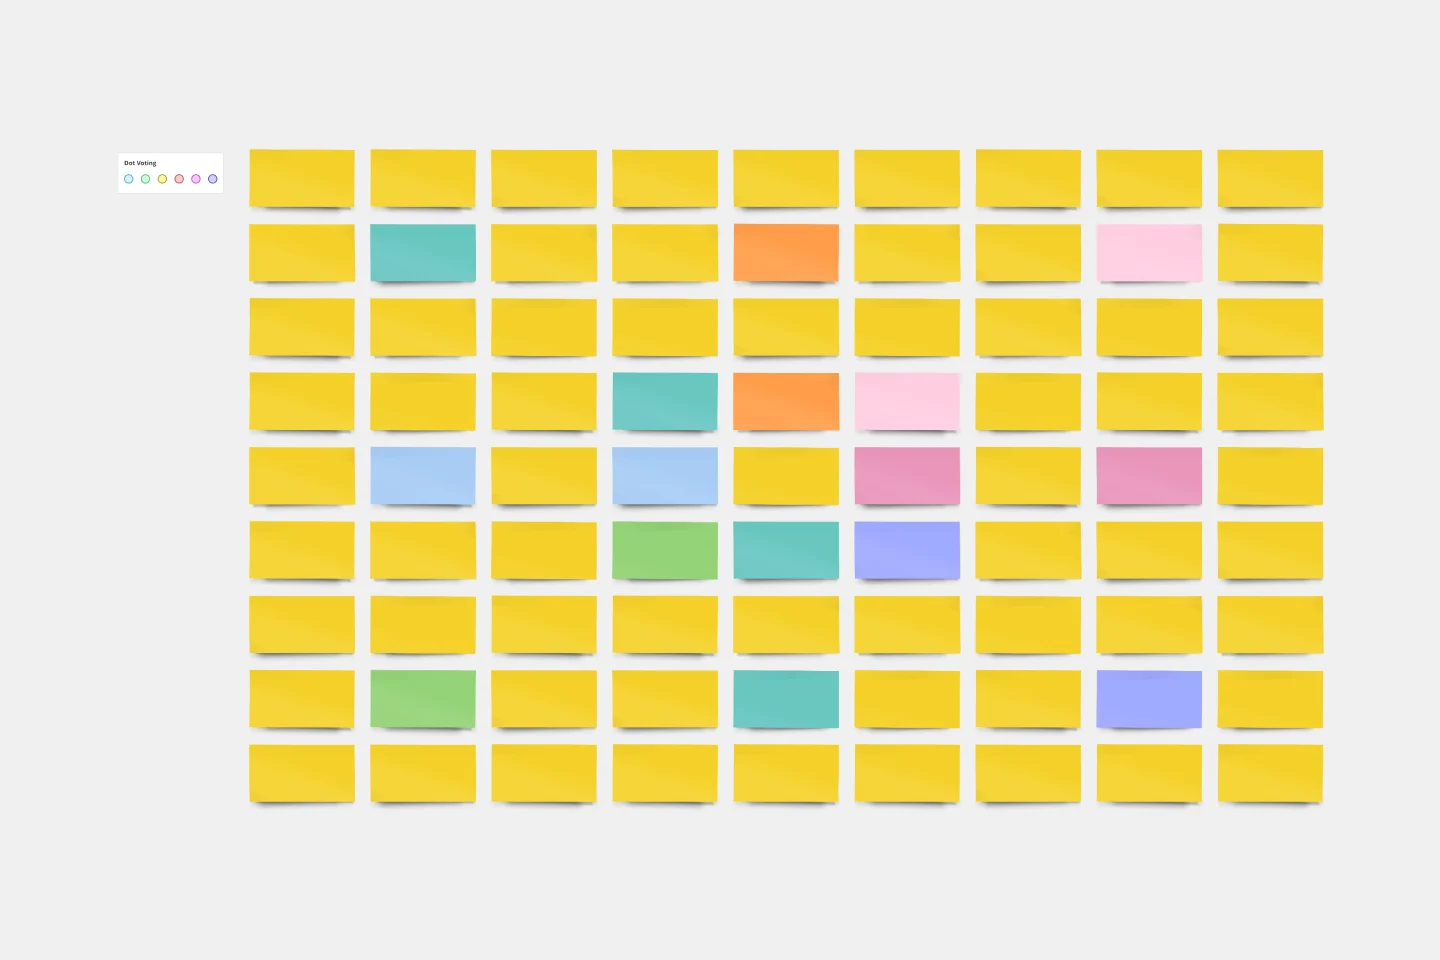
Affinity Diagram Template
You can use an affinity diagram to generate, organize, and consolidate information that comes out of a brainstorming session. Whether you’re building a product, working through a complex problem, establishing a process, or piecing apart an issue, an affinity diagram is a useful and simple framework that gives each team member the opportunity to pitch in and share their thoughts. But it’s not just ideal for brainstorms—this is a great template and tool when you need to reach consensus or analyze data such as survey results.
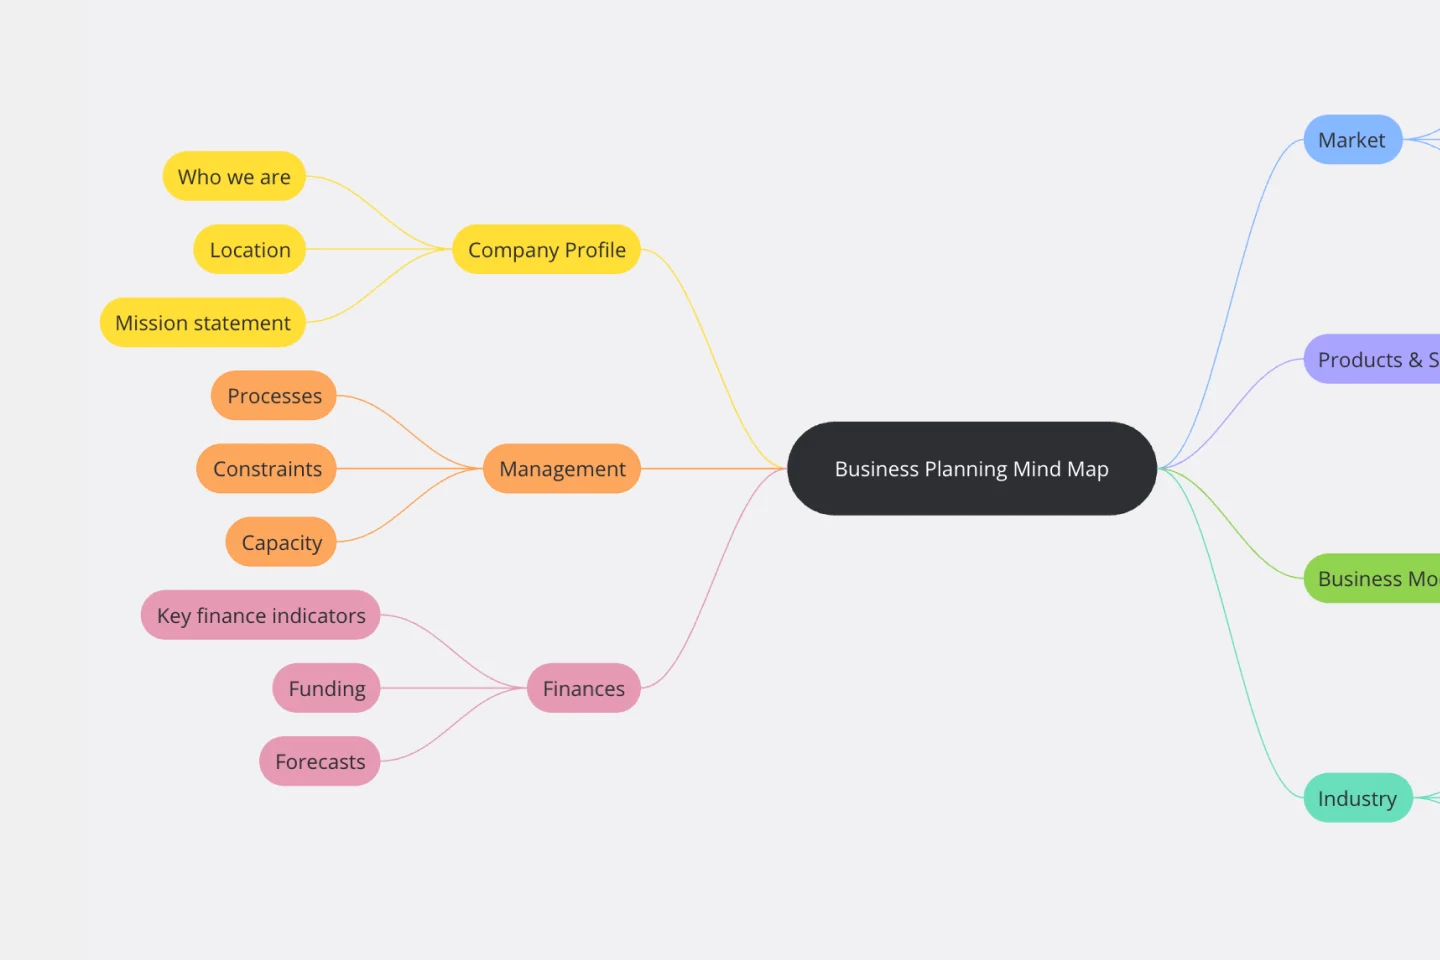
Business Plan Mind Map Template
The Business Plan Mind Map Template simplifies complex business information by visually organizing each plan section as a branch on a mind map. This enhances communication, understanding, and attention to crucial aspects, making it an essential tool for developing effective business strategies.
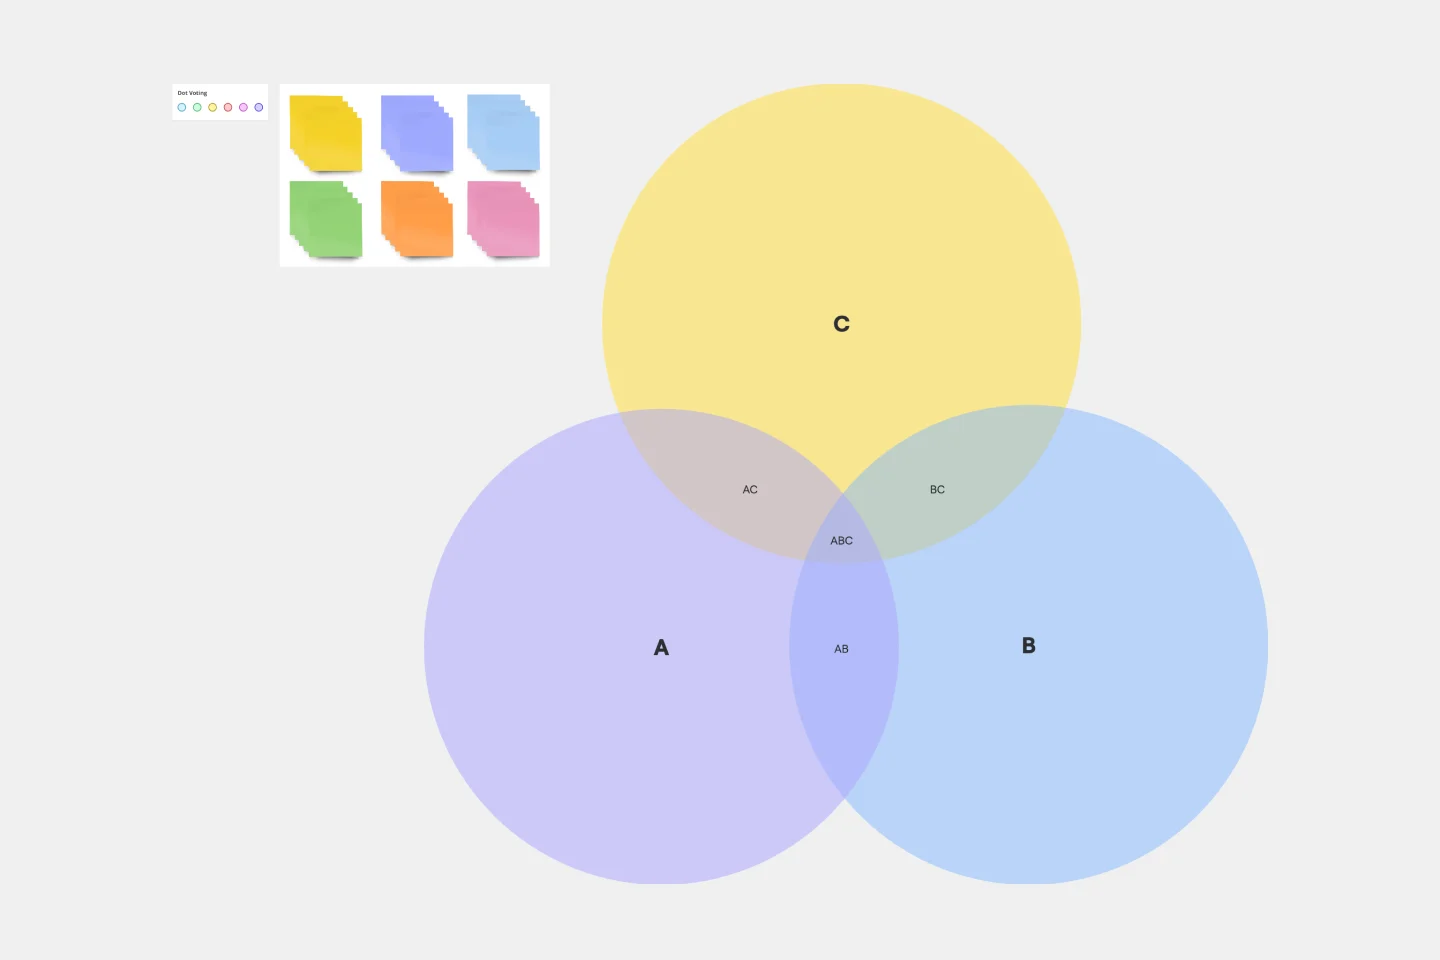
3-Circle Venn Diagram
Venn diagrams have been a staple of business meetings and presentations since the 1800s, and there’s a good reason why. Venn diagrams provide a clear, effective way to visually showcase relationships between datasets. They serve as a helpful visual aid in brainstorming sessions, meetings, and presentations. You start by drawing a circle containing one concept, and then draw an overlapping circle containing another concept. In the space where the circles overlap, you can make note of the concepts’ similarities. In the space where they do not, you can make note of their differences.
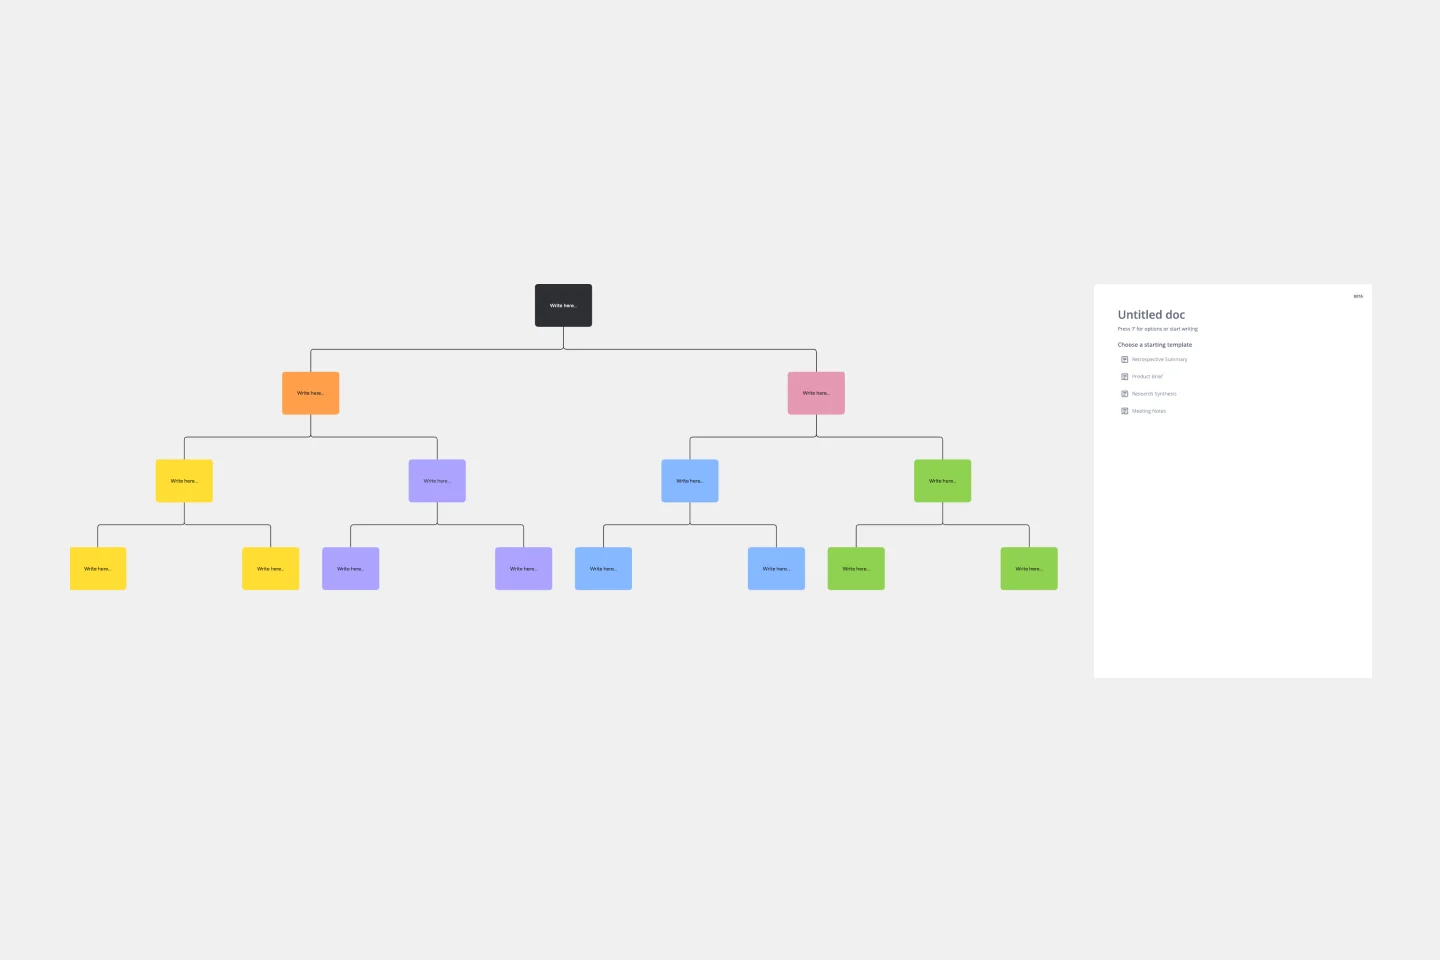
Tree Diagram Template
The tree diagram template helps you organize and present complex information. One of its key benefits is its ability to provide unparalleled visual clarity. It enables you to simplify complicated ideas into a structured, hierarchical format, making it easier to understand and communicate. This template enhances brainstorming sessions, project planning, and decision-making processes by mapping out relationships and dependencies clearly and effortlessly. You can now say goodbye to information overload and immerse yourself in a visual journey that simplifies complexity with the tree diagram template.
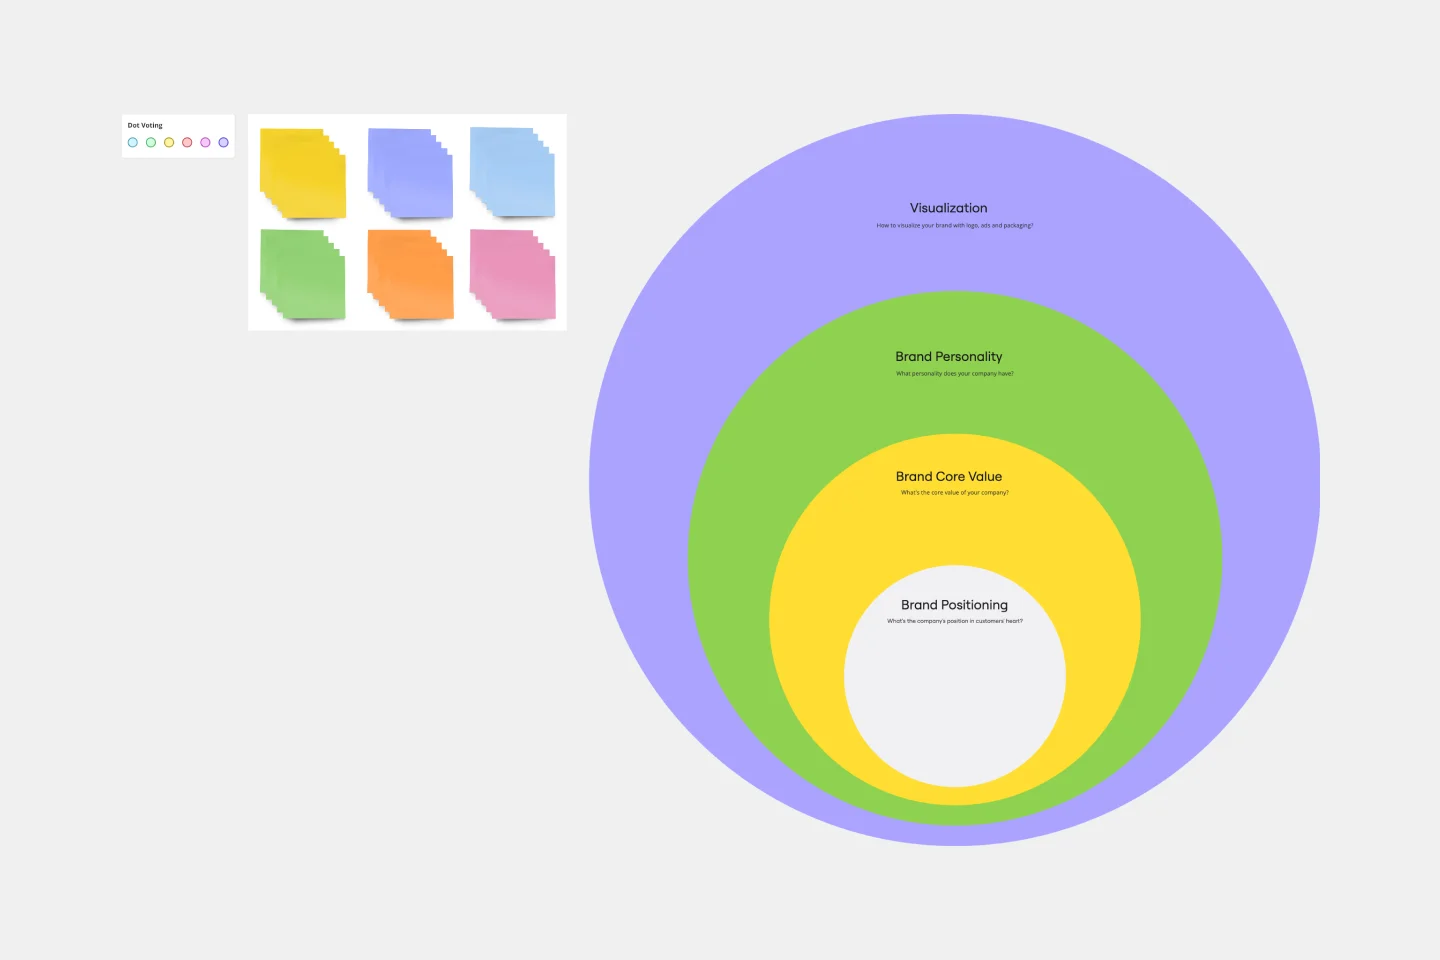
Onion Diagram Template
The Onion Diagram Template is a distinct tool designed to visually represent layers of a specific concept, system, or process, akin to the layers of an onion. Each concentric layer of the diagram provides insights into a different aspect or phase of the topic at hand, moving from the core foundational element outwards to more peripheral components. One of the prime benefits of this template is its ability to offer hierarchical clarity. Users can immediately discern the importance, sequence, or interrelation of different elements within a system, facilitating enhanced comprehension and efficient decision-making.
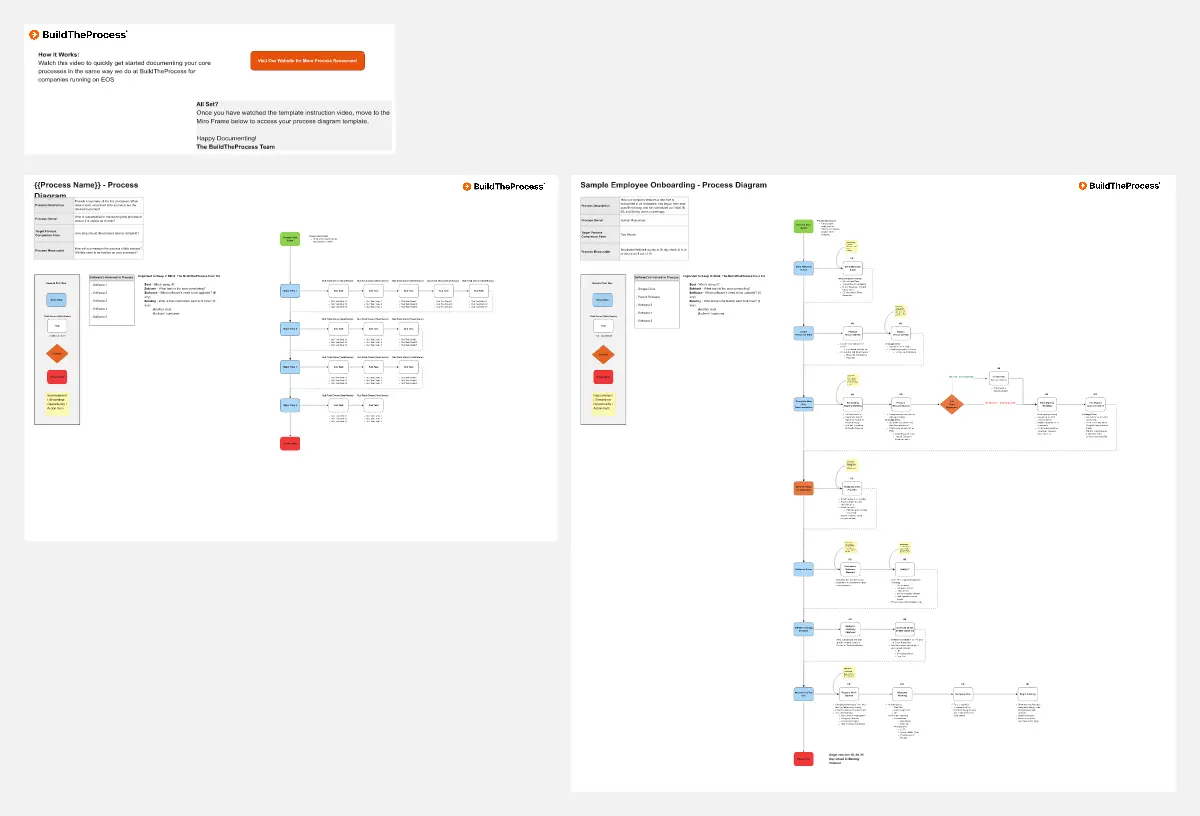
BPMN Template
The BPMN template helps you track and get an overview of your business processes. It’s a great way to identify any bottlenecks and make your operations more efficient. The BPMN methodology became a universal language when managing business processes, and multiple industries use it as a management tool. Project managers, business analysts, and IT administrators use the BPMN process flow diagram to manage projects, visually communicate the process flows, and keep track of process constraints. Try it for yourself and see improvements in your organization’s agility.
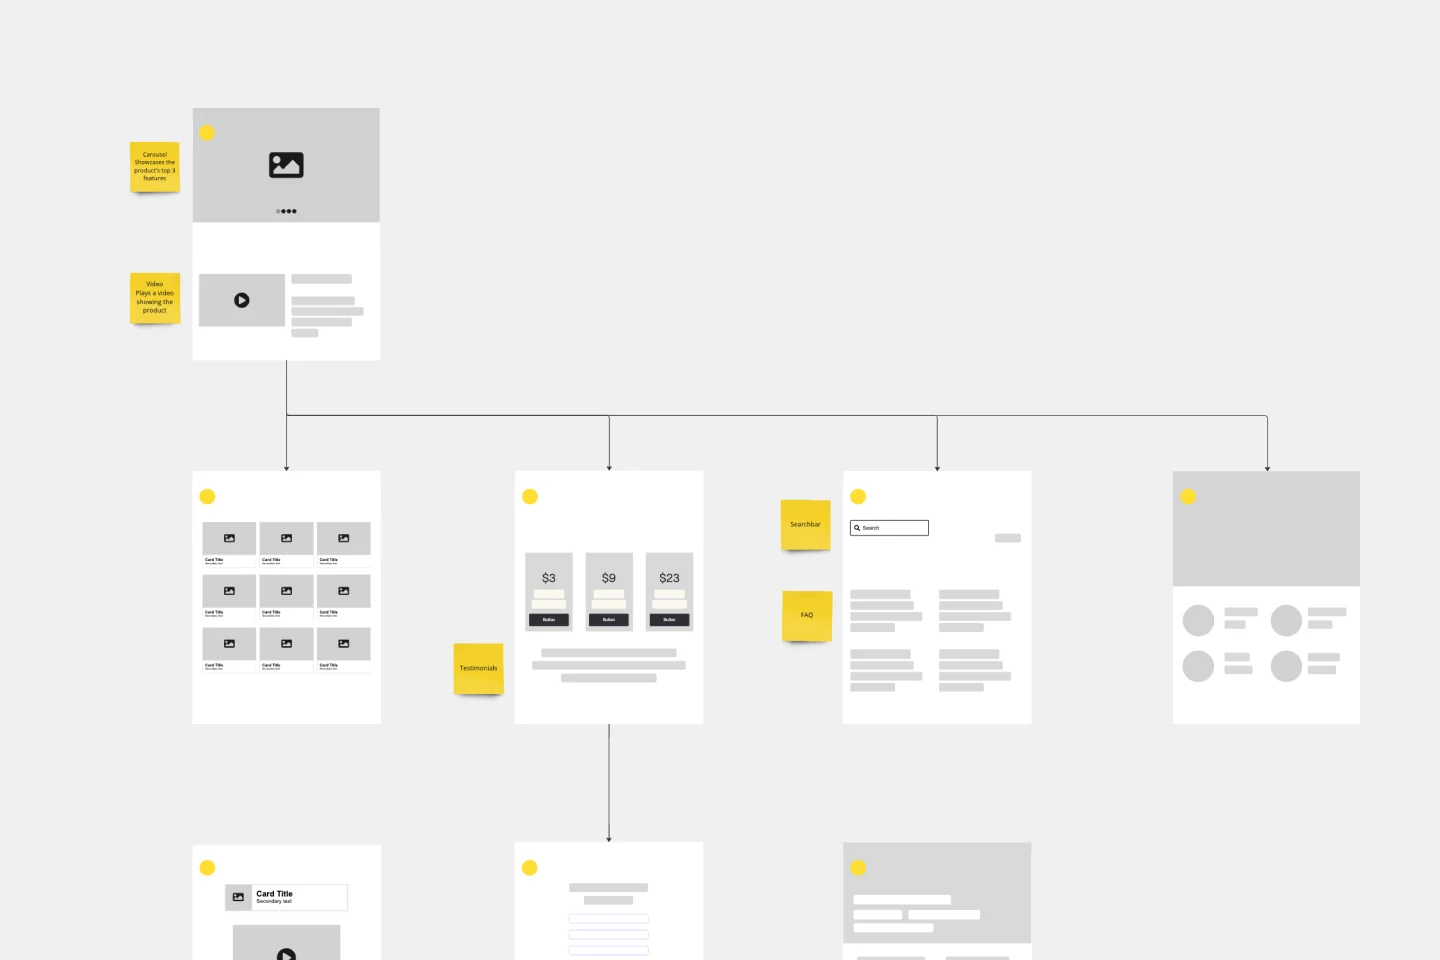
Website Flowchart Template
A website flowchart, also known as a sitemap, maps out the structure and complexity of any current or future website. The flowchart can also help your team identify knowledge gaps for future content. When you’re building a website, you want to ensure that each piece of content gives users accurate research results based on keywords associated with your web content. Product, UX, and content teams can use flowcharts or sitemaps to understand everything contained in a website, and plan to add or restructure content to improve a website’s user experience.
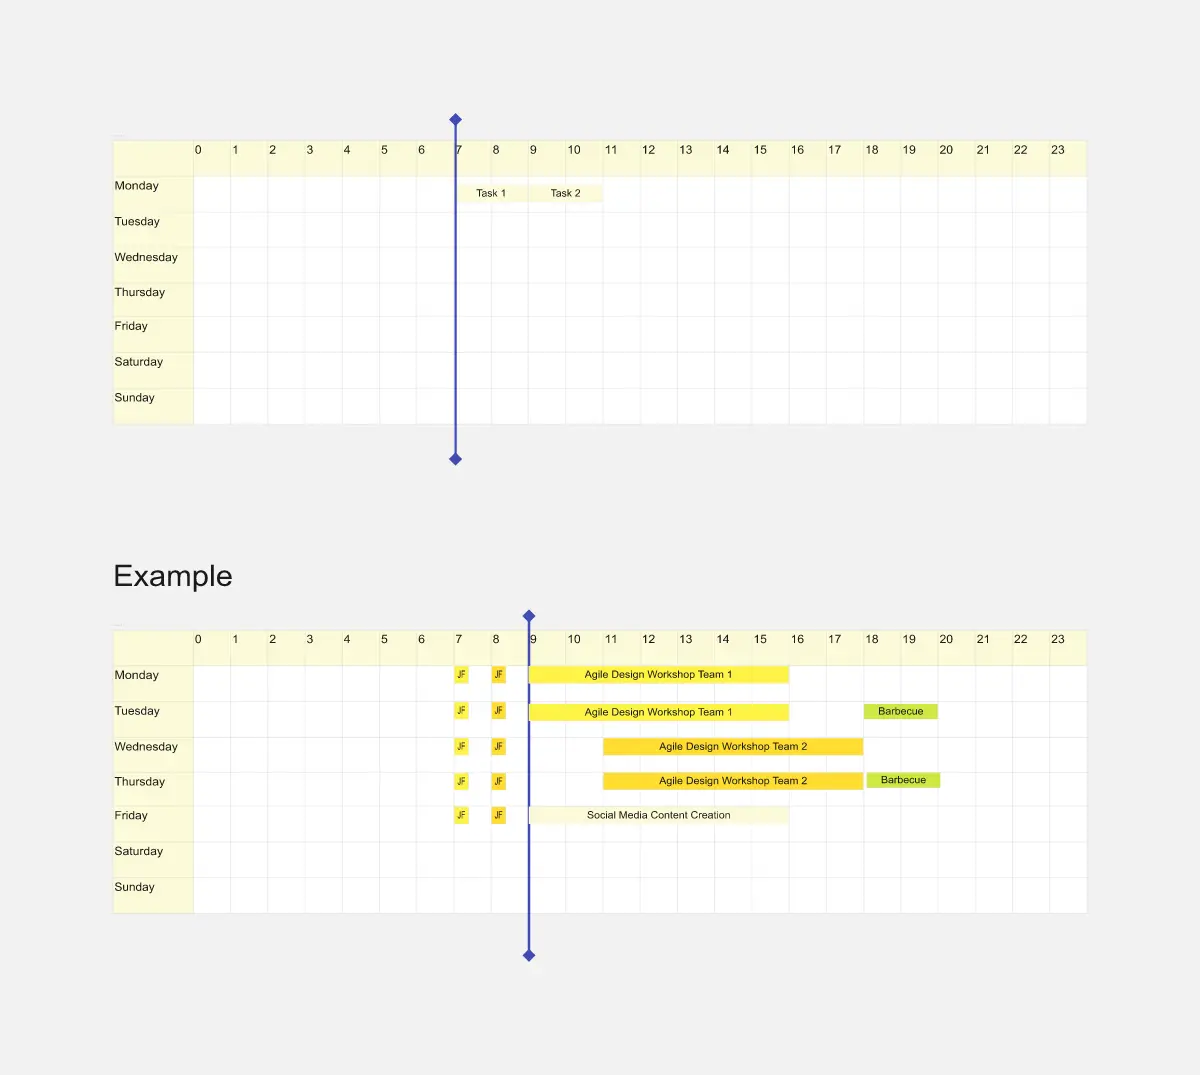
Weekly Planner
Weekly Planner template is perfect for organizing your weekly tasks and schedules. It helps you prioritize activities, set deadlines, and manage your time effectively, ensuring you stay productive and on track throughout the week.
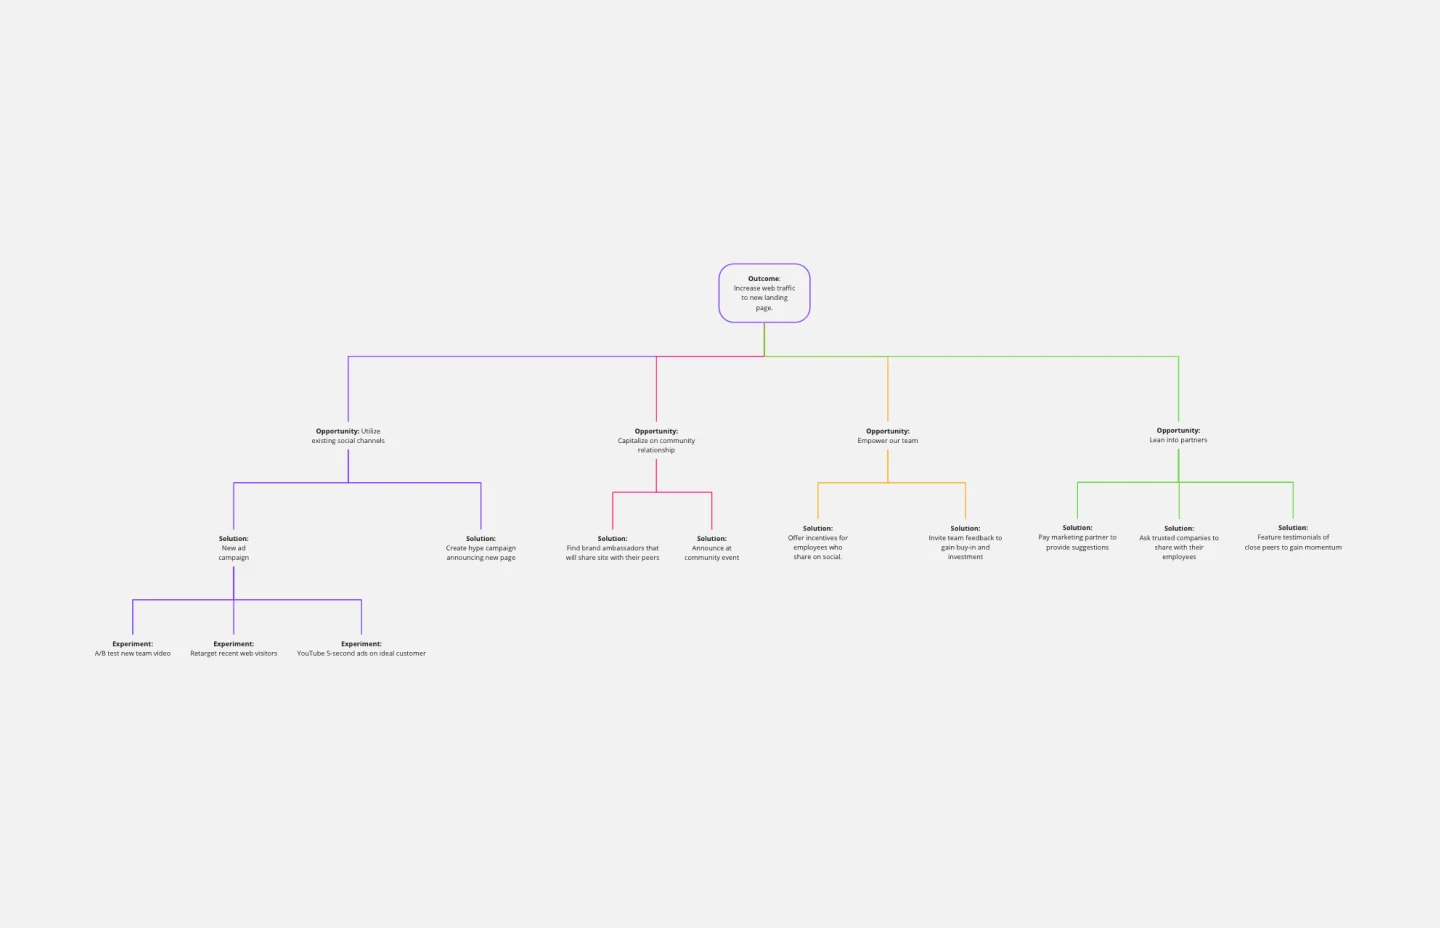
Opportunity Solution Tree Template
Solving problems — successful companies and productive teams just know how to do it. They’re able to identify many possible solutions, then settle on the one that leads to the desired outcome. That’s the power an Opportunity Solution Tree gives you. Designed by Teresa Torres, a product discovery coach, this mind map breaks down your desired outcome into opportunities for the product to meet user needs, then gives your team an effective way to brainstorm potential solutions.
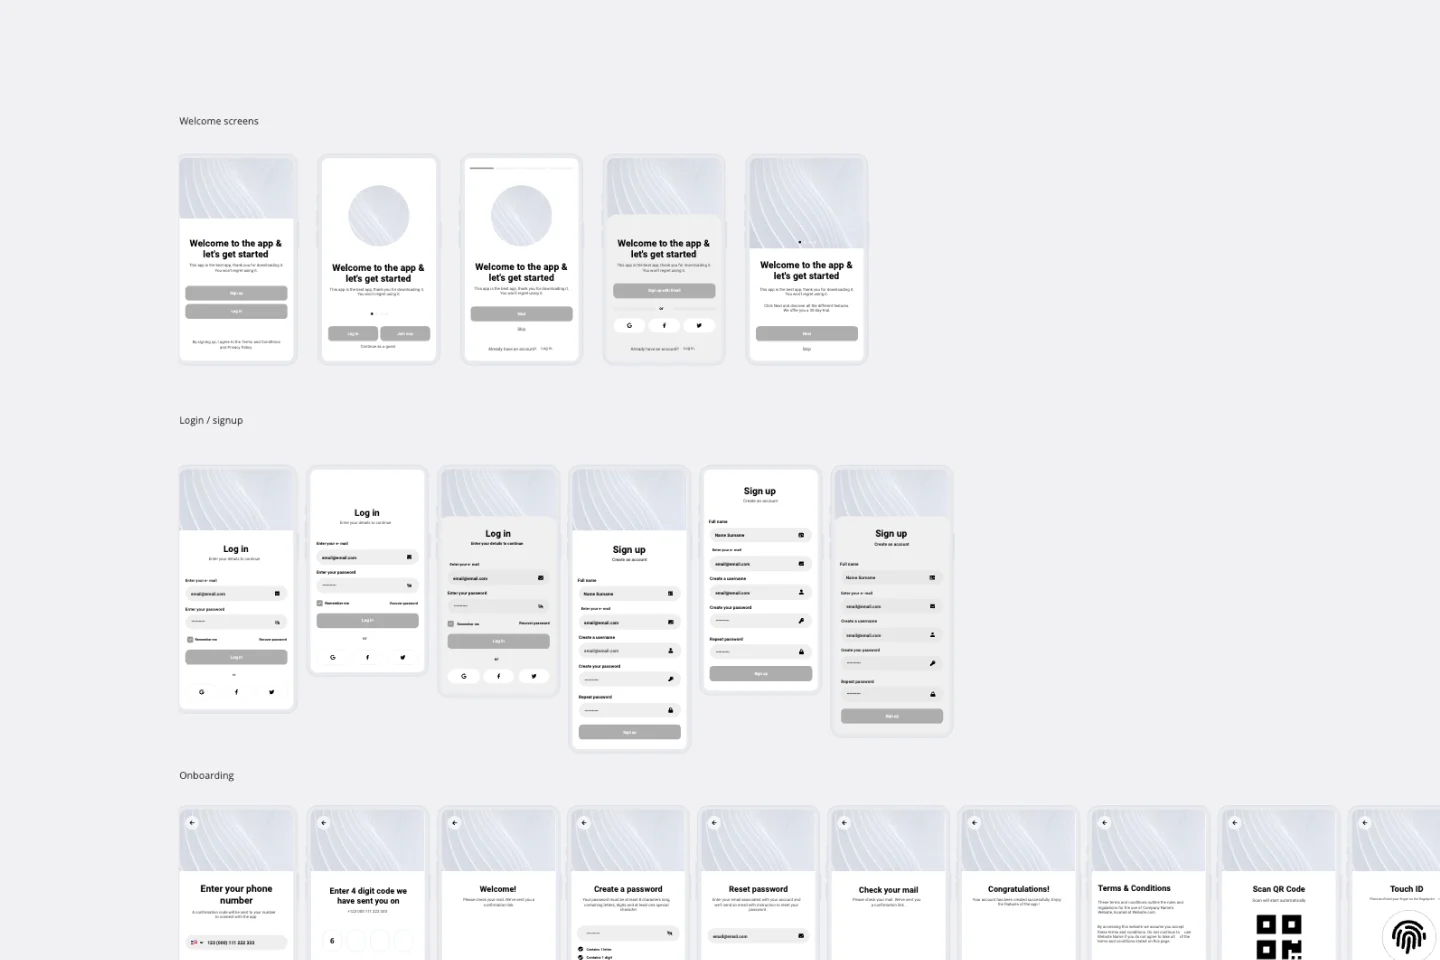
App Wireframe Template
Ready to start building an app? Don’t just imagine how it will function and how users will interact with it—let a wireframe show you. Wireframing is a technique for creating a basic layout of each screen. When you wireframe, ideally early in the process, you’ll gain an understanding of what each screen will accomplish and get buy-in from important stakeholders—all before adding the design and content, which will save you time and money. And by thinking of things in terms of a user’s journey, you’ll deliver a more compelling, successful experience.
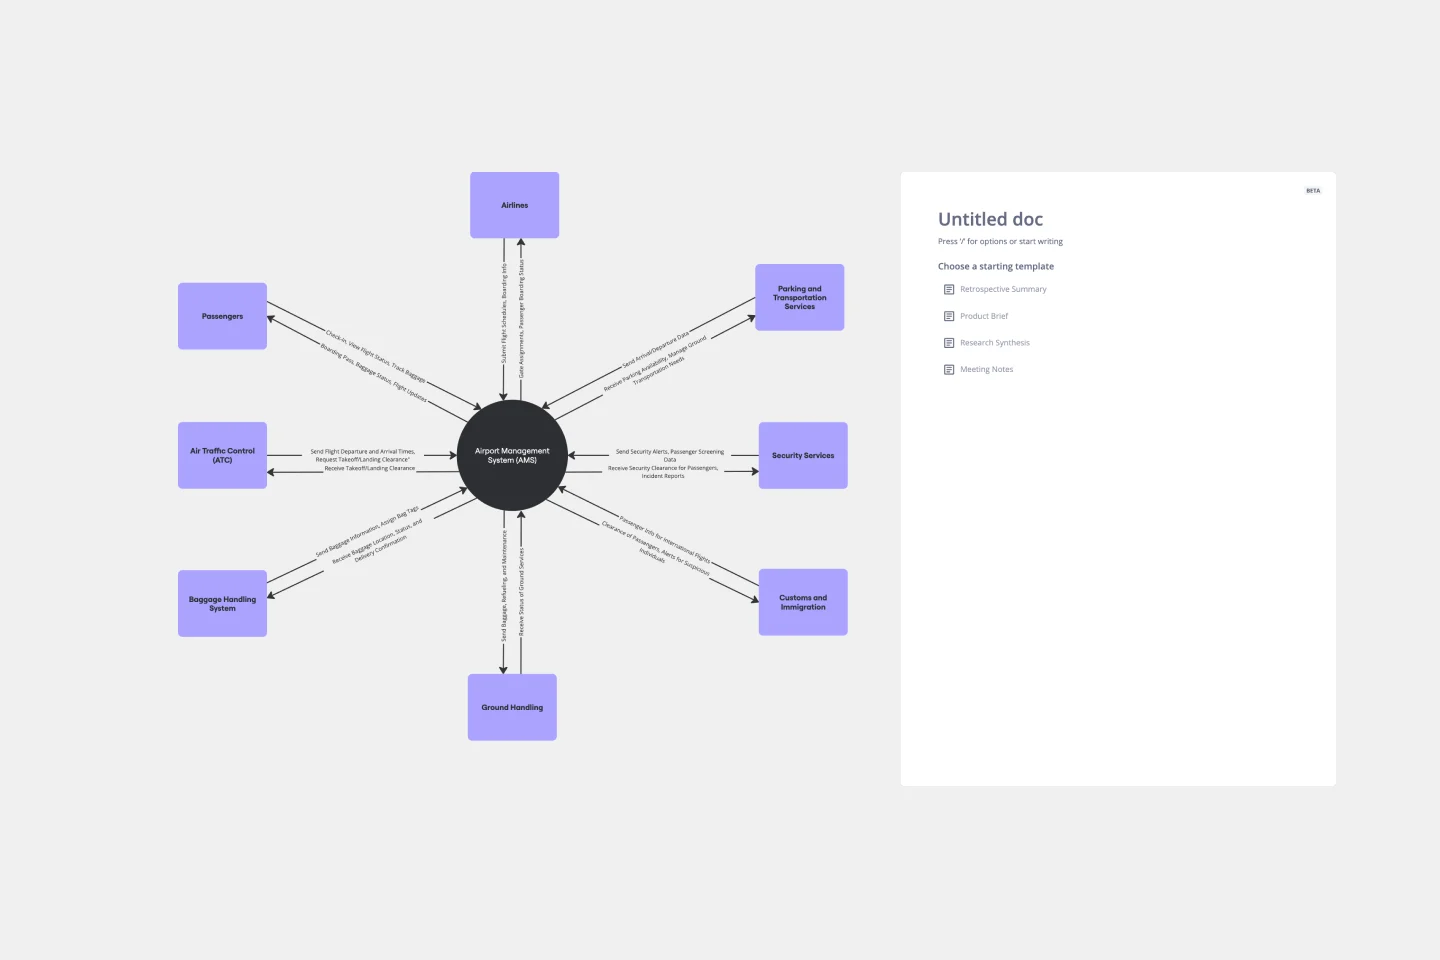
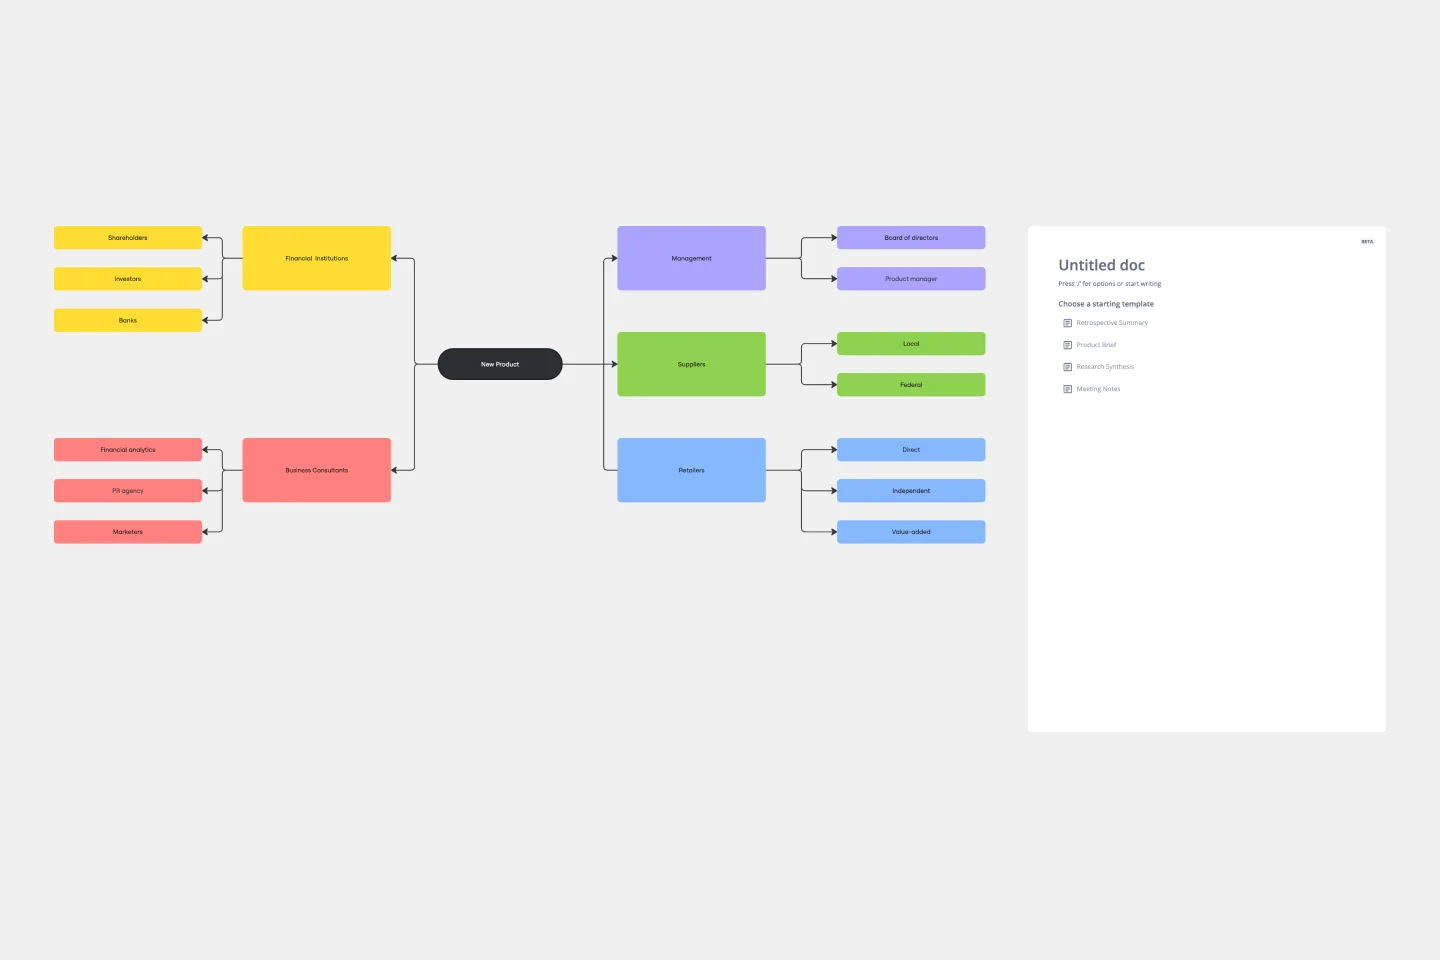
Context Diagram Template
A context diagram is a perfect tool to view an entire system as a single process and understand how external factors interact with it. These external factors can include customers, developers, management, and more. The Context Diagram Template is your tool for creating this diagram.
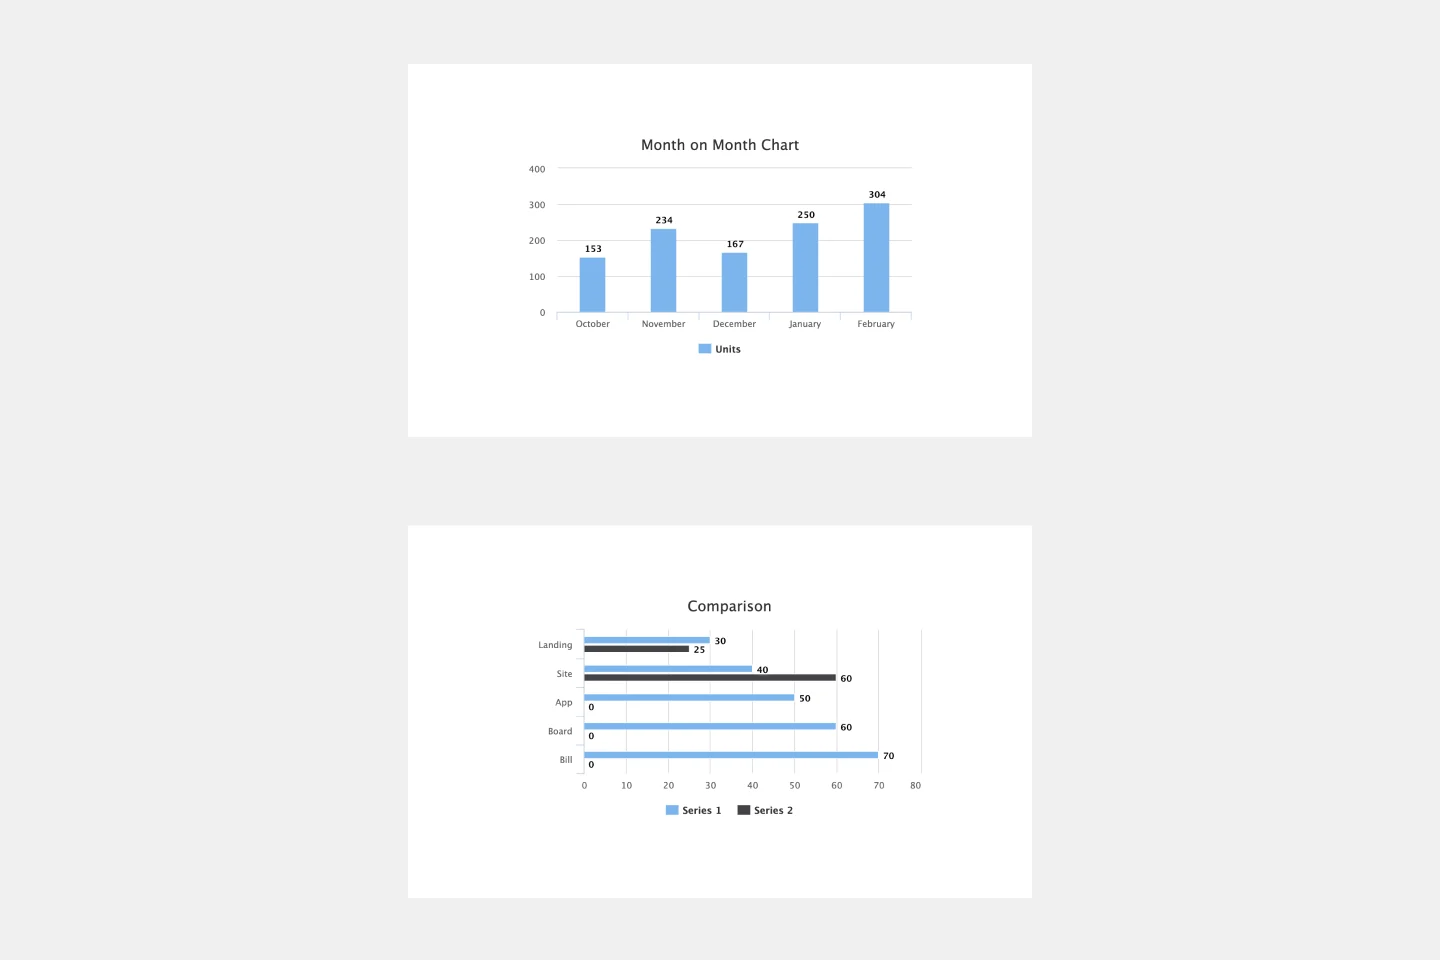
Bar Graph Template
Bar graphs are an excellent way to compare different types of categories and datasets visually. Many professionals use this type of graph to support their presentations and make data storytelling more understandable. With just a few clicks, use this bar graph template and customize it according to your needs.
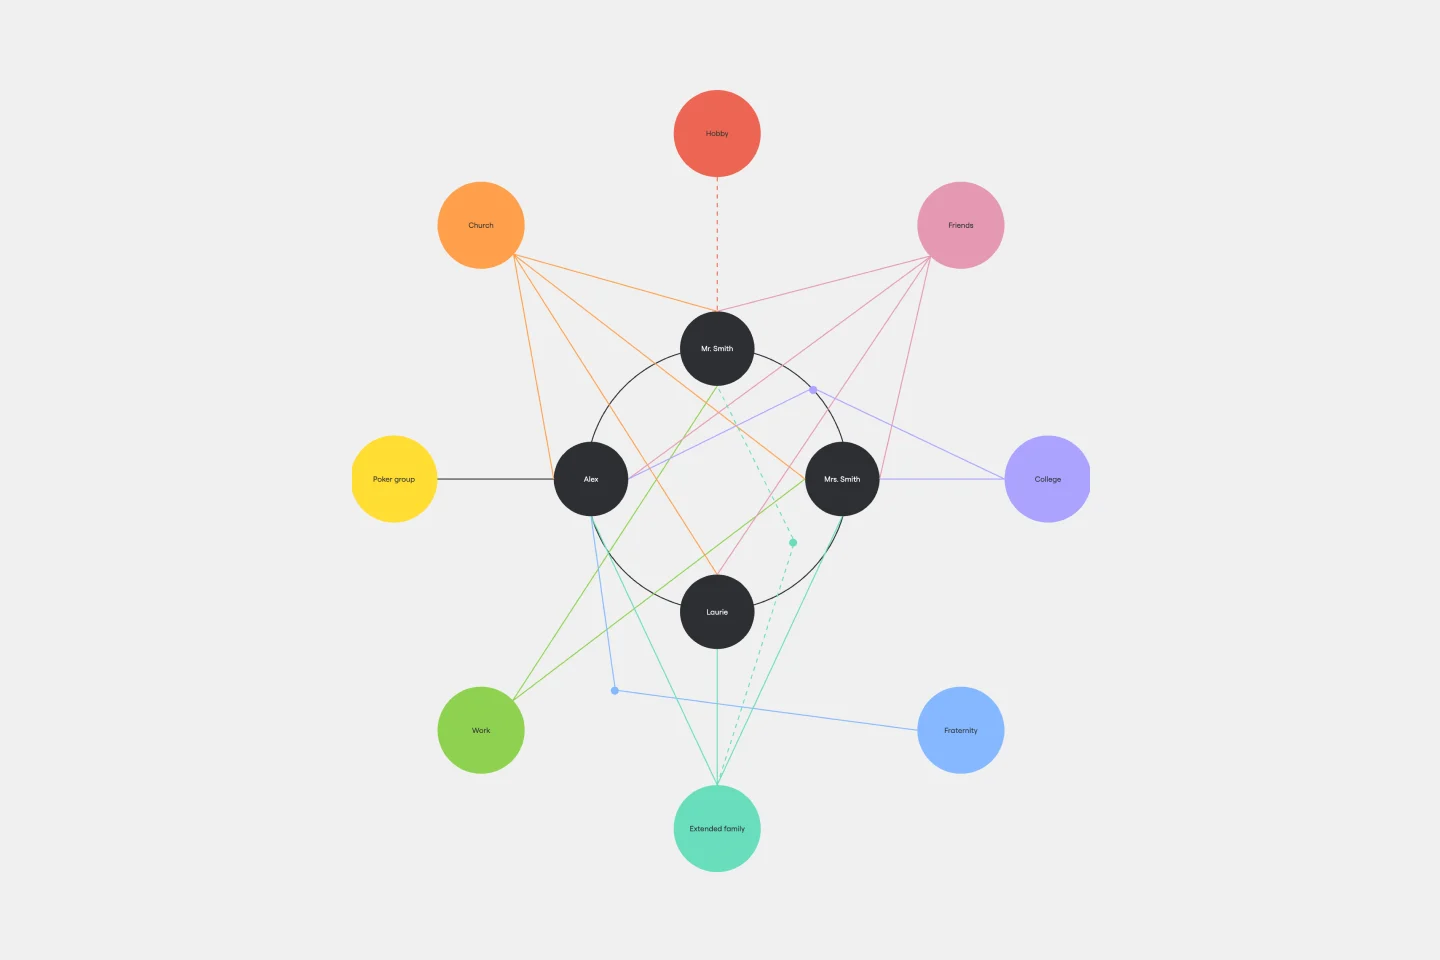
Ecomap Template
The Ecomap Template illustrates the multifaceted relationships and environmental interactions encircling an individual or entity. Determine crucial patterns and dynamics by providing a clear and comprehensive visualization of how different systems intertwine and influence each other.
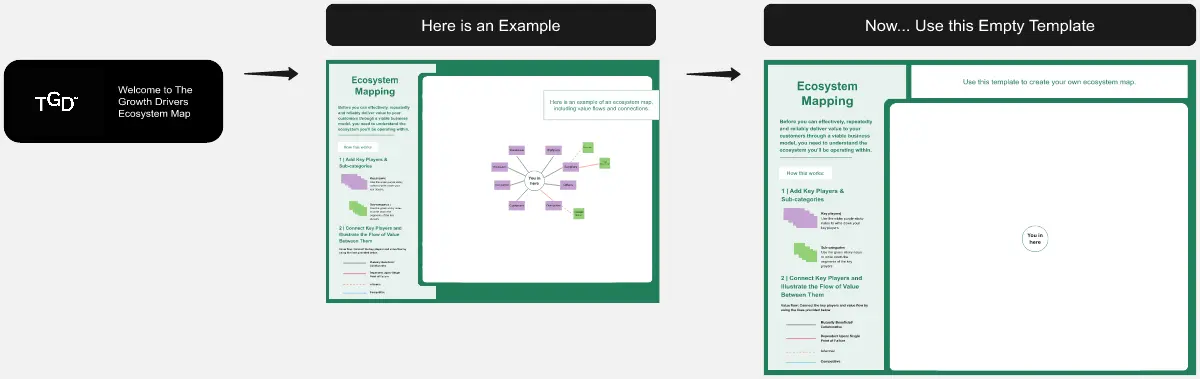
Ecosystem Map
Advocate for a customer-centric approach with this Ecosystem Mapping Template. Understand your organization’s ecosystem holistically through customer advocacy.
Stakeholder Mapping Template
A stakeholder map is a type of analysis that allows you to group people by their power and interest. Use this template to organize all of the people who have an interest in your product, project, or idea in a single visual space. This allows you to easily see who can influence your project, and how each person is related to the other. Widely used in project management, stakeholder mapping is typically performed at the beginning of a project. Doing stakeholder mapping early on will help prevent miscommunication, ensure all groups are aligned on the objectives and set expectations about outcomes and results.
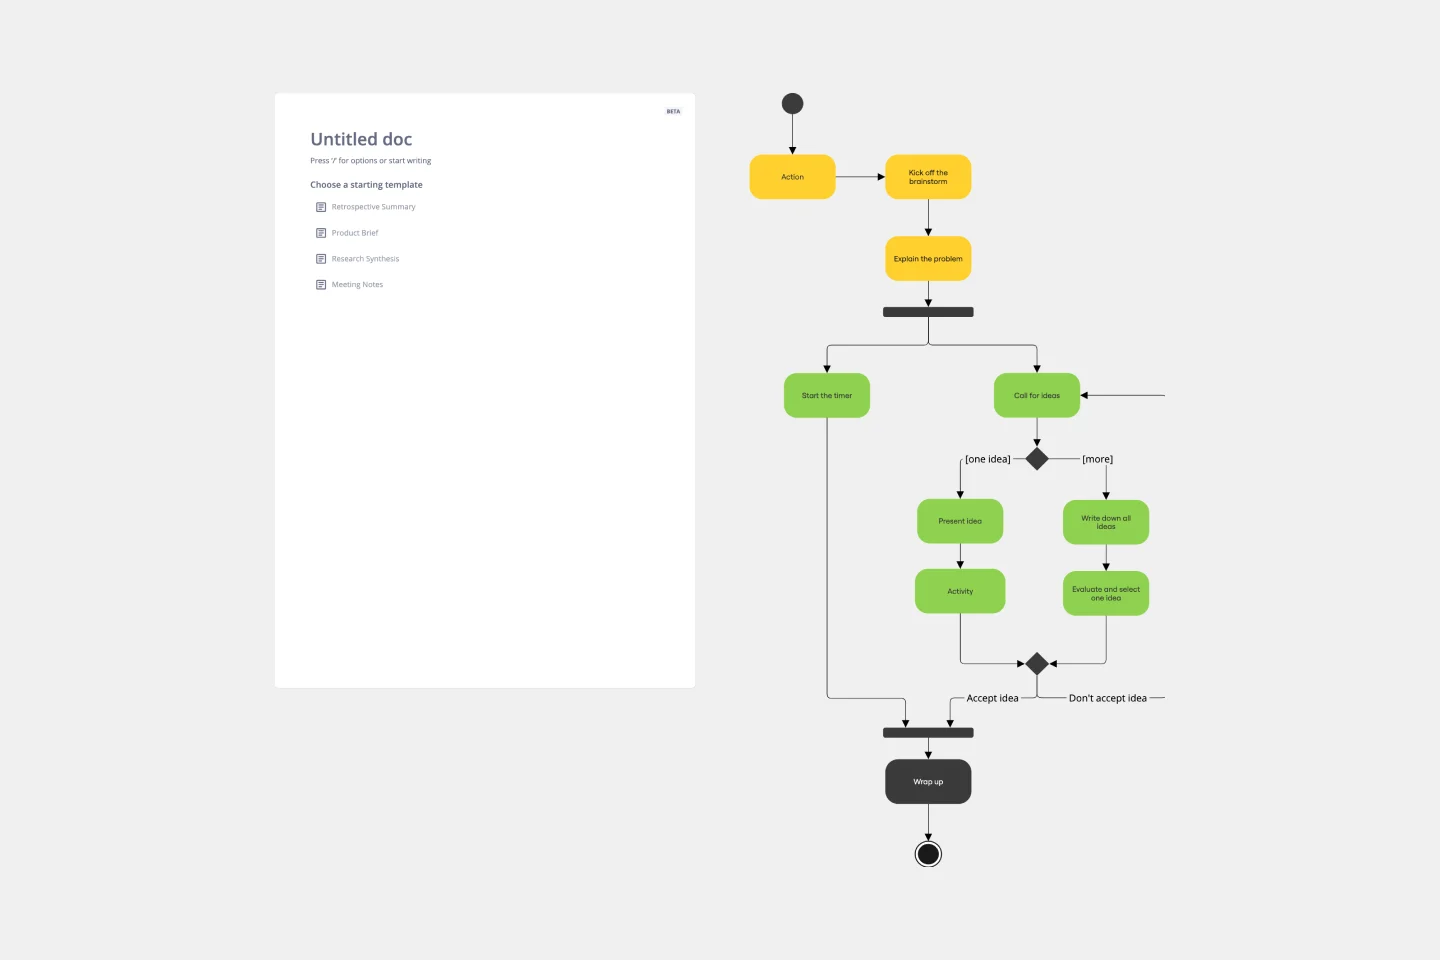
UML Activity Diagram Template
Use our Activity Diagram template to break down activities into smaller decisions and subprocesses. Improve and optimize systems and processes in I.T., business management, and more.
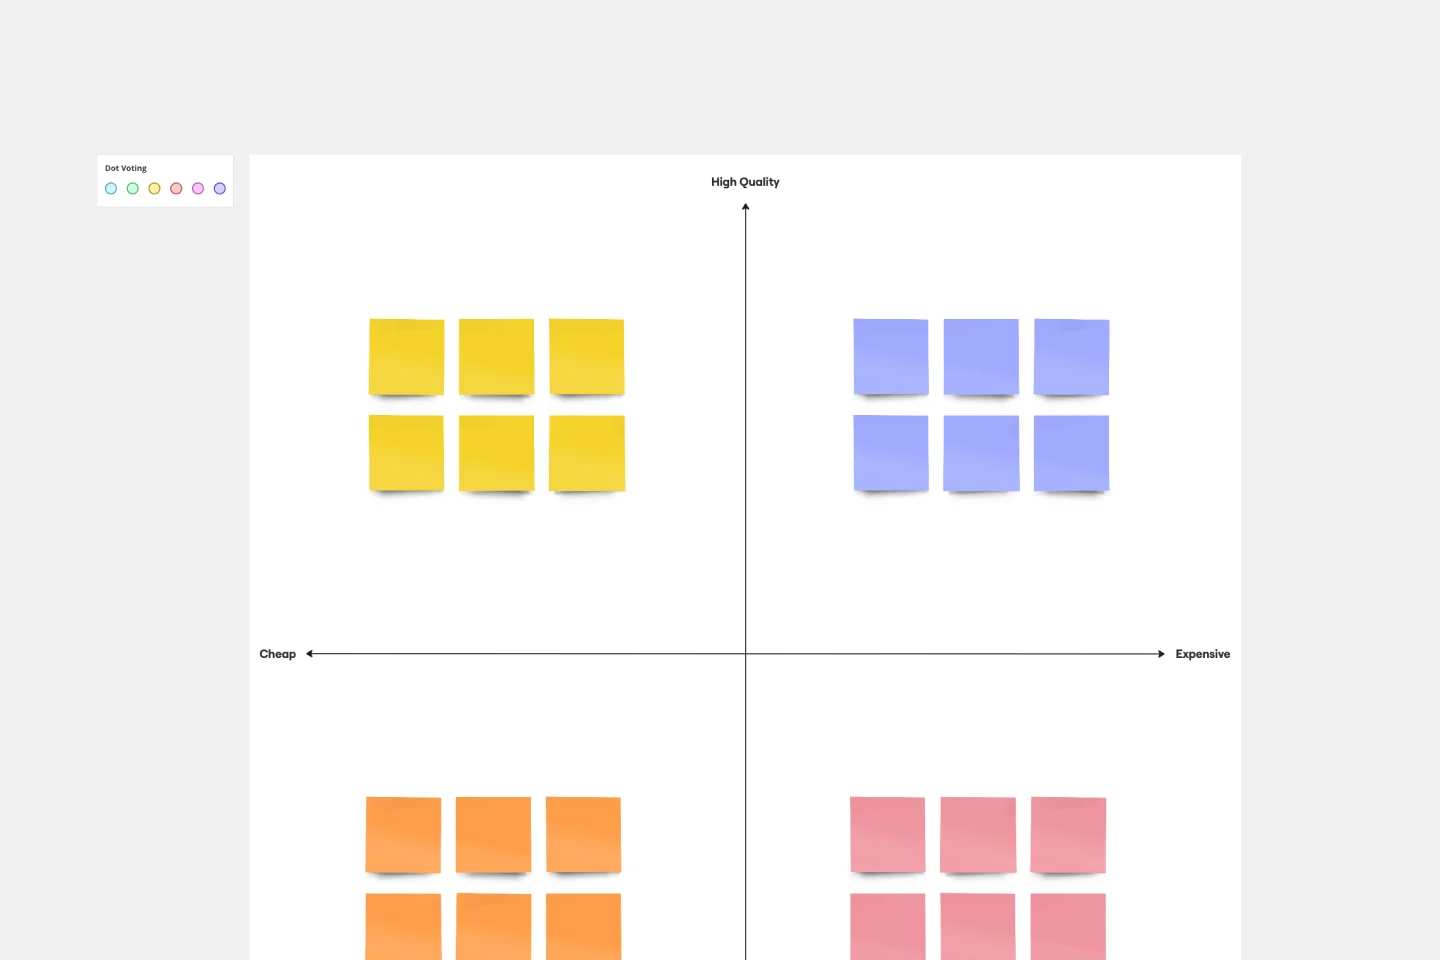
Perceptual Map Template
To shape your messaging, tailor your marketing, improve your product, and build your brand, you have to know your customers’ perceptions — what they think of you and your competitors. You can gain those insights by exploring a perceptual map. This simple, powerful tool creates a visual representation of how customers rank your price, performance, safety, and reliability. Put this template to work and you’ll be able to size up your competition, see gaps in the market, and understand changes in customer behavior and purchasing decisions.
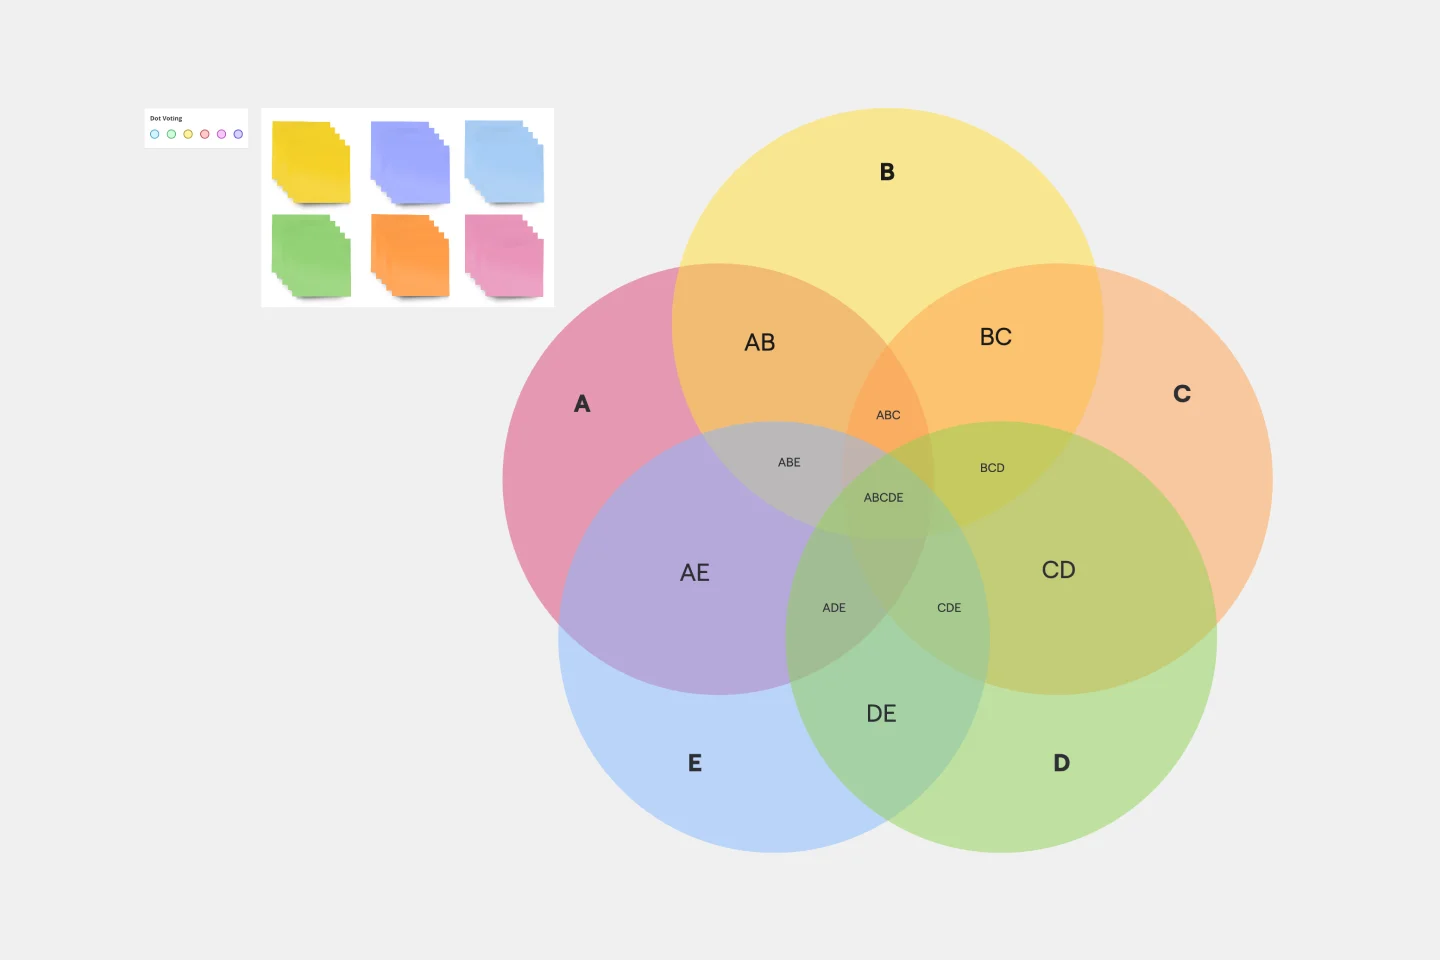
5-Circle Venn Diagram Template
Discover how Miro's 5 Circle Venn Diagram Template can simplify complex decision-making processes. Learn how to create, customize, and share your diagrams for effective visual collaboration. Transform brainstorming sessions with real time, remote teamwork.
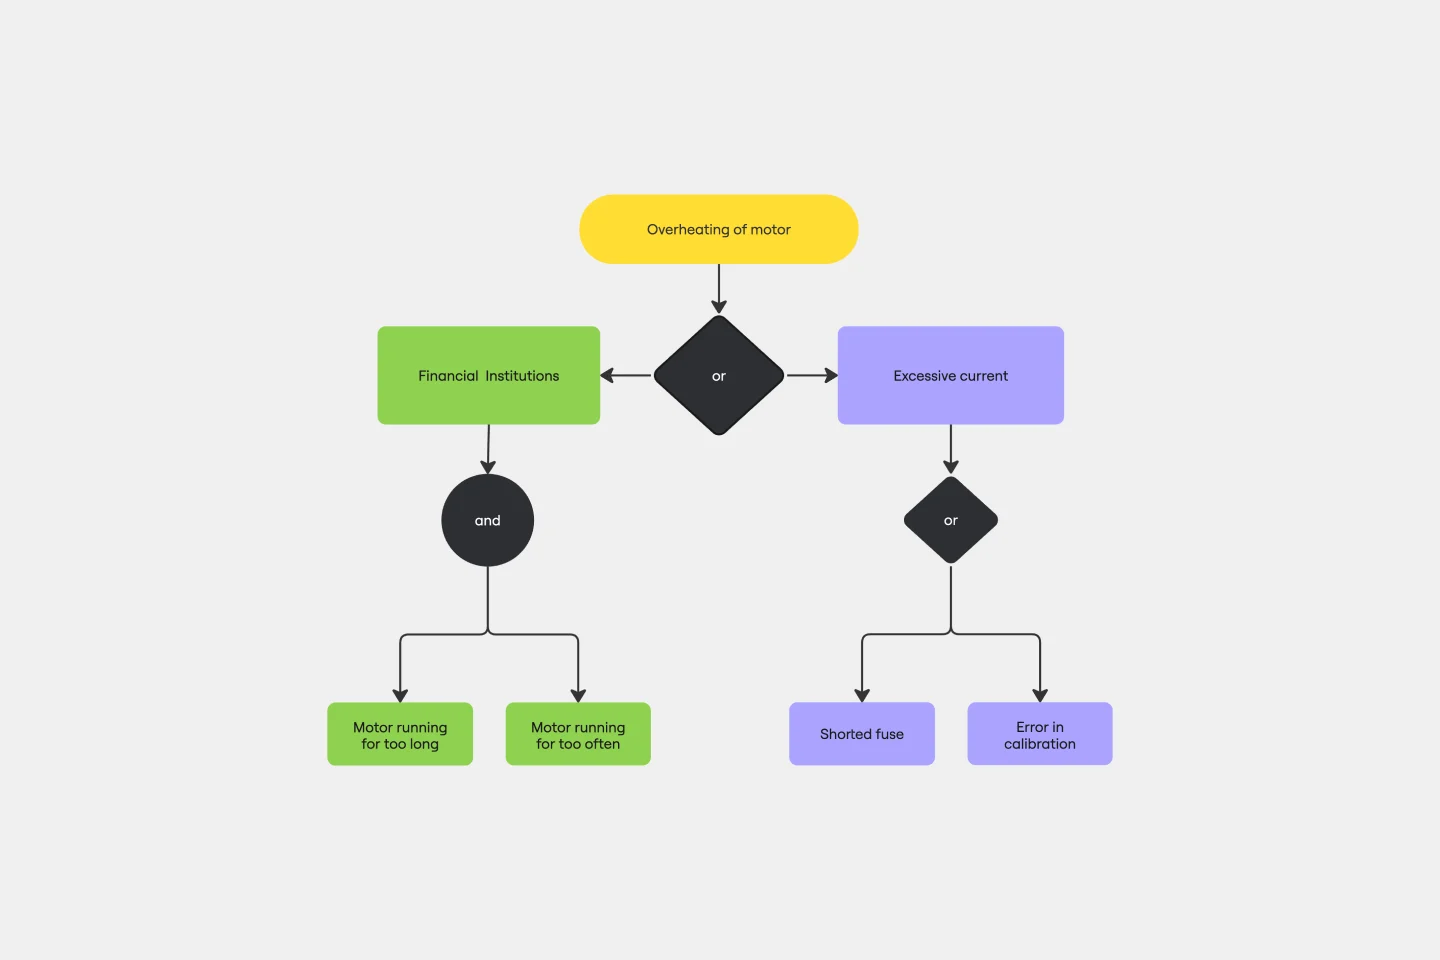
Fault Tree Analysis Template
The Fault Tree Analysis Template visually breaks down potential system malfunctions, highlighting complex causal relationships between faults. One of its standout benefits is its ability to enhance clarity in complex scenarios, allowing professionals to swiftly pinpoint root causes and prioritize interventions, ensuring a more streamlined approach to problem-solving.
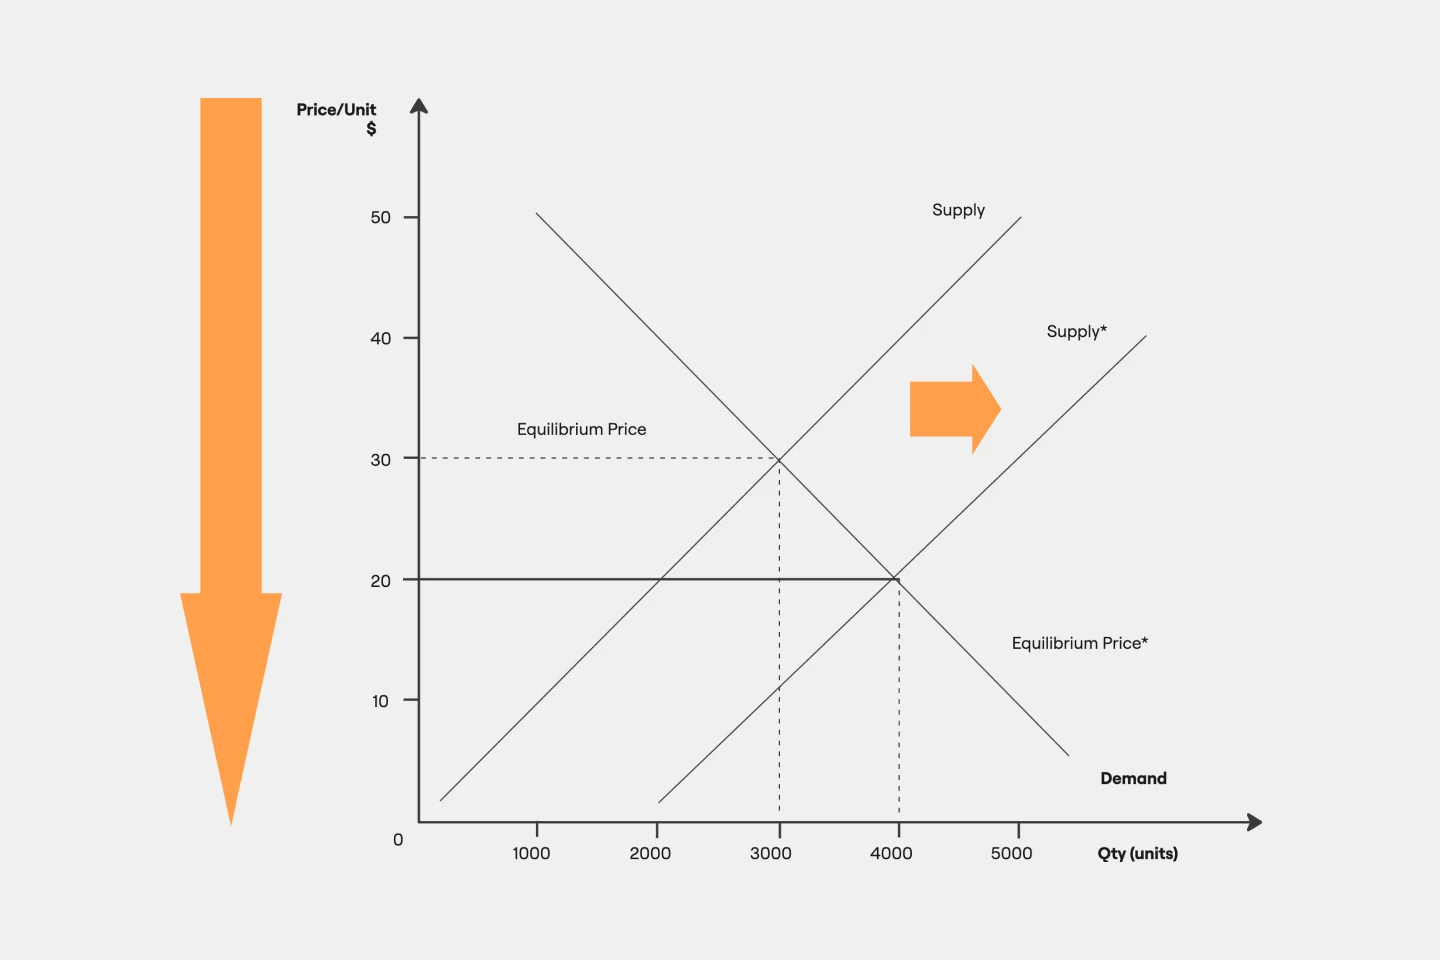
Supply and Demand Graph Template
How do you price your product so that you make a profit while keeping customers and manufacturers happy? By finding a fair price. A supply and demand diagram is a graph that visualizes how much demand there is for your product and how many products you need. This, in turn, helps you with product pricing.
Lotus Diagram Template
Even creative thinkers occasionally need help getting their creative juices flowing. That's where a lotus diagram comes in. It'll empower you to run smoother, more effective brainstorming sessions. This creative-thinking technique explores ideas by putting the main idea at the diagram center and ancillary concepts in the surrounding boxes. This template gives you an easy way to create Lotus Diagrams for brainstorms, as well as an infinite canvas for the endless ideas generated.
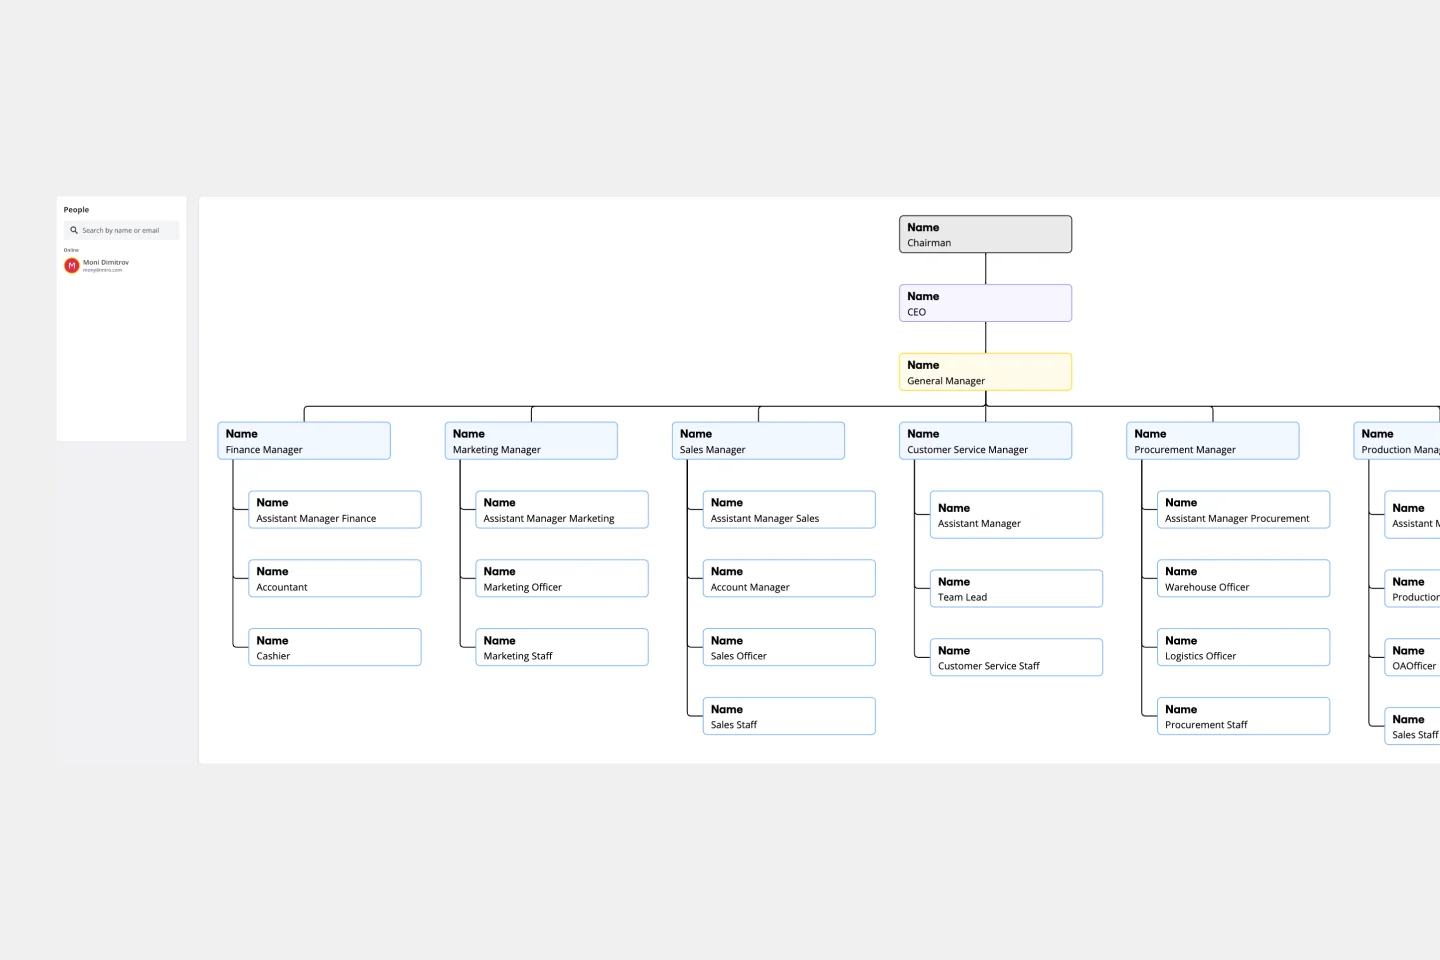
Vertical Organizational Chart
The Vertical Organizational Chart Template is an efficient way to illustrate the hierarchy of an entity in a top-down format. This tool helps represent roles and relationships in a clear manner, starting from the topmost authority and branching downwards. It allows for a better understanding of the flow of responsibilities and communication channels within the organization. One of its most significant advantages is promoting clear communication. Depicting the organization's structure helps avoid misunderstandings and ensures everyone is on the same page regarding the chain of command.
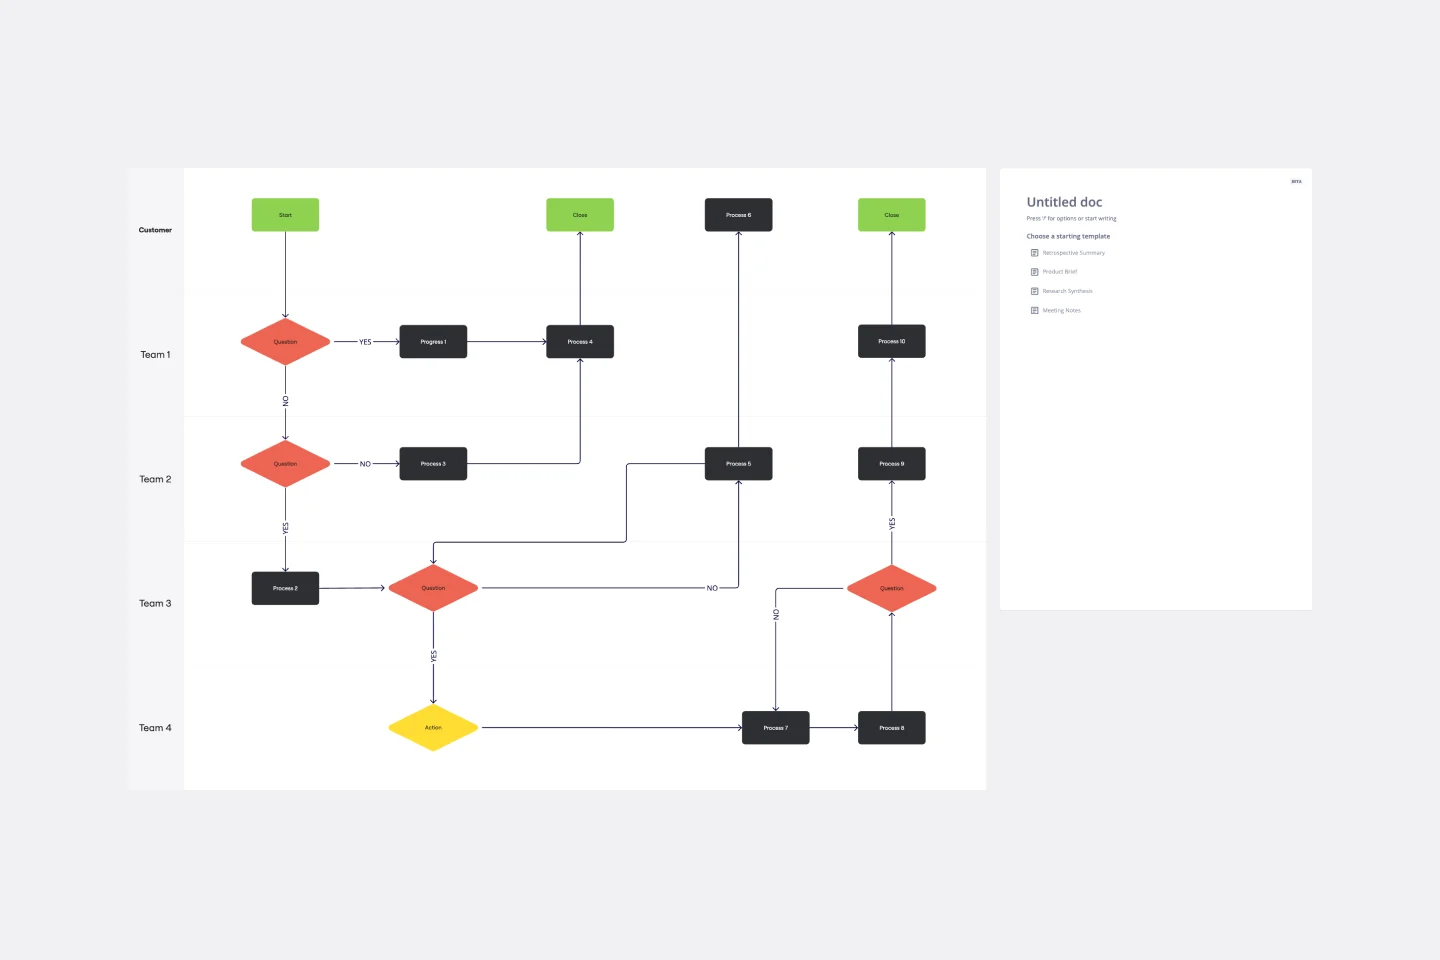
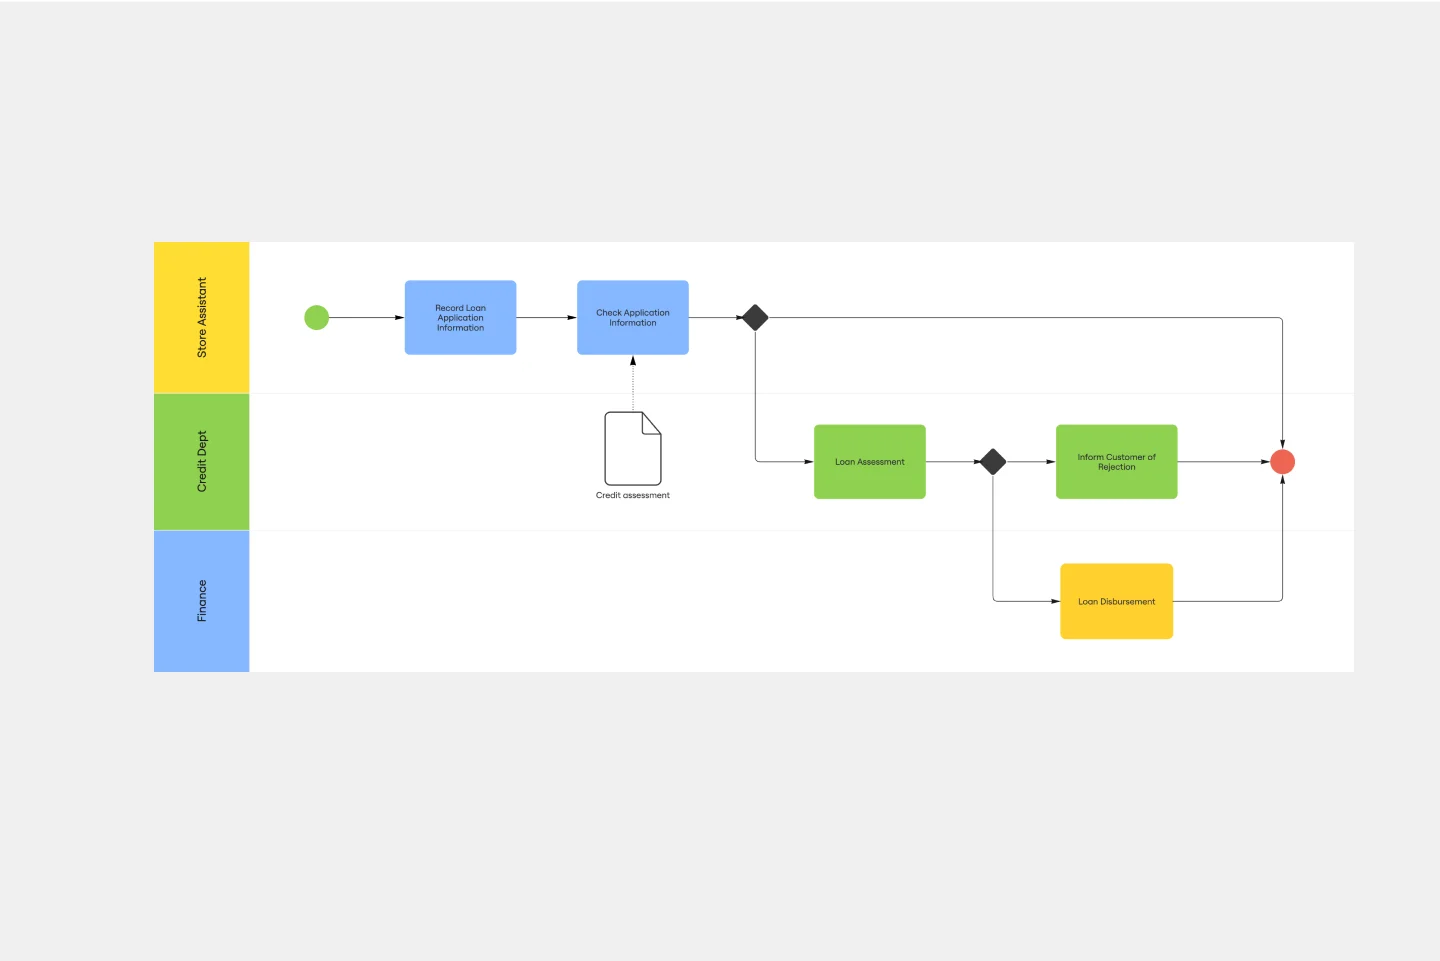
Cross Functional Flowchart
Have a quick look at everyone on a project and see exactly what they’ll contribute. That’s the clarity and transparency a cross-functional flowchart will give you. These are also called “swim lane” flowcharts because each person (each customer, client, or representative from a specific function) is assigned a lane—a clear line—that will help you visualize their roles at each stage of the project. This template will empower you to streamline processes, reduce inefficiencies, and make meaningful cross-functional relationships.
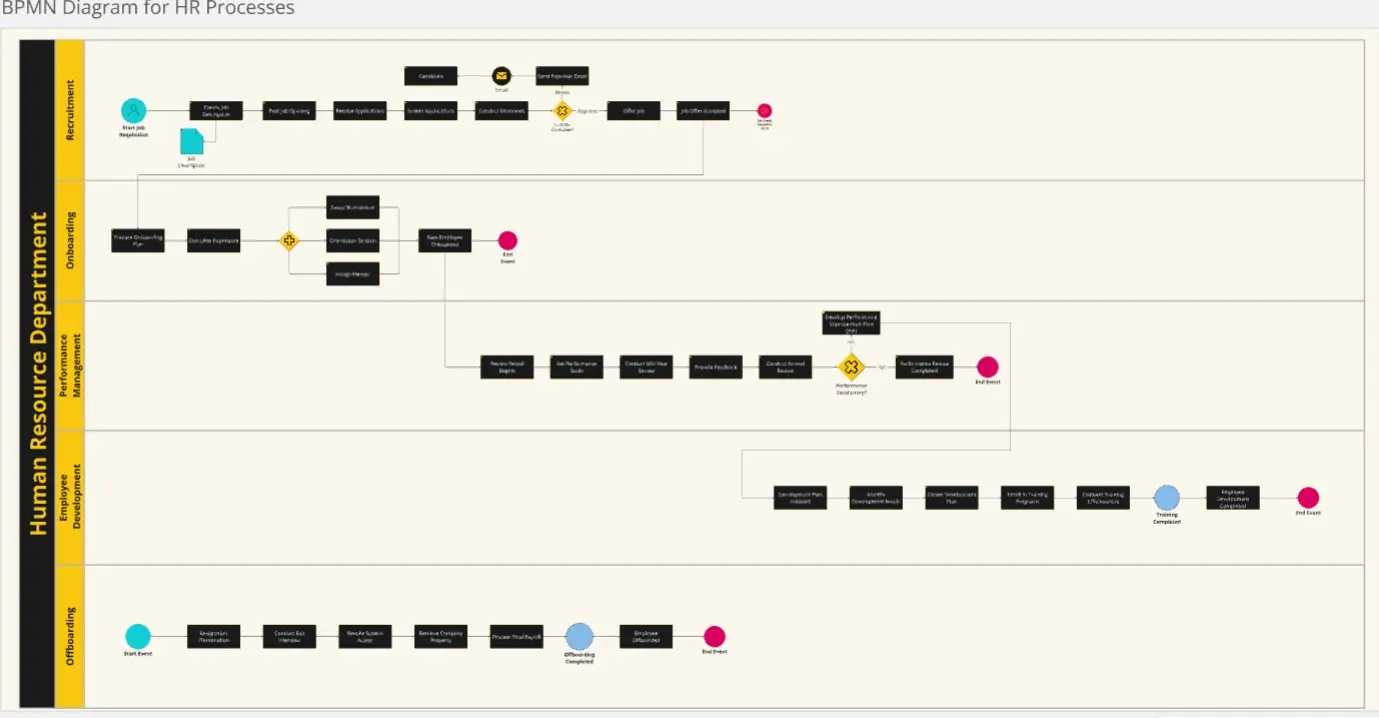
BPMN Diagram for HR Processes
The BPMN Diagram for HR Processes template provides a clear map of each stage in the HR lifecycle, from recruitment to offboarding. It helps HR teams visualize and optimize processes, enhance compliance, and improve efficiency. Perfect for HR managers aiming to streamline workflows, ensure consistency, and provide a seamless experience for employees throughout their career journey.
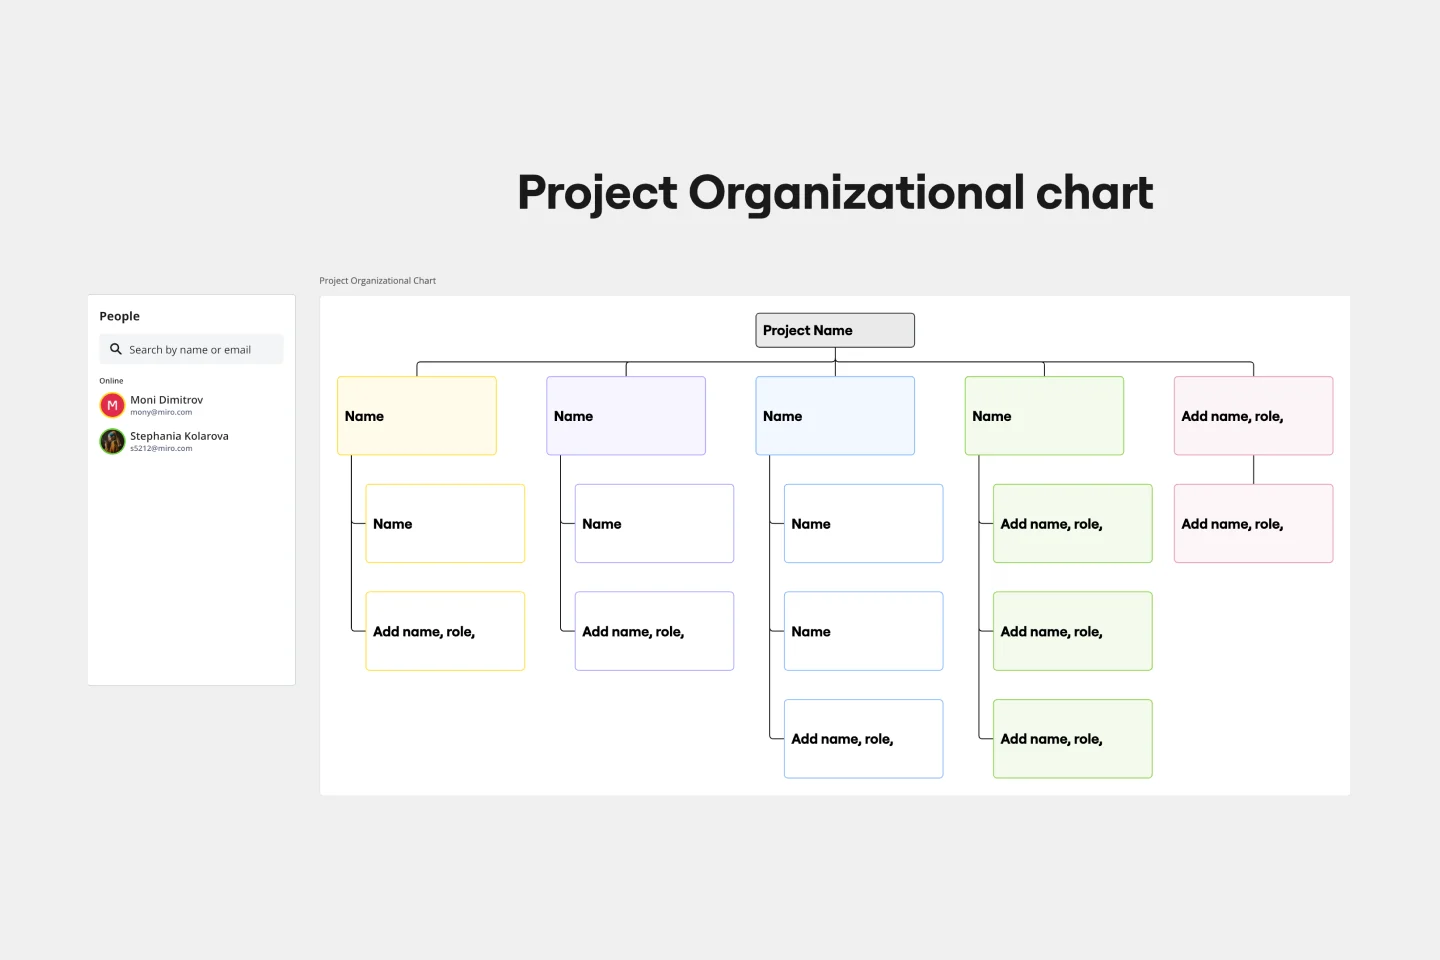
Project Organizational Chart Template
When you’re embarking on a long, complex project, you will inevitably hit roadblocks and obstacles. It’s important to have your project organizational chart on hand to overcome those challenges. A project organizational chart is a visual diagram that illustrates who is on your team and the role they play in a given project. It documents the structure of the project organization, the hierarchy between team members, and the relationships between employees. Project organizational charts are useful tools for clarifying who does what, securing buy-in, and setting expectations for the group.
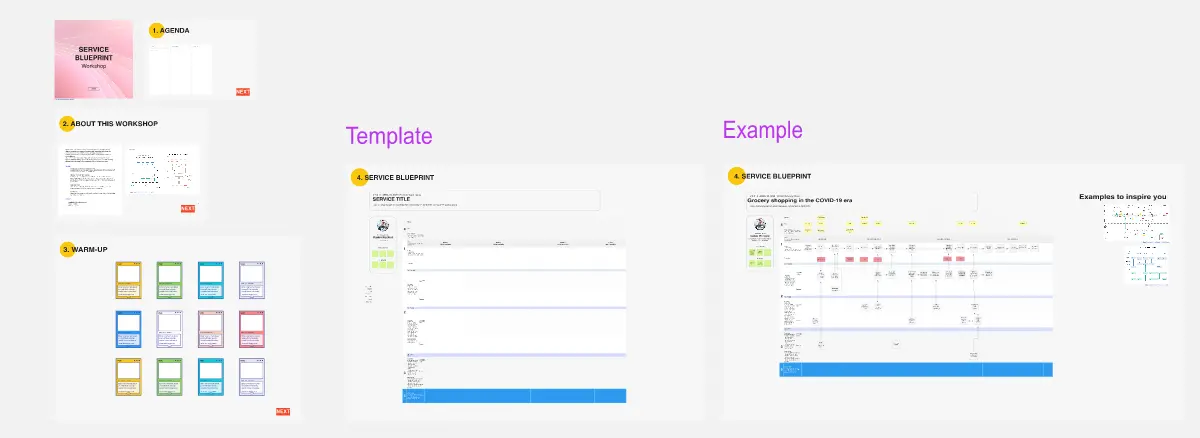
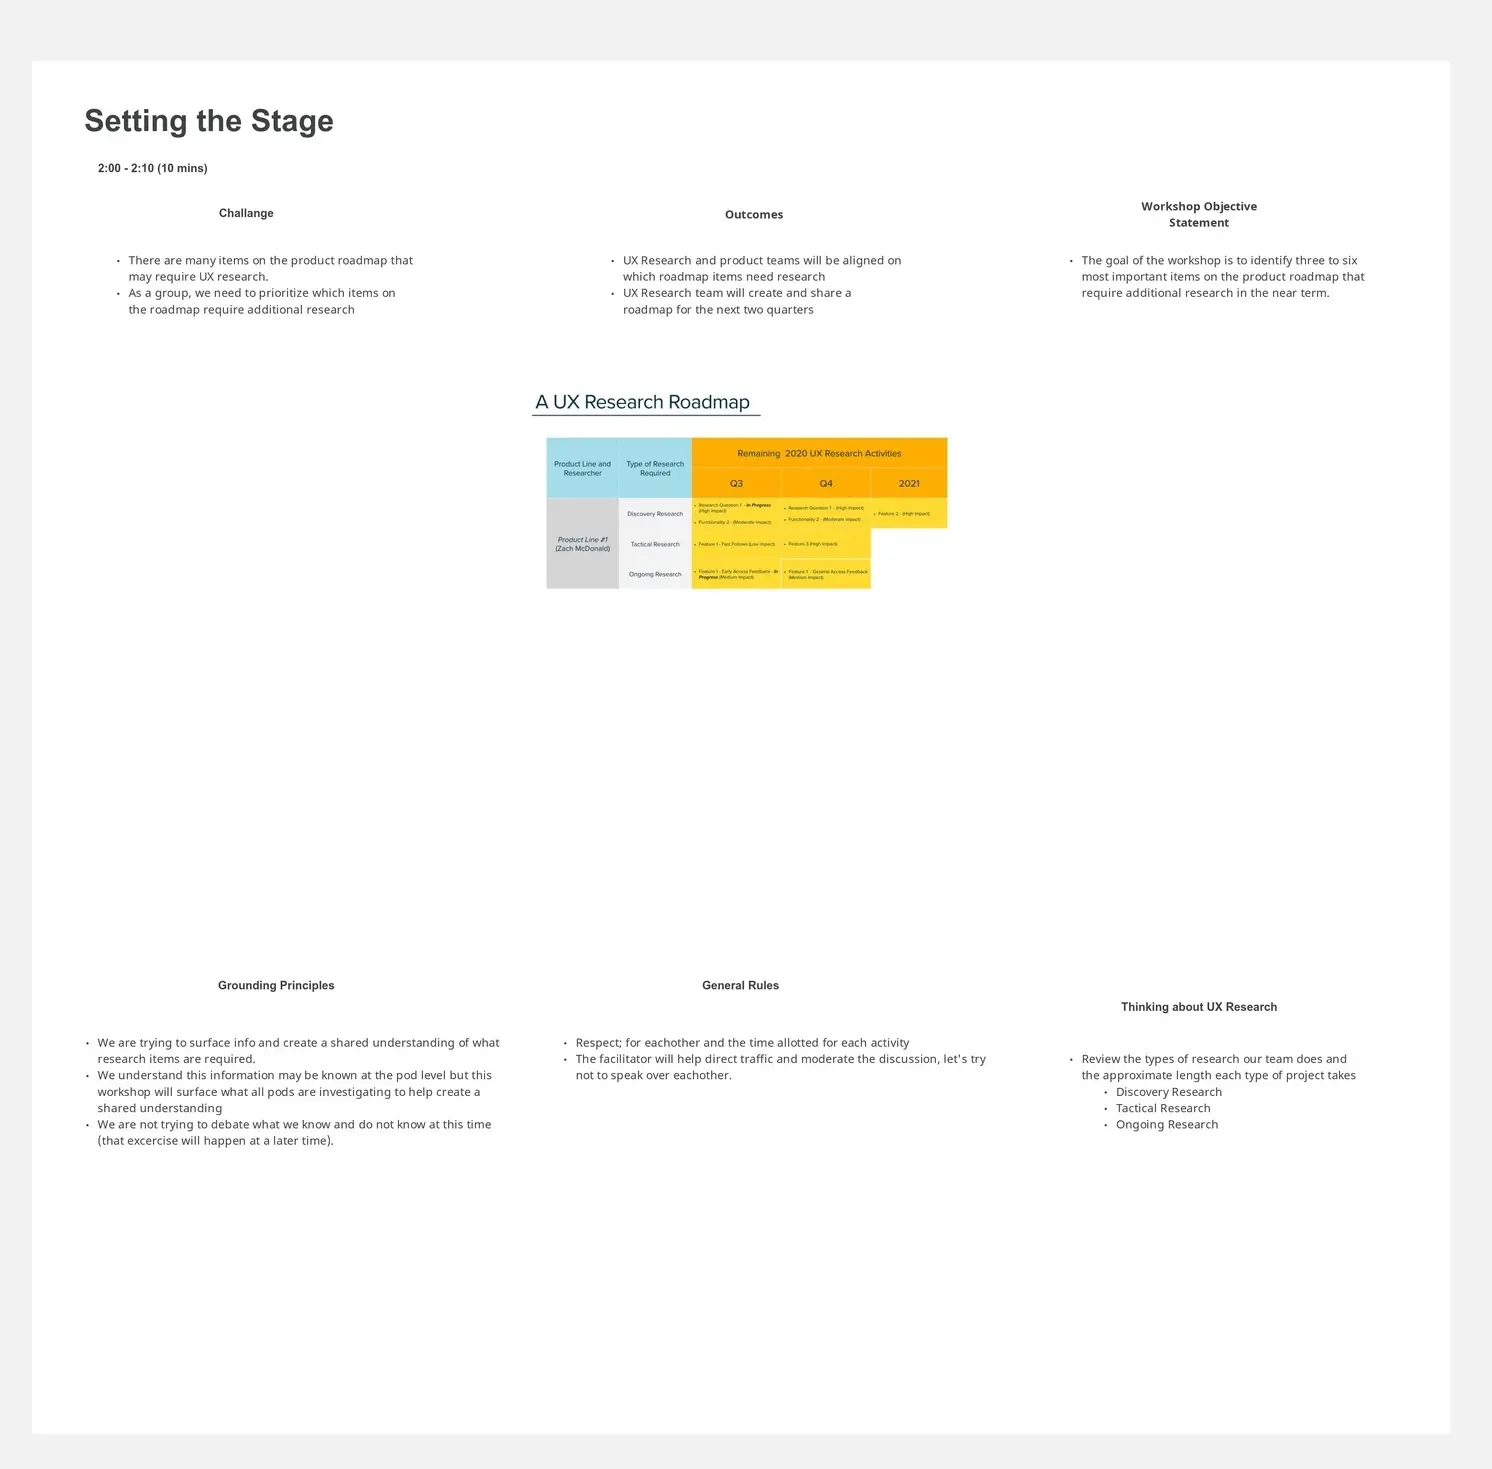
Service Blueprint Workshop
The Service Blueprint Workshop by Lidia Olszewska is designed for collaborative service design sessions. This template helps teams visualize service processes, identify pain points, and brainstorm solutions. Use it to align cross-functional teams, improve service delivery, and ensure a seamless customer experience. It's ideal for workshops aimed at service optimization, fostering collaboration, and strategic planning in service design.
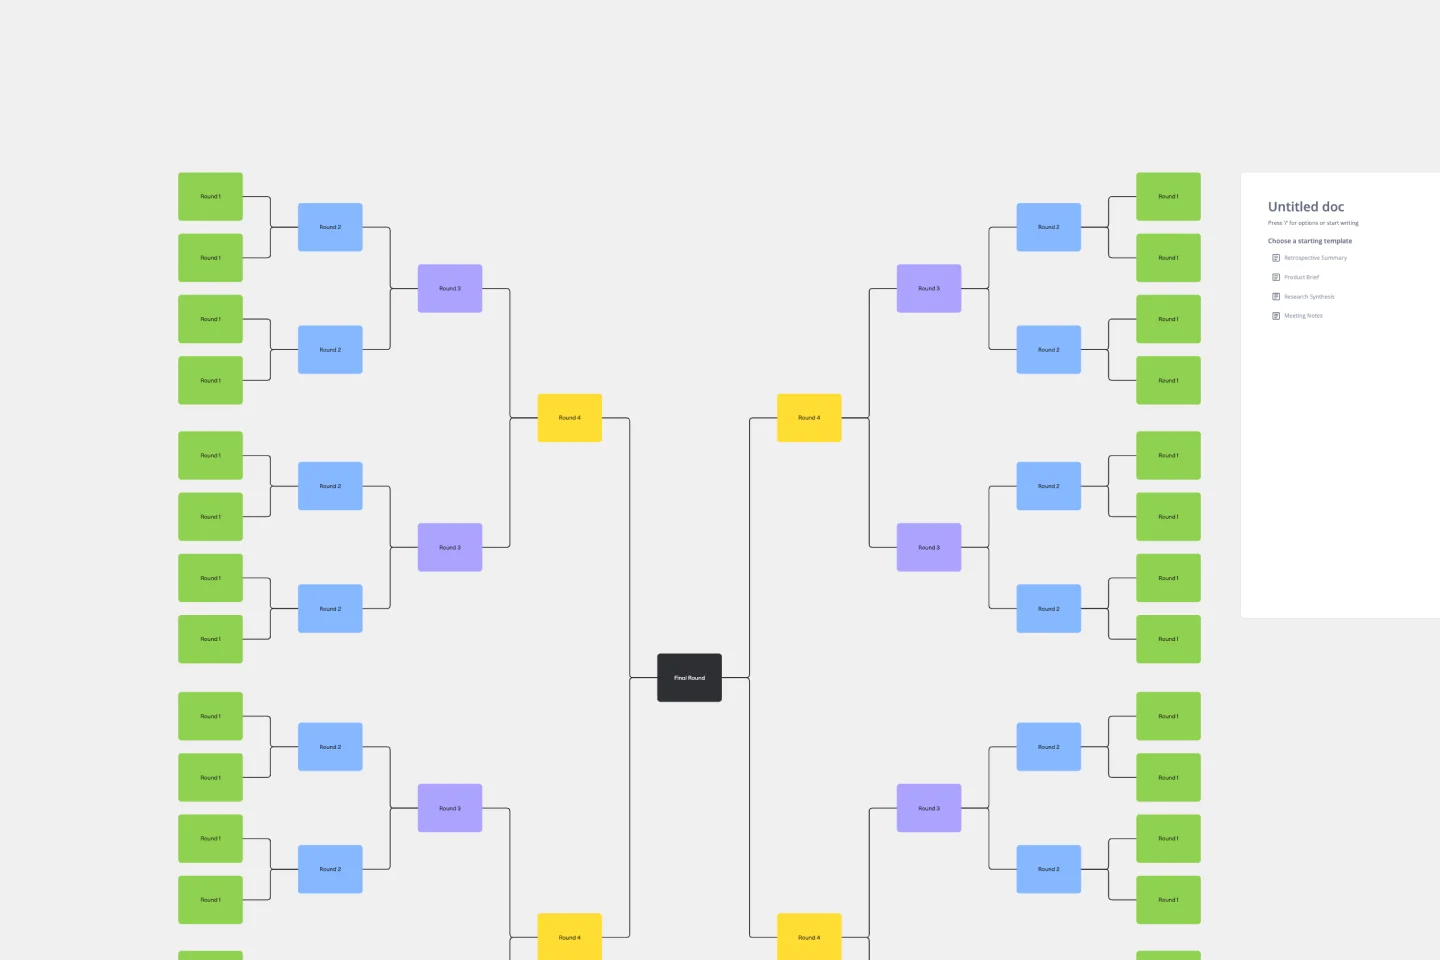
Bracket Template
The Bracket Template is a dynamic visualization tool that helps to organize and rank ideas, entities, or teams in a sequential and competitive manner. It is structured like a tree, starting with multiple entries on either side, which then face off in successive rounds, leading to a single winner or conclusion. One of its standout benefits is its ability to simplify complex decision-making processes. Breaking down choices into smaller, head-to-head comparisons, makes the path to a final decision clearer, ensuring clarity and fostering engagement among participants. Moreover, the Bracket Template is particularly useful when there are multiple options to consider and when there is a need to compare and contrast those options. It is an effective way to streamline decision-making, making it easier and more efficient.
Miro's mapping and diagramming templates collection is designed to streamline the process of creating visual representations of complex information. Whether you're mapping out a customer journey, designing a flowchart, or creating a mind map, Miro offers a wide range of templates to suit your needs. These templates are crafted to help you start quickly and collaborate effectively with your team, ensuring that everyone is on the same page from the get-go.
Using Miro's mapping and diagramming templates comes with numerous benefits:
Ease of use: Start diagramming from scratch or choose from a variety of pre-made templates. The intuitive tools and frameworks make it easy to create professional diagrams without any prior experience.
Collaboration: Share your diagrams with teammates and collaborate in real time. Discuss, refine, and iterate directly on the board, making the process seamless and efficient.
Versatility: The templates cater to various needs, from customer journey maps to technical diagrams, ensuring that you have the right tool for any project.
Efficiency: Save time with ready-to-use templates that can be customized to fit your specific requirements. This allows you to focus more on the content rather than the design.
Export and presentation: Once your diagram is ready, easily export it in various formats for presentations or further use.
Choose a template: Browse through the collection or use the search bar to find a specific template that fits your needs. Click on the template to preview it.
Customize the template: Modify the template to suit your project. Add or remove elements, change colors, and insert text to make it your own.
Collaborate with your team: Share the board with your team members. Use Miro's collaboration features to work together in real time, leaving comments and suggestions directly on the board.
Finish and export: Once your diagram is complete, use the export options to save it in your preferred format. You can also present it directly from Miro using the presentation.
Use advanced features: Take advantage of Miro's advanced diagramming features such as smart diagramming tools, which include workflows for methodologies like Business Process Modeling Notation (BPMN), Unified Modeling Language (UML), Data Flow Diagrams (DFD), and Entity Relationship Diagrams (ERD). These tools can help you create more sophisticated and detailed diagrams.
Incorporate integrations: Enhance your diagrams by integrating Miro with other services. Explore the Miro Marketplace to find apps that can enrich your diagramming experience, such as importing diagrams from other tools or exporting your Miro diagrams to different formats.
Leverage shape libraries: Use the extensive shape libraries available in Miro. These libraries are organized into logical categories, making it easy to find the right shapes for your diagrams. You can also switch types of shapes and customize them to fit your needs.
Embed and share: Once your diagram is complete, you can embed it directly into your company's documentation or share it with stakeholders. Miro's sharing options make it easy to collaborate and get feedback from your team.
Miro's mapping and diagramming templates are designed to help teams visualize complex information, streamline workflows, and enhance collaboration. By using these templates, teams can save time, improve efficiency, and create professional diagrams that facilitate better understanding and decision-making. With Miro, your team can thrive by turning ideas into actionable plans and achieving your goals together.