About the Website Flowchart Template
A website flowchart (also known as a sitemap) maps out the structure and complexity of your current or future website.
A well-structured sitemap or flowchart makes your website easily searchable. Each piece of content should ideally give users accurate search results, based on keywords connected to your web content.
Product, UX, and content teams use flowcharts or sitemaps to understand everything contained in a website, and plan to add or restructure content to improve a website’s user experience.
Keep reading to learn more about website flowcharts.
What is a website flowchart?
A website flowchart can be used as a planning tool to help organize and clarify existing content, and get rid of unnecessary or duplicate content. The flowchart also helps your team identify knowledge gaps for future content.
Website flowcharts help you stay focused on your user and your goals when working on website projects, from website launches, audits, or redesigns.
Ideally, your users shouldn’t be confused when navigating your website (whether it’s their first time or a returning visit), or interacting with any of your content. Website flowcharts help you spot areas of friction or dead-end points across user flows.
Create your own website flowchart
Making your own website flowchart is easy and Miro is the perfect flowchart creator. Get started by selecting the Website Flowchart Template, then take the following steps to make one of your own.
1. Clarify your website’s purpose and goals
Websites should be focused and easy to navigate. Ask your team to articulate your website’s high-level goals and purpose on sticky notes. These can be broken down into specific, color-coded goals for each webpage. Your sitemap should help you determine whether every page on your website truly reinforces your goals.
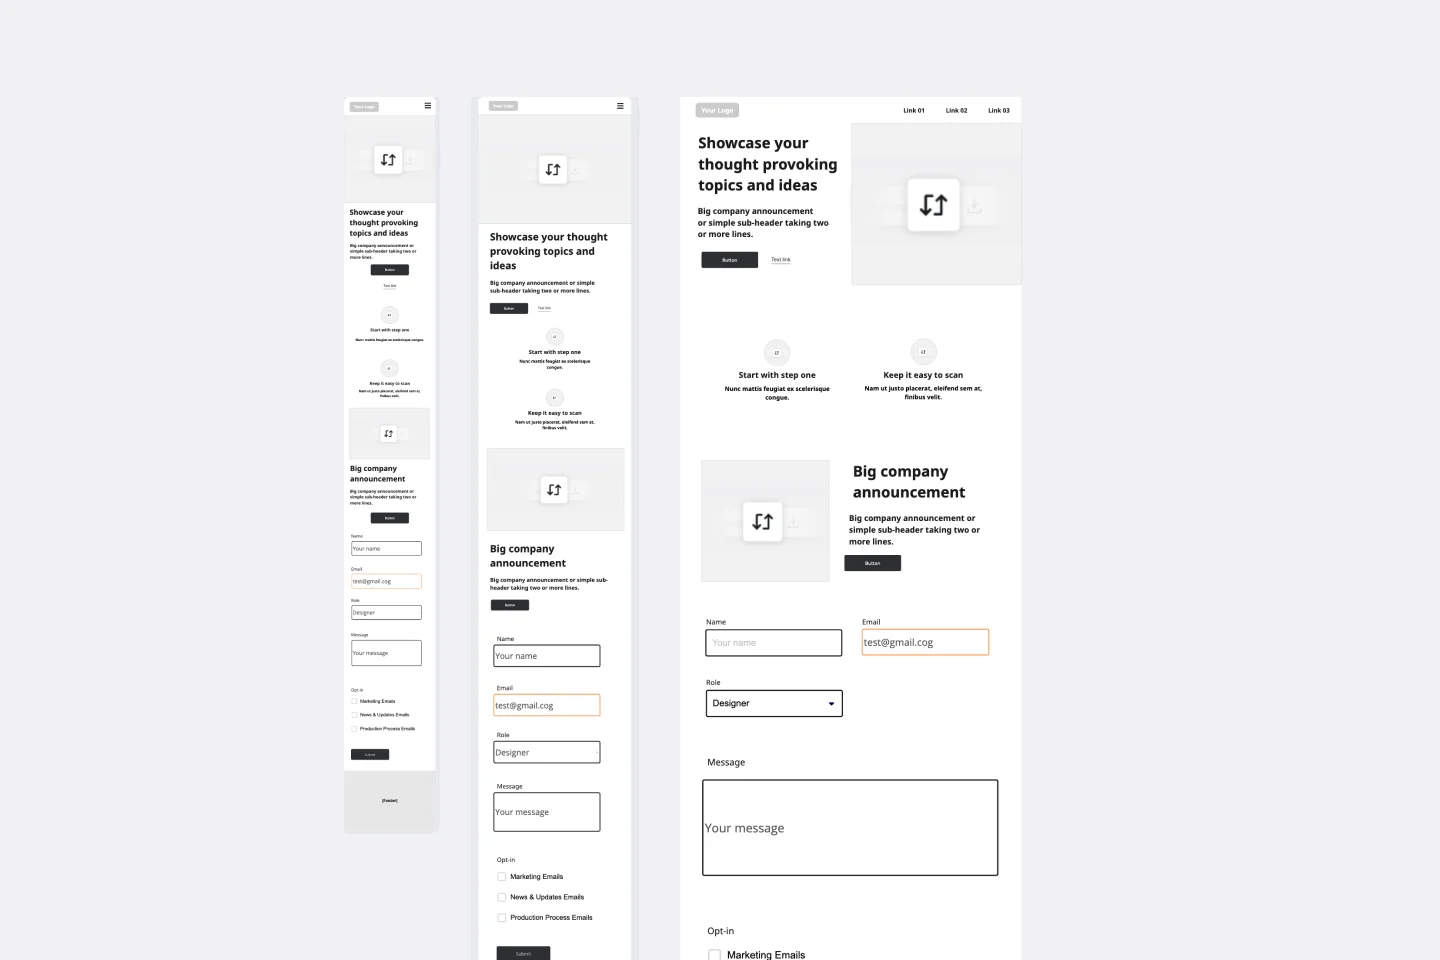
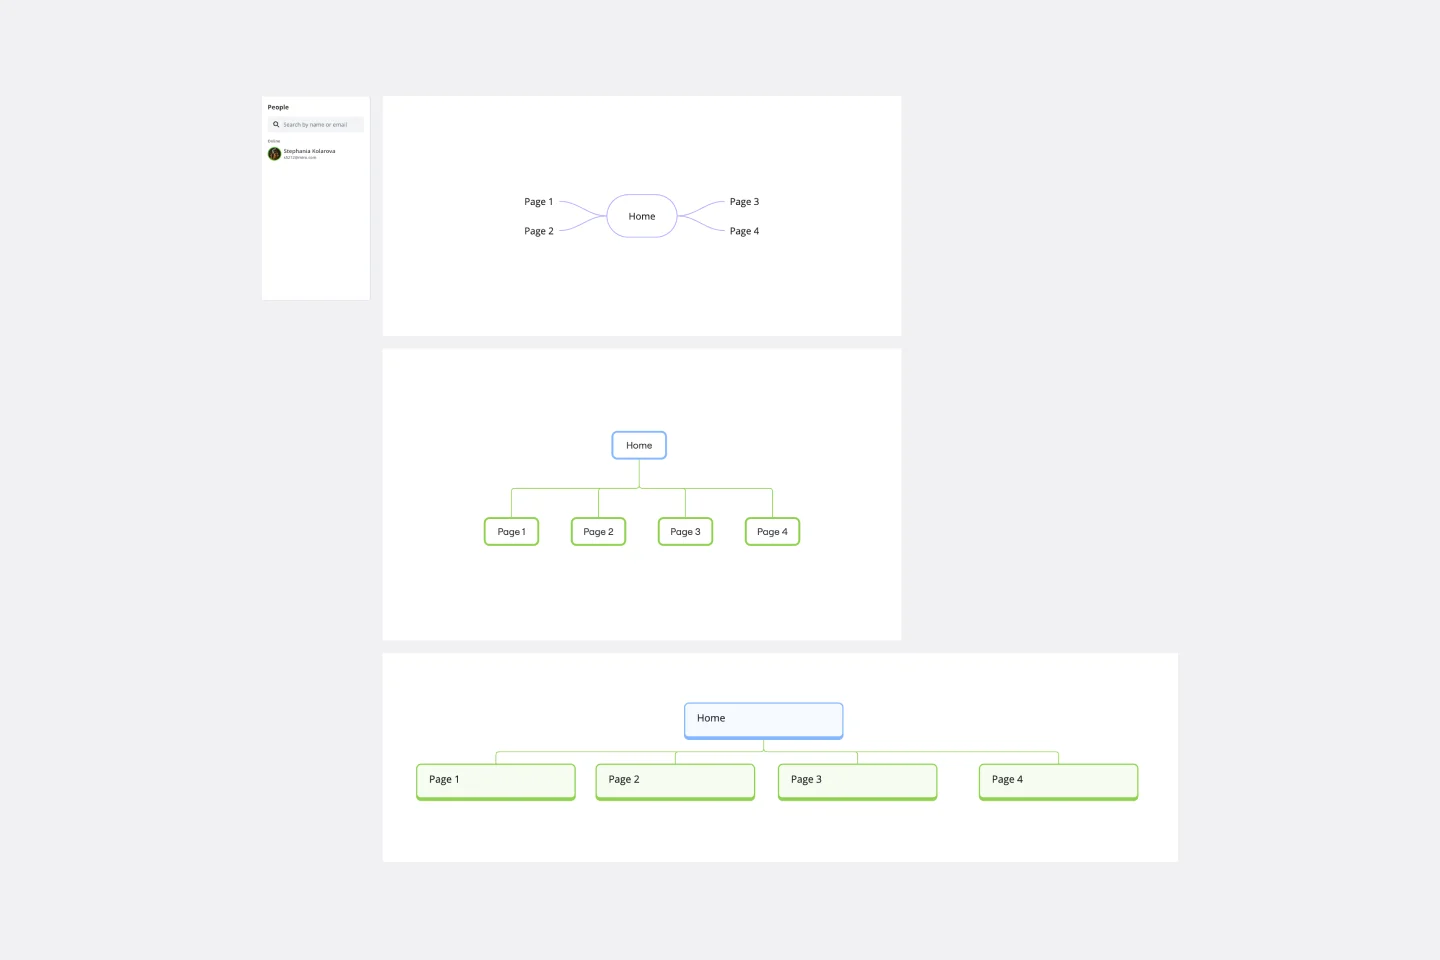
2. Add website wireframes and set your website flow
You can build your website flowchart based on a website wireframe or build a quick mock-up with the shapes and images from our library. Make sure what you build is showing your user experience accurately and indicates flow direction with arrows.
3. Identify duplicate content and flag it for review
Use the number labels on each webpage to map out the user flow or rank the relevance of each website from highest to lowest possible. Flag duplicate content with relevant symbols like emojis to mark potential conflicting information or pages that don’t convert.
4. Streamline your conversion funnel
After you’ve finished adding the necessary new pages to your sitemap, map out and combine any duplicate steps a user must take to complete a sign-up or purchase. The fewer steps, the sooner your potential user can convert. In this step, it’s also helpful to build a customer touchpoint map.
5. Share your sitemap cross-functionally
Lots of people are involved in website launches, audits, or redesigns: from web designers, project managers, and developers, to copywriters, and sales and marketing (at least!). To align everyone on the goals and progress of your website project, keep the flowchart visible and easily accessible to all.
Why use a website flowchart?
A sitemap can help your product, UX, or content teams:
Clarify content themes or focuses so the user understands your products and services
Reduce broken links across your website
Streamline the conversion funnel so the user takes fewer steps before converting
Maintain higher search engine rankings by planning regular content refreshes to maintain a competitive edge
Kickstart a new business or initiative, especially since sitemaps help content get discovered faster
Invite cross-functional input and collaborate, as the needs of the users and website or content architecture evolve
Use your website flowchart as a web design project tracker, too. Keep an eye on finalized website elements, what areas need development, and how much your team progresses.
FAQ about website flowcharts
How do you create a flowchart for a website?
There are many ways to create a website flowchart, but some of the best practices include conducting user research to understand your customer’s pain points, and collaborating with other teams such as design, product, and development to assess what’s feasible or not. Finally, test your prototypes, to be sure your website flowchart is good, user-friendly, and will reach your company’s goals.