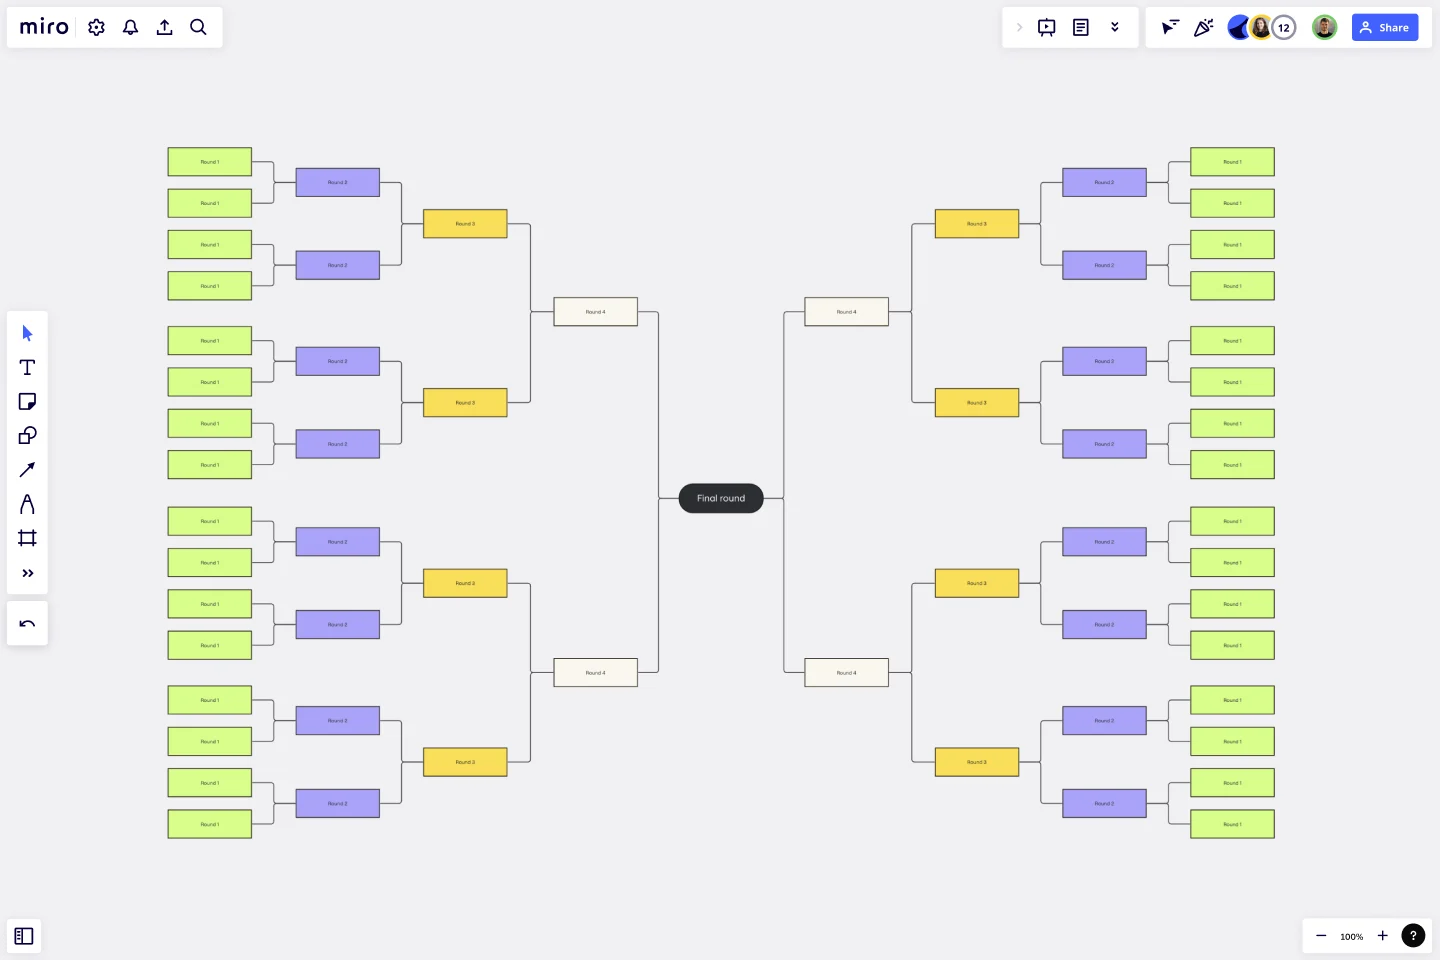
Bracket Template
Make the path to a final decision easier with the bracket template.
Trusted by 65M+ users and leading companies
About the Bracket Template
The Bracket Template is a unique visualization tool that stands out among many others. Its structure and purpose are designed to help organize and rank ideas, teams, or topics in a sequential and competitive manner. This tool is essential for decision-making, prioritization, or even some fun team activities.
What's a bracket template?
A Bracket Template is a visual representation structured in the shape of a tree, where individual entities or ideas start on either side of the diagram and face off against each other in successive rounds until a winner emerges. Each area of the template comprises:
First seeding sections: The initial placement of entities or ideas. It’s where the competition or comparison begins.
Match-up areas: These show which entities or ideas are competing against each other in each round.
Progression lines: These connector lines indicate who moves forward in the bracket after each decision or result.
Winner's circle: Located at the end of the template, it celebrates the final entity or idea that emerges victorious.
To use it, place your initial ideas or teams in the seeding sections, and as decisions are made, move or mark the progressing entity to the next round until you reach a final conclusion.
How to use the bracket template in Miro
Once on the board, you'll find it's a breeze to edit the template. With just a few clicks, adjust the names, colors, and shapes to suit your needs.
Want to expand? Use automated diagramming features to add more shapes and connector lines, ensuring the template scales with your needs.
Feel free to incorporate any artifact on the board, whether it's notes, images, or links, enriching the context and information of your bracket.
Why use a bracket template?
Structured decision-making: It helps streamline and organize complex decisions by breaking them down into smaller, manageable comparisons.
Engagement: The visual nature and competitive setup foster participation and engagement among stakeholders.
Clarity: It provides a clear visual pathway of progression, making it easier to understand the decision-making process.
Versatility: Suitable for various scenarios, from business decision-making, product prioritization, to fun team-building exercises.
Historical record: The completed template can serve as a visual record of decisions made, offering insights for future reference.
Can I customize the number of seeding sections?
Absolutely. The template is designed to be flexible. You can expand or reduce the number of seeding sections based on your requirements.
Is it possible to use the Bracket Template for non-competitive scenarios?
Yes. While traditionally used for competitive scenarios, the bracket template can be adapted for any situation where structured decision-making or organization is beneficial.
Are there any collaboration features available with the Bracket Template?
Stakeholders can comment, provide feedback, and participate in real-time, making the decision-making process collaborative and inclusive.
Get started with this template right now.
Block Diagram Template
Works best for:
Mapping, Software Development, Diagrams
Use this template to illustrate technical systems. Blocks represent important objects in the system, and arrows demonstrate how the objects relate to each other. Perfect for engineers, workflow managers, or anyone trying to build a better process.
Breadboard (UI Flow Diagram)
Works best for:
Diagramming
The Breadboard (UI Flow Diagram) template offers a visual framework for designing and prototyping user interfaces (UIs) using the breadboard method. It provides elements for arranging UI components and defining user interactions. This template enables designers and developers to create interactive UI prototypes quickly and iteratively, facilitating user testing and feedback. By promoting rapid prototyping and experimentation, the Breadboard (UI Flow Diagram) empowers teams to design intuitive and user-friendly digital experiences effectively.
Pie Chart Template
Works best for:
Education, Operations
Pie charts are an excellent way to present relationships between datasets graphically, where you can quickly compare information and see contrast right away. Professionals from many fields use pie charts to support their presentations and enrich their storytelling as it’s one of the most commonly used data charts.
Cloudflare RAG Architecture Knowledge Seeding Template
The Cloudflare RAG Architecture Knowledge Seeding template in Miro streamlines the sharing and visualization of cloud architecture knowledge, making it ideal for tasks like cloud infrastructure optimization and diagram creation. This template enables straightforward documentation and collaboration, ensuring complex information is accessible to all team members.
UML Diagram Template
Works best for:
Diagrams, Software Development
Originally used as a modeling language in software engineering, UML has become a popular approach to application structures and documenting software. UML stands for Unified Modeling Language, and you can use it to model business processes and workflows. Like flowcharts, UML diagrams can provide your organization with a standardized method of mapping out step-by-step processes. They allow your team to easily view the relationships between systems and tasks. UML diagrams are an effective tool that can help you bring new employees up to speed, create documentation, organize your workplace and team, and streamline your projects.
UML Sequence Registration Process Template
Works best for:
UML
The UML Sequence Registration Process Template helps visualize and document user registration processes. It enables the rapid creation of sequence diagrams, which are crucial for enhancing clarity and identifying potential issues early in the design phase. This template not only supports collaborative efforts through Miro's platform, facilitating real-time teamwork, but also ensures a comprehensive system design. Being part of a broader collection of UML diagram templates, it stands as a valuable asset for projects involving registration workflows, contributing to streamlined project execution and effective communication among team members.
