Perceptual Map Template
Visually represent customers’ perceptions of your company, brand, product, or service.
About the perceptual map template
What is a perceptual map?
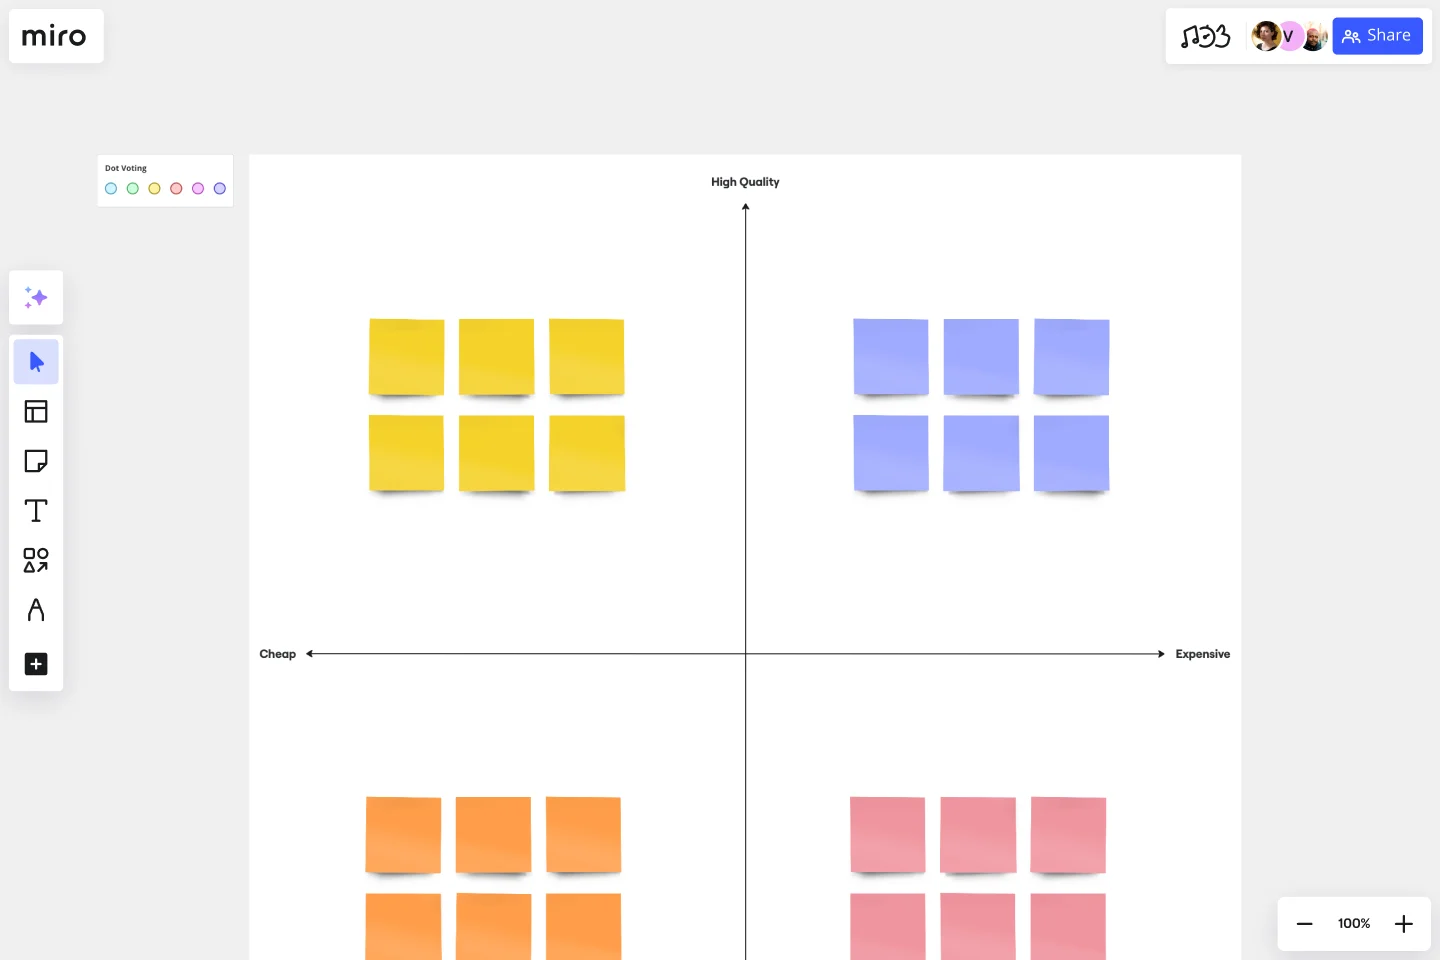
A perceptual map is a visual representation of customers’ or potential customers’ perceptions. Perceptual maps are used to assess organizations, brands, products, ideas, goods, or services.
Perceptual mapping is a powerful diagrammatic technique. To create a perceptual map, you must first draw two or more axes. The axes display your company’s product, brand, or service relative to your competition. Many marketers and product managers choose to use different size circles to represent sales volume or market share of competing products, though this is optional. You can then ask participants to rank competing products relative to each other along these axes. The resulting map gives you insight into how customers feel about competing products in a given market.
What can you use a perceptual map to assess?
You can use a perceptual map to assess a wide range of attributes such as price, performance, safety, and reliability. There are a variety of benefits to using a perceptual map.
Benefit 1 - Gain a better understanding of your product is positioned in a given market. If you’re operating in a dynamic, crowded market, it can be hard to know how your product measures up to the competition. If you’re operating in a small, new market, it can be equally difficult. Perceptual maps are vital for gaining insight into your relative strengths and weaknesses.
Benefit 2 - Discover how customers and potential customers perceive your brand. Many businesses ship goods or services without any view into why their customers bought them -- or why potential customers failed to do so. Perceptual mapping puts you in touch with your customers’ decision-making processes.
Benefit 3 - Assess your competition’s strengths and weaknesses. Since perceptual maps situate your business relative to your competition, it can help you figure out what your competitors are doing right and wrong.
Benefit 4 - Help your business understand gaps in the market. When your business is successful, it can be easy to keep shipping the same (or similar) products year after year without iterating. Perceptual maps help you explore the market and probe for unseen gaps, which might be ripe for exploitation.
Benefit 5 - Understand changes in customer behavior and purchasing decisions. Maybe your customers suddenly stopped buying a certain product, or maybe they started buying that product en masse. Either way, it’s crucial to understand why so you can make decisions going forward. A perceptual map gets at the heart of customer behavior.
Why use a perceptual map?
You can use a perceptual map to understand what your customers think about you and your competitors. This can help you track market trends, identify gaps in the market, and develop your branding and marketing strategies.
Get started with this template right now.
Reverse Brainstorming Template
Works best for:
Ideation, Brainstorming, Team Meetings
Reverse brainstorming is a technique that prompts a group to think of problems, rather than solutions. Because we naturally think of problems, it’s a great way to get a group to anticipate problems that may occur during a project. To engage in reverse brainstorming, start by identifying the problem, and then think of things that might exacerbate it. Ask your team to generate ideas around ways in which the problem could get worse. Reverse the problems into solutions again, and then evaluate your ideas.
Project Planning Template
Works best for:
Project Management, Project Planning
A project plan is a single source of truth that helps teams visualize and reach project milestones. Project plans are most useful when you outline the project’s “what” and “why” to anyone who needs to give you project buy-in. Use a project plan to proactively discuss team needs; expectations; and baselines for timeline, budget, and scope. The plan will also help you clarify available resources before you kick off a project, as well as expected deliverables at the end of the project.
REAN Template
Works best for:
Marketing, Strategic Planning, Meetings
First introduced in Cult of Analytics, the REAN model is used to measure and understand the efficacy of marketing efforts. REAN stands for Reach, Engage, Activate, and Nurture, the main stages a marketer’s audiences experience during a typical journey. The REAN model helps marketing teams develop useful KPIs that can help capture how well their marketing or ad campaigns are working. Many teams rely on the REAN model because it is adaptable to a variety of marketing efforts, including planning measurement frameworks, setting goals, deciding on objectives, and mapping digital marketing channels.
Meeting Notes Template
Works best for:
Business Management, Meetings
When your meeting is a success (and Miro will help make sure it is), participation will run high, brilliant ideas will be had, and decisions will be made. Make sure you don’t miss a single one — use our meeting notes template to track notes and feedback in a centralized place that the whole team can access. Just assign a notetaker before the meeting, identify the discussion topics, and let the notetaker take down the participants, important points covered, and any decisions made.
Year Timeline Template
Works best for:
Timeline, Planning
The Year Timeline template provides a comprehensive view of annual events and milestones. Perfect for planning yearly goals, tracking progress, and scheduling important dates, this template helps you stay organized and focused throughout the year.
Competitive Analysis Template
Works best for:
Marketing, Decision Making
Developing a great product starts with knowing the lay of the land (meaning who you’re up against) and answering a few questions: Who are your competitors? How does your product or service compare? What makes you stand out? A competitive analysis will help find the answers, which can ultimately shape your product, value prop, marketing, and sales strategies. It’s a great exercise when a big business event is about to occur — like a new product release or strategic planning session.

