Diagramming templates
Check off all the essential steps of your diagramming process and have a complete overview of operations with our diagramming templates collection. Motivate your team to take action and reach your desired project outcomes.
Challenge - UML Iphone
Works best for:
Diagramming
The Challenge UML Iphone template offers a visual framework for designing and modeling iPhone app challenges and solutions using UML (Unified Modeling Language). It provides elements for defining app functionalities, user interactions, and system architecture. This template enables teams to brainstorm ideas, document requirements, and visualize app designs, facilitating collaboration and innovation. By promoting clarity and alignment, the Challenge - UML Iphone template empowers teams to design iPhone apps that meet user needs and deliver exceptional user experiences.
Person Api Uml
Works best for:
Diagramming
The Person Api Uml template offers a visual framework for designing and modeling Person API structures and interactions. It provides elements for defining entities, attributes, and relationships within a Person API system. This template enables teams to visualize and communicate the structure and behavior of Person APIs, facilitating collaboration and alignment among stakeholders. By promoting clarity and consistency in API design, the Person Api Uml template empowers teams to build robust and interoperable Person API solutions.
Fishbone Diagram for Product Development
Works best for:
Fishbone Diagram
Enhance your product development process with the Fishbone Diagram for Product Development. This template helps you identify potential issues and their root causes, ensuring a thorough analysis before product launch. Use it to streamline development, reduce risks, and improve product quality. Perfect for product managers and development teams aiming to deliver high-quality products efficiently.
Service Blueprint
Works best for:
Diagramming
The Service Blueprint template is a visual tool for designing and optimizing service experiences. It provides a structured framework for mapping customer journeys, identifying touchpoints, and aligning internal processes. This template enables teams to visualize the entire service ecosystem, uncover pain points, and innovate solutions to enhance customer satisfaction. By promoting customer-centricity and collaboration, the Service Blueprint empowers organizations to deliver exceptional service experiences and drive sustainable growth.
Interrelationship Diagram
Works best for:
Diagramming
The Interrelationship Diagram template is a visual tool for analyzing and illustrating complex relationships between variables or elements within a system. It provides a structured framework for mapping out connections, dependencies, and interactions. This template enables teams to visualize patterns, identify causal relationships, and uncover insights into system behavior. By promoting systems thinking and understanding of interdependencies, the Interrelationship Diagram empowers organizations to make informed decisions and drive effective solutions to complex problems.
Affinity Diagram
Works best for:
Diagramming
The Affinity Diagram template is a visual tool for organizing and categorizing ideas, data, or issues into related groups. It provides a structured framework for conducting group brainstorming and affinity grouping activities. This template enables teams to synthesize information, identify patterns, and generate insights collaboratively. By promoting creativity and collaboration, the Affinity Diagram empowers teams to organize and prioritize information effectively, driving decision-making and problem-solving processes efficiently.
Intent to Outcome Diagram
Works best for:
Diagramming
The Intent to Outcome Diagram template is a visual tool for mapping out the relationship between desired outcomes and the actions required to achieve them. It provides a structured framework for defining intentions, outcomes, and key activities. This template enables teams to align on goals, track progress, and identify areas for improvement. By promoting clarity and alignment, the Intent to Outcome Diagram empowers organizations to set strategic direction and drive results effectively.
Innovation Diagram - S.PSS
Works best for:
Diagramming
The Innovation Diagram_S.PSS template offers a visual framework for mapping out the innovation process using the S.PSS (Service Product System Strategy) approach. It provides elements for defining service components, product features, and system interactions. This template enables teams to visualize and communicate their innovation strategy, facilitating alignment and collaboration across stakeholders. By promoting systematic innovation and holistic thinking, the Innovation Diagram_S.PSS empowers organizations to drive sustainable growth and competitive advantage through service and product innovation.
Value Network Mapping (1.0)
The Value Network Mapping (1.0) template is a visual tool for analyzing and optimizing the relationships and interactions between stakeholders within a network. It provides a structured framework for mapping out value exchanges, dependencies, and opportunities for collaboration. This template enables teams to gain insights into the dynamics of their ecosystem, identify key actors, and align strategies for mutual benefit. By promoting transparency and collaboration, Value Network Mapping empowers organizations to enhance value creation and foster strategic partnerships.
Fishbone Diagram
Works best for:
Diagramming
The Fishbone Diagram template, also known as the Ishikawa or Cause-and-Effect diagram, offers a visual tool for identifying and analyzing root causes of problems or issues. It provides a structured framework for categorizing potential causes into major categories such as people, process, environment, and equipment. This template enables teams to conduct root cause analysis systematically, facilitating problem-solving and decision-making. By promoting a structured approach to problem analysis, the Fishbone Diagram empowers teams to address issues effectively and implement corrective actions efficiently.
Opportunity Solution Tree
Works best for:
Diagramming
The Opportunity Solution Tree template is a visual tool for identifying and prioritizing opportunities and solutions. It provides a structured framework for mapping customer needs, pain points, and potential solutions. This template enables teams to explore divergent ideas, evaluate alternatives, and focus on high-impact solutions. By promoting customer-centricity and innovation, the Opportunity Solution Tree empowers teams to address market needs effectively and deliver value-driven solutions.
Causal Loop Diagrams (1.0)
Works best for:
Diagramming
The Causal Loop Diagrams (1.0) template offers a visual tool for modeling complex systems and understanding the feedback loops that drive behavior. It provides a structured framework for identifying causal relationships, reinforcing loops, and balancing feedback within a system. This template enables teams to analyze system dynamics, anticipate unintended consequences, and formulate effective strategies for intervention. By promoting systems thinking and understanding of interdependencies, Causal Loop Diagrams empower organizations to navigate complexity and drive sustainable change.
Bar Chart / Diagram Combined
Works best for:
Diagramming
The Bar Chart / Diagram Combined template offers a versatile tool for creating visualizations that combine bar charts with other diagrammatic elements. It provides elements for representing data trends, relationships, and comparisons effectively. This template enables teams to create customized visualizations that communicate complex information in a clear and compelling manner. By promoting visual clarity and insight, the Bar Chart / Diagram Combined template empowers teams to make data-driven decisions and communicate findings with impact.
Chat-Bot
Works best for:
Diagramming
The Chat Bot template is a visual tool for designing and mapping out chatbot interactions and functionalities. It provides a structured framework for visualizing conversation flows, user inputs, and bot responses. This template enables teams to collaborate on designing chatbot experiences that are intuitive and user-friendly, driving engagement and satisfaction. By promoting clarity and alignment, the Chat-Bot template empowers organizations to create effective chatbot solutions that meet user needs and business objectives.
Bank Mobile App User Journey
Works best for:
Diagramming
The Bank Mobile App User Journey template offers a visual framework for mapping out the user experience journey within a banking mobile application. It provides elements for visualizing user interactions, touchpoints, and emotions throughout the journey. This template enables teams to understand user needs, pain points, and opportunities for improvement, facilitating the design of user-friendly and intuitive banking apps. By promoting empathy and user-centric design, the Bank Mobile App User Journey template empowers teams to create digital experiences that meet customer expectations and drive engagement.
Turtle Diagram for BA
Works best for:
Diagramming
The Turtle Diagram for BA template offers a visual framework for defining and auditing business processes according to ISO 9001 standards. It provides elements for documenting process inputs, outputs, activities, and controls. This template enables organizations to ensure compliance, identify process improvements, and enhance quality management practices. By promoting systematic process documentation and auditability, the Turtle Diagram for BA empowers organizations to achieve and maintain ISO 9001 certification, demonstrating commitment to quality and continuous improvement.
OutSystems Architecture Diagram
Works best for:
Diagramming
The OutSystems Architecture Diagram template offers a visual tool for designing and documenting software architectures using the OutSystems platform. It provides elements for modeling application components, data structures, and integration points. This template enables teams to visualize and communicate the architecture of their OutSystems applications, facilitating collaboration and alignment among developers and stakeholders. By promoting clarity and understanding of system architecture, the OutSystems Architecture Diagram empowers teams to build scalable, maintainable, and high-performance applications effectively.
Flow Diagrams
Works best for:
Diagramming
The Flow Diagrams template offers a versatile tool for visualizing processes, workflows, and systems. It provides a range of shapes and connectors for creating flowcharts, process maps, and data flow diagrams. This template enables teams to represent complex systems and processes in a clear and structured manner, facilitating communication and decision-making. By promoting visual clarity and understanding, Flow Diagrams empower teams to analyze and optimize processes effectively, driving efficiency and productivity.
Job Search Process Diagram
Works best for:
Diagramming
The Job Search Process Diagram template offers a visual tool for mapping out the steps and stages involved in the job search process. It provides a structured framework for organizing tasks, tracking progress, and managing resources. This template enables job seekers to streamline their job search efforts, stay organized, and increase their chances of success. By promoting clarity and efficiency, the Job Search Process Diagram empowers individuals to navigate the job market effectively and achieve their career goals.
Breadboard (UI Flow Diagram)
Works best for:
Diagramming
The Breadboard (UI Flow Diagram) template offers a visual framework for designing and prototyping user interfaces (UIs) using the breadboard method. It provides elements for arranging UI components and defining user interactions. This template enables designers and developers to create interactive UI prototypes quickly and iteratively, facilitating user testing and feedback. By promoting rapid prototyping and experimentation, the Breadboard (UI Flow Diagram) empowers teams to design intuitive and user-friendly digital experiences effectively.
Dependency Diagrams Educational Board
Works best for:
Diagramming
The Dependency Diagrams Educational Board template provides a visual tool for teaching and learning about dependency relationships between components in systems. It offers a structured framework for illustrating dependencies, connections, and interactions within a system or process. This template enables educators to explain complex concepts effectively and engage learners in interactive activities. By promoting visual learning and understanding of dependencies, Dependency Diagrams empower students to grasp fundamental principles of systems thinking and analysis.
System Context Diagram
Works best for:
Diagramming
The System Context Diagram template is a visual tool for illustrating the relationships between a system and its external entities. It provides elements for depicting system boundaries, interfaces, and interactions with external stakeholders. This template enables teams to understand the broader context in which a system operates, facilitating requirements analysis and design decision-making. By promoting clarity and alignment, the System Context Diagram empowers teams to design systems that meet stakeholder needs and integrate seamlessly with their environment.
Personal Life Blueprint - Clarity Facilitator
Works best for:
Diagramming
The Personal Life Blueprint Clarity Facilitator template is a visual tool for individuals to clarify their personal goals, values, and priorities. It provides a structured framework for reflecting on different aspects of life and setting actionable objectives. This template enables individuals to gain clarity, focus, and direction in their personal and professional lives. By promoting self-awareness and goal-setting, the Personal Life Blueprint empowers individuals to lead more fulfilling and purpose-driven lives.
Cloud Blueprint
Works best for:
Diagramming
The Cloud Blueprint template offers a visual framework for designing and planning cloud-based architectures. It provides elements for mapping out cloud services, components, and dependencies. This template enables teams to visualize and communicate complex cloud infrastructure designs, facilitating collaboration and decision-making. By promoting clarity and alignment, the Cloud Blueprint empowers organizations to design scalable, resilient, and secure cloud solutions that meet business requirements and objectives.
20/80 Process Diagram - EOS® Compatible
Works best for:
Diagramming
The 20/80 Process Diagram - EOS® Compatible template is a visual tool for mapping out processes and workflows aligned with the Entrepreneurial Operating System (EOS®) methodology. It provides a structured framework for identifying core processes and key activities that drive business outcomes. This template enables organizations to streamline operations, clarify roles and responsibilities, and enhance accountability. By promoting alignment with EOS® principles, the 20/80 Process Diagram empowers teams to achieve organizational excellence and drive sustainable growth.
Argument Map
Works best for:
Diagramming
The Argument Map template is a visual tool for structuring and analyzing arguments and debates. It provides a structured framework for capturing premises, conclusions, and logical relationships. This template enables teams to explore complex issues, identify strengths and weaknesses in arguments, and make informed decisions. By promoting clarity and critical thinking, the Argument Map template empowers teams to navigate debates and discussions effectively, fostering consensus and understanding.
Fishbone Diagram for Service Improvement
Works best for:
Fishbone diagram
The Basic Fishbone Diagram, also known as the Ishikawa or cause-and-effect diagram, is a powerful tool for identifying the root causes of problems. Use this template to systematically explore and document potential causes of an issue, categorizing them into key areas such as people, processes, equipment, and materials. This visual approach helps teams collaborate on problem-solving, ensuring all factors are considered and addressed effectively.
Fishbone Diagram for Manufacturing
Works best for:
Fishbone diagram
In manufacturing, pinpointing the root causes of defects and inefficiencies is crucial. The Fishbone Diagram for Manufacturing template helps you systematically investigate issues related to production. Categorize potential causes into areas such as machinery, methods, materials, and manpower. This structured approach enables your team to collaboratively identify and address underlying problems, improving processes and enhancing manufacturing quality.
Fishbone Diagram for Quality Control
Works best for:
Fishbone diagram
Maintaining high standards of quality is vital in any industry. The Fishbone Diagram for Quality Control template helps you identify and analyze the root causes of quality issues. Use it to categorize potential causes into areas such as materials, methods, manpower, and machinery. This structured approach ensures a thorough examination of all possible factors affecting quality, leading to more effective solutions and continuous improvement.
Fishbone Diagram for Process Improvement
Works best for:
Planning, Strategy
Process improvement is key to enhancing efficiency and productivity. The Fishbone Diagram for Process Improvement template helps you identify the root causes of process inefficiencies. Categorize potential causes into areas such as workflow, resources, technology, and personnel. This structured analysis enables your team to systematically explore and address issues, streamlining processes and boosting overall productivity.
Fishbone Diagram for Healthcare
Works best for:
Fishbone Diagram
Ensuring high-quality care in healthcare settings requires a thorough understanding of root causes behind issues. The Fishbone Diagram for Healthcare template helps you analyze potential causes of problems in areas like patient care, staff performance, and administrative processes. This structured approach facilitates comprehensive analysis and collaborative problem-solving, ultimately leading to improved healthcare outcomes and patient satisfaction.
Fishbone Diagram for Marketing
Works best for:
Fishbone Diagram
Optimizing marketing strategies requires identifying underlying issues. The Fishbone Diagram Marketing template helps you systematically explore factors affecting your campaigns. Categorize potential causes into areas such as market research, product positioning, promotional strategies, and distribution channels. This structured analysis enables your team to pinpoint and address issues, enhancing marketing effectiveness and achieving better results.
Basic Venn Diagram
Works best for:
Venn Diagram
The Basic Venn Diagram template is a simple yet powerful tool for visualizing relationships between different sets. Use it to compare and contrast concepts, identify commonalities and differences, and organize information logically. This template is perfect for brainstorming, teaching, and presentations, making complex information more accessible and understandable. Ideal for educators, students, and professionals in various fields.
Four-Circle Venn Diagram
Works best for:
Venn Diagram
The Four Circle Venn Diagram template is designed for comparing four sets of data. Use this tool to identify commonalities and differences across multiple categories. This template is ideal for complex data analysis, strategic planning, and academic research. It helps you visually organize information, making it easier to understand and communicate insights. Perfect for educators, researchers, and professionals in need of detailed comparison tools.
Venn Diagram Practical Applications
Works best for:
Venn Diagram
The Venn Diagram for Practical Applications template helps you apply Venn diagrams to real-world scenarios. Use this template to solve problems, identify relationships, and make decisions based on clear visual analysis. It's perfect for practical tasks such as project planning, resource allocation, and strategic decision-making. This tool is ideal for business professionals, educators, and anyone looking to apply theoretical concepts to practical situations.
Venn Diagram for Marketing Analysis
Works best for:
Venn Diagram
Optimize your marketing strategies with the Venn Diagram for Marketing Analysis template. Use it to compare different market segments, identify overlapping interests, and analyze competitive landscapes. This tool helps you visualize data, uncover insights, and make informed marketing decisions. Perfect for marketing professionals, strategists, and business analysts looking to enhance their marketing analysis and planning efforts through visual tools.
Venn Diagram for Learning and Education
Works best for:
Venn Diagram
Enhance learning and teaching with the Venn Diagram for Learning and Education template. Use it to compare concepts, illustrate relationships, and facilitate discussions. This template helps students and educators organize information visually, making complex ideas easier to understand and retain. It's an excellent tool for classrooms, study groups, and professional training sessions, promoting deeper understanding and active learning.
Venn Diagram for Research
Works best for:
Venn Diagram
The Venn Diagram for Research template is a powerful tool for analyzing relationships and intersections in research data. Use it to compare different variables, identify overlaps, and draw insights from complex datasets. This template is ideal for researchers, analysts, and academics looking to visualize their findings and communicate results effectively. It's perfect for scientific studies, market research, and any field that requires detailed data comparison.
Business Mindmap
Works best for:
Diagramming
The Business Mindmap template is a visual tool for brainstorming, organizing, and presenting business ideas and concepts. It provides a structured framework for capturing and connecting thoughts, insights, and action items. This template enables teams to explore business strategies, analyze market trends, and develop innovative solutions. By promoting creativity and collaboration, the Business Mindmap empowers teams to generate and communicate actionable business plans effectively.
BPM
Works best for:
Diagramming
The BPM (Business Process Management) template is a visual tool for modeling, analyzing, and optimizing business processes. It provides a structured framework for documenting process flows, identifying bottlenecks, and improving efficiency. This template enables organizations to streamline operations, enhance productivity, and drive business performance. By promoting process transparency and agility, the BPM template empowers teams to achieve operational excellence and deliver value to stakeholders.
BPMN 2.0
Works best for:
Diagramming
The BPMN 2.0 template offers a visual notation for modeling business processes using the Business Process Model and Notation (BPMN) standard. It provides elements for defining process flows, activities, and decision points. This template enables teams to document and analyze business processes systematically, facilitating process optimization and automation. By promoting standardization and clarity in process modeling, the BPMN 2.0 template empowers organizations to improve efficiency, agility, and compliance in their operations.
BPMN Template
Works best for:
Diagramming
The BPMN Template, elements, and example template offers a comprehensive visual notation for modeling business processes using the Business Process Model and Notation (BPMN) standard. It provides elements for defining process flows, activities, and decision points. This template enables teams to document and analyze business processes systematically, facilitating process optimization and automation. By promoting standardization and clarity in process modeling, the BPMN template empowers organizations to improve efficiency, agility, and compliance in their operations.
Miro x AWS: Accelerate your cloud journey
Works best for:
Diagramming
The Miro x AWS: Accelerate your cloud journey template offers a visual framework for planning and executing cloud migration and optimization projects using Amazon Web Services (AWS). It provides elements for mapping out cloud architectures, migration strategies, and cost optimization initiatives. This template enables teams to collaborate effectively, align on objectives, and accelerate their cloud journey with AWS services. By promoting collaboration and alignment, the Miro x AWS template empowers organizations to leverage AWS cloud technologies efficiently and achieve their business objectives effectively.
Fishbone Diagram for Root Cause Analysis
Works best for:
Fishbone Diagram
The Fishbone Diagram for Root Cause Analysis template helps identify and analyze the underlying causes of a problem. It visually breaks down issues into categories, such as people, processes, and equipment, to uncover root causes. Perfect for teams aiming to solve problems systematically, enhance processes, and prevent future occurrences. Ideal for brainstorming and collaborative analysis sessions.
UML Use Case Diagram
Works best for:
UML Diagrams, Diagramming
Visualize system interactions with the UML Use Case Diagram. This template helps you map out user interactions and system processes, providing a clear overview of functional requirements. Ideal for software developers, business analysts, and project managers, it supports planning and communicating system functionalities. Use it to ensure all user scenarios are considered and to facilitate better design and implementation of software systems.
Supply and Demand Graph Template
Works best for:
Market Research, Mapping, Diagrams
How do you price your product so that you make a profit while keeping customers and manufacturers happy? By finding a fair price. A supply and demand diagram is a graph that visualizes how much demand there is for your product and how many products you need. This, in turn, helps you with product pricing.
Block Diagram Template
Works best for:
Mapping, Software Development, Diagrams
Use this template to illustrate technical systems. Blocks represent important objects in the system, and arrows demonstrate how the objects relate to each other. Perfect for engineers, workflow managers, or anyone trying to build a better process.
PERT Chart Template
Works best for:
Mapping, Project Planning
A Program Evaluation and Review Technique (PERT) diagram is used to plan projects efficiently. They help you set a clear timeline, plan out tasks and dependencies, and determine a critical path.
UML Communication Diagram Template
Works best for:
Software Development, Mapping, Diagrams
Most modern programs consist of many moving parts working to a precise set of instructions. With a communication diagram, you can visualize exactly how those parts work together, giving you a clearer understanding of your program as a whole. What’s more, the diagram leaves spaces for expanding the network of relationships as your product grows and evolves. A communication diagram is a vital tool in any software designer’s arsenal.
UML State Machine Diagram Template
Works best for:
Software Development, Mapping, Diagrams
Visualize the workflow of a process and how objects perform actions based on different stimuli. State machine diagrams are valuable for understanding how an object responds to events at the different stages of its life cycle. They are also helpful for visualizing event sequences in a system.
UML Activity Diagram Template
Works best for:
Diagrams
Use our Activity Diagram template to break down activities into smaller decisions and subprocesses. Improve and optimize systems and processes in I.T., business management, and more.
UML Class Diagram Template
Works best for:
UML Class Diagram Template, Mapping, Diagrams
Get a template for quickly building UML class diagrams in a collaborative environment. Use the UML class diagram template to design and refine conceptual systems, then let the same diagram guide your engineers as they write the code.
UML Component Diagram Template
Works best for:
Mapping, Diagrams, Software Development
Use our Component Diagram template to show how a system’s physical components are organized and wired together. Visualize implementation details, make sure planned development matches system needs, and more — all in a collaborative environment.
UML Sequence Diagram Template
Works best for:
Software Development, Mapping, Diagrams
Analyze and showcase how external entities interact with your system using a sequence diagram. Get a bird’s-eye view of your work processes, business functions, and customer interactions using this diagram. Also, identify any potential problems early and solve them before implementation.
Fishbone Diagram Template
Works best for:
Operations, Diagrams, Workflows
What is the best way to solve any problem your team faces? Go straight to the root. That means identifying the root causes of the problem, and fishbone diagrams are designed to help you do it best. Also known as the Ishikawa Diagram (named after Japanese quality control expert Kaoru Ishikawa), fishbone diagrams allow teams to visualize all possible causes of a problem, to explore and understand how they fit together holistically. Teams can also use fishbone diagrams as a starting point for thinking about what the root cause of a future problem might be.
3-Circle Venn Diagram
Works best for:
Education, Diagrams, Brainstorming
Venn diagrams have been a staple of business meetings and presentations since the 1800s, and there’s a good reason why. Venn diagrams provide a clear, effective way to visually showcase relationships between datasets. They serve as a helpful visual aid in brainstorming sessions, meetings, and presentations. You start by drawing a circle containing one concept, and then draw an overlapping circle containing another concept. In the space where the circles overlap, you can make note of the concepts’ similarities. In the space where they do not, you can make note of their differences.
Outcome Mapping Template
Works best for:
Diagrams, Mapping, Project Management
Use Miro’s outcome mapping template to improve your operational efficiency. Outcome mapping will help you visualize all the possible strategic outcomes for your upcoming project, allowing you to see into the black box to identify any potential challenges along the way.
Strategy Diamond Template
Works best for:
Leadership, Operations, Strategic Planning
To achieve key objectives, every business assembles a series of strategies. But what elements should you consider when building a strategy? A strategy diamond is a collection of elements forming a coherent business strategy. These elements include: Arenas, Differentiators, Vehicles, Staging, and Economic Logic. Most strategic plans focus on just one or two of these elements, creating gaps that might cause problems for your business later on. A strategy diamond can help you stay focused and ensure you’re fulfilling all of your business’s needs rather than one or two.
Onion Diagram Template
Works best for:
Diagramming, Mapping and Diagramming
The Onion Diagram Template is a distinct tool designed to visually represent layers of a specific concept, system, or process, akin to the layers of an onion. Each concentric layer of the diagram provides insights into a different aspect or phase of the topic at hand, moving from the core foundational element outwards to more peripheral components. One of the prime benefits of this template is its ability to offer hierarchical clarity. Users can immediately discern the importance, sequence, or interrelation of different elements within a system, facilitating enhanced comprehension and efficient decision-making.
Algorithm Flowchart Template
Works best for:
Flowcharts
The Algorithm Flowchart Template is a useful tool for simplifying the process of creating and understanding complex algorithms. Its pre-structured format makes it easy to lay out each operation and decision point in a clear and easily understandable visual format. This is particularly helpful for explaining intricate processes to team members who may not be as technically proficient in the subject matter. With each step clearly defined within its designated shape, the flowchart promotes clarity and makes it easy to identify the logical flow at a glance. This clarity is the template's most significant advantage, reducing cognitive load and enabling a more inclusive and straightforward approach to discussing and refining algorithmic solutions.
SDLC Template
Works best for:
Diagramming
The Software Development Life Cycle (SDLC) template is a well-designed visual tool that helps software development teams follow a structured approach from the initial concept to the final deployment of the software. One of the most significant benefits of using this template is that it promotes clear, streamlined communication among team members. By breaking the development cycle into distinct phases, all stakeholders can stay informed about the progress of the project and understand their responsibilities within the larger context. This enhanced communication reduces the chances of misunderstandings and ensures that everyone works together towards the common goal of delivering high-quality software. The template acts not only as a roadmap but also as a shared language for the team, improving collaboration and the efficient progression of the project through each critical stage.
Phylogenetic Tree Template
Works best for:
Diagramming
The Phylogenetic Tree Template is a powerful tool that allows scientists and researchers to visualize evolutionary relationships between species. It is a visual representation of the history of the evolution of life on Earth and helps users identify the relationships between other organisms and their ancestors. The key benefit of this template is that it organizes complex data and makes it more understandable to everyone. Additionally, it offers an efficient way to collect and analyze data, saving time and effort and enabling users to identify significant patterns and relationships in the data.
Logic Model Template
Works best for:
Diagramming
The logic model template is a strategic visual tool designed to delineate the relationship between a program's inputs, activities, outputs, and outcomes. By providing a clear and comprehensive map of the project lifecycle, stakeholders can swiftly grasp the intricate connections within a given initiative. One standout benefit of this template is its ability to enhance clarity: by visually representing the transformation of resources into anticipated results, teams can ensure more efficient and targeted use of their resources, thus maximizing the potential for success in their endeavors.
Double Bubble Map Template
Works best for:
Diagramming, Mapping, Brainstorming
Double Bubble Map Template serves as a powerful tool to facilitate teamwork and streamline idea exploration. This adaptable template empowers teams to brainstorm, analyze, and compare concepts with ease, making it an invaluable asset for enhancing creativity and fostering clarity among team members.
Cycle Diagram Template
Works best for:
Diagramming
The cycle diagram template empowers professionals to visually represent complex cycles with precision and clarity. This template maps out cyclical processes, relationships, or events, ensuring that complex concepts are communicated seamlessly. One key benefit that sets this template apart is its ability to streamline communication and enhance understanding. By crafting visually appealing cycle diagrams, professionals can distill complex information into a clear visual language, making it easier for teams and stakeholders to grasp complex relationships. This ultimately fosters more effective collaboration and decision-making.
Influence Diagram Template
Works best for:
Business Management, Decision Making, Diagrams
See the big picture of any business decision with this Influence Diagram Template. You’ll define the decision you have to make and brainstorm everything that could impact it. When you build connections between these factors, you’ll be able to put the right amount of weight into each one as you make your decision.
Precedence Diagram
Works best for:
Diagramming, Mapping
The Precedence Diagram Template offers a visual tool that maps out project activities and their interrelated sequences. This diagram empowers teams to recognize and anticipate workflow structures by illustrating the connections and dependencies among tasks.
Inverted Org Chart Template
Works best for:
Org Charts, Organizational Design
The Inverted Org Chart Template is a tool that reimagines the traditional hierarchical model by placing frontline employees at the top of the organizational structure. This innovative approach highlights the crucial role played by those who interact with customers directly, ensuring that their insights and contributions are not only recognized but also celebrated. One of the key advantages of this template is that it fosters a feedback-driven environment. Prioritizing frontline workers promotes a culture where valuable insights from the ground can quickly reach the top of the hierarchy, streamlining decision-making processes and ensuring that strategies are based on real-world experiences.
5-Circle Venn Diagram Template
Works best for:
Diagramming, Mapping, Brainstorming
Discover how Miro's 5 Circle Venn Diagram Template can simplify complex decision-making processes. Learn how to create, customize, and share your diagrams for effective visual collaboration. Transform brainstorming sessions with real time, remote teamwork.
Circular Org Chart Template
Works best for:
Organizational Chart
The Circular Org Chart Template is an innovative solution that helps represent and visualize complex organizational structures with ease. The key advantage of this template is its ability to present complex hierarchies in a visually appealing and easy-to-understand format. By adopting a circular arrangement, the template provides a comprehensive and holistic view of the organization, making it effortless for teams to comprehend reporting relationships at a glance. The visual clarity offered by this template fosters efficient communication and decision-making, offering a seamless experience for teams to understand their organizational structure. The template's intuitive design and emphasis on visual representation significantly enhance transparency, promoting a deeper understanding of organizational roles and relationships.
Mental Model Template
Works best for:
Business Management, Mind Mapping, Diagrams
Smart solutions and strong, strategic decisions. The best organizations make both, and a mental model is designed to help them do it. We give you a fast and easy way to try it out — just fill out our ready-made, flexible template and add sticky notes, shapes, and arrows to create a powerful map.
Workflow Diagram Template
Works best for:
Diagramming, Mapping, Process mapping
The Workflow Diagram Template maps out and represents processes or systems using standardized symbols and shapes. By delineating the various steps or stages in a process, it ensures that tasks flow seamlessly from initiation to completion. One of the standout benefits of using this template is its clarity. By translating processes into a visual format, all participants can gain a comprehensive understanding at a glance, eliminating confusion and ensuring everyone is on the same page. This clarity not only promotes efficient task execution but also fosters collaboration among team members.
Product Development Flowchart Template
Works best for:
Product Development
Improve your product development process with the product development flowchart template. The template offers a shared space where team members can provide real time input and feedback as they engage in the various stages of product creation. This collaborative feature ensures that everyone involved is on the same page, reducing the likelihood of miscommunication and enhancing overall project efficiency. By centralizing insights and ideas within the flowchart, teams can collectively shape and refine the product development process, leading to a more cohesive and successful outcome.
Stage-Gate Process Flowchart Template
Works best for:
Diagramming, Project Management
The Stage-Gate Process Flowchart Template structures a project into distinct stages separated by decision-making gates, enhancing the quality of decisions and leading to more successful project outcomes.
AWS Architecture Diagram Template
Works best for:
Software Development, Diagrams
The AWS Architecture Diagram is a visual representation of the AWS framework, and it also translates the best practices when using Amazon Web Services architecture. You can now have an overview of your AWS architecture with Miro’s AWS Architecture Diagram Template, track your cloud solutions easily, and optimize processes like never before.
Yes No Flowchart Template
Works best for:
Diagramming
The Yes-No Flowchart Template is a simple and efficient tool that helps to simplify complex decision-making processes into clear and easy-to-follow steps. This template uses standard shapes to illustrate processes, decisions, and outcomes, with arrows that guide users from one action point to the next based on binary 'yes' or 'no' decisions. Its most prominent benefit is its ability to bring clarity to decision-making. By presenting processes visually, teams can effortlessly understand and navigate complex scenarios, ensuring that each step is transparent and reducing the potential for misunderstandings or missteps.
Supply Chain Diagram Template
Works best for:
Diagramming
The Supply Chain Diagram Template is great for businesses to streamline and enhance their supply chain processes. This template lets you visualize the entire supply chain, from sourcing raw materials to delivering finished products. Its intuitive layout simplifies complex networks, making identifying key areas and potential bottlenecks easier. One of the standout benefits of using this template is its clarity. It bridges the gap between complex processes and strategic decision-making by presenting a clear, visual supply chain representation. This clarity enables teams to pinpoint inefficiencies and implement more effective management strategies, which optimizes operations and facilitates better communication and understanding across different departments within an organization.
Partnership Org Chart Template
Works best for:
Org Charts, Organizational Design
The Partnership Org Chart Template is an interactive tool that visually represents the intricate network of relationships between business partners. It provides a clear and structured layout that helps users grasp how different entities align and interact within a collaborative ecosystem. One of its standout benefits is the clarity it offers. In the often complex world of inter-organizational relationships, having a straightforward, visual representation of partnerships eliminates ambiguities and ensures all stakeholders are on the same page. This fosters more effective collaboration and strategic planning, making it an essential business tool.
UML Sequence Registration Process Template
Works best for:
UML
The UML Sequence Registration Process Template helps visualize and document user registration processes. It enables the rapid creation of sequence diagrams, which are crucial for enhancing clarity and identifying potential issues early in the design phase. This template not only supports collaborative efforts through Miro's platform, facilitating real-time teamwork, but also ensures a comprehensive system design. Being part of a broader collection of UML diagram templates, it stands as a valuable asset for projects involving registration workflows, contributing to streamlined project execution and effective communication among team members.
Cloudflare RAG Architecture Knowledge Seeding Template
The Cloudflare RAG Architecture Knowledge Seeding template in Miro streamlines the sharing and visualization of cloud architecture knowledge, making it ideal for tasks like cloud infrastructure optimization and diagram creation. This template enables straightforward documentation and collaboration, ensuring complex information is accessible to all team members.
UML Sequence E-commerce Checkout Template
Works best for:
UML
The UML Sequence E-commerce Checkout Template in Miro is a versatile tool for visualizing and analyzing e-commerce checkout processes. It provides a step-by-step visual representation of system interactions, is highly customizable, supports real-time collaboration, and is suitable for various e-commerce platforms. It serves as an efficient documentation tool, fosters team collaboration, and contributes to a more streamlined checkout experience for customers.
Instance Scheduler on AWS Template
Works best for:
AWS
The Instance Scheduler on AWS template is a strategic tool designed to enhance the efficiency and cost-effectiveness of managing AWS resources. It serves as a guide for automating the scheduling of Amazon EC2 and Amazon RDS instances, ensuring that these resources are operational only when necessary. This approach not only simplifies the management of instance schedules but also significantly reduces cloud computing costs by avoiding unnecessary runtime.
Automated Security Response on AWS Template
Works best for:
AWS
The Automated Security Response on AWS template is a tool for enhancing AWS security through automation, enabling quick identification and mitigation of threats with minimal manual effort. It integrates with AWS security services for a dynamic response mechanism, ensuring infrastructure security against evolving threats. This template streamlines operational efficiency, offers scalable and customizable security strategies, and accelerates threat response times, making it essential for improving AWS security posture.
UML Class Messaging System Template
Works best for:
UML
The UML Class Messaging System Template streamlines the process of designing and analyzing messaging systems. It allows users to visually map out the structure of a system by detailing classes, their attributes, operations, and the relationships among objects. This template is particularly useful for illustrating the functionality of a messaging system, including the management of text messages, conversation threads, user contacts, notifications, and channels. It offers a clear visual representation of how all these elements interact within the system, making it an invaluable resource for developers, designers, and stakeholders aiming to enhance communication and reduce errors in the development phase.
UML Class E-Commerce System Template
Works best for:
UML
The UML Class E-Commerce System Template streamlines the process of creating and visualizing the class structure of an e-commerce system. It provides a comprehensive framework that includes typical online shop features such as product listings, inventory management, shopping carts, orders, payments, and shipping details. This template facilitates a clear understanding of how these elements interact during an online sales transaction, making it an invaluable tool for teams working on e-commerce projects. By using this template, teams can save time, enhance collaboration, and ensure that their system architecture is robust and efficient, ready to adapt to their business's evolving needs.
Serverless Image Handler on AWS Template
Works best for:
AWS
The Serverless Image Handler on AWS template is designed to facilitate the management and transformation of images in cloud-based projects without the need for server infrastructure management. It is particularly useful for applications and projects that require dynamic image management, offering benefits like efficiency, scalability, and seamless integration with AWS services. By incorporating this template into Miro boards or projects, teams can streamline their workflows, especially when dealing with digital assets or dynamic content, ensuring that their image-handling needs are met efficiently as they scale.
Cloudflare Content-based Asset Creation Template
The Cloudflare Content-based Asset Creation Template enhances efficiency and collaboration within teams working on cloud infrastructure projects. This template provides a structured and intuitive framework for creating and managing digital assets, which streamlines the asset creation process.
Cloudflare Automatic Captioning for Video Template
The Cloudflare Automatic Captioning for Video Template in Miro is a powerful tool designed to enhance the accessibility and engagement of video content. By leveraging Cloudflare's technology, this template helps outline the captioning process for videos. It not only makes content accessible to a broader audience, including those who are deaf or hard of hearing but also boost viewer engagement by making videos consumable in sound-sensitive environments or by individuals who prefer reading along.
AWS Control Tower Account Governance Template
Works best for:
AWS
The AWS Control Tower Account Governance Template streamlines the setup and management of governance across multiple AWS accounts. It leverages AWS Control Tower to automate and simplify the governance process, ensuring that your AWS environment adheres to best practices for security, operations, and compliance. This template is highly customizable, allowing you to adjust governance controls and policies to meet the unique requirements of your organization. It provides a centralized view of your AWS environment, enhancing visibility and control, and scales with your organization as it grows.
Team (XFN) Chart Template
Works best for:
Org Chart, Collaboration
The Team (XFN) Chart Template in Miro enhances cross-functional team collaboration by visualizing relationships and dependencies. This template helps identify bottlenecks, streamline processes, and foster a more efficient and collaborative working environment, making it invaluable for teams looking to improve project execution and efficiency through better visualization of team relationships.
UML Sequence Rental Booking System Template
Works best for:
UML
The UML Sequence Rental Booking System Template streamlines the process of documenting and visualizing the interactions within a car rental booking system. This template maps out the communication flow between the customer, user interface, payment service, and vehicle allocation system, ensuring a smooth and efficient workflow. By providing a clear visual representation of these interactions, the template helps in improving understanding among team members and stakeholders, promoting efficient design and collaboration.
Cloudflare RAG Architecture Knowledge Queries Template
The Cloudflare RAG Architecture Knowledge Queries template is a cutting-edge tool designed to streamline the process of diagramming and understanding the intricate architecture of Cloudflare's Retrieval Augmented Generation (RAG) system. This template is a boon for teams aiming to visualize, query, and optimize Cloudflare's infrastructure collaboratively.
ERD Healthcare Management System Template
Works best for:
ERD
The ERD Healthcare Management System Template streamlines the process of creating and managing entity-relationship diagrams for healthcare management systems. This template helps users visualize the complex relationships between different entities such as patients, healthcare providers, medical records, and billing information. It offers a flexible and customizable framework that can be adapted to fit the specific needs of any healthcare management system, ensuring clarity and efficiency in system design and database structure.
Tree Diagram Template
Works best for:
Diagramming
The tree diagram template helps you organize and present complex information. One of its key benefits is its ability to provide unparalleled visual clarity. It enables you to simplify complicated ideas into a structured, hierarchical format, making it easier to understand and communicate. This template enhances brainstorming sessions, project planning, and decision-making processes by mapping out relationships and dependencies clearly and effortlessly. You can now say goodbye to information overload and immerse yourself in a visual journey that simplifies complexity with the tree diagram template.
ICS Org Chart Template
Our carefully crafted ICS Org Chart Template is an invaluable tool designed to clearly represent the hierarchical structure of the Incident Command System (ICS). It simplifies the complex web of roles, responsibilities, and chains of command within the ICS, providing a structured blueprint for both experienced professionals and those new to the system. The template's most notable benefit is its ability to foster immediate understanding, bridging the gap between intricate organizational structures and the teams navigating them. Teams that use this template can ensure that everyone is aligned, understands their role, and collaborates efficiently, thereby reducing potential bottlenecks and misunderstandings.
Euler Diagram Template
Works best for:
Business Management, Operations, Diagrams
Euler diagrams are valuable for showing different relationships between subjects by representing them with circles or "cells." Euler diagrams are frequently used in IT systems to show how objects relate to one another and how they interact. However, you can use them for any sort of explanation that needs to show connections.
Family Tree Template
Works best for:
Education, Mapping
Family trees help you make sense of complicated family relationships, even generations back. With this Family Tree Template, you can quickly and easily add your siblings, parents, and extended family members. Plus, add extra information, notes, and even images to create a vibrant family tree.
Task Analysis Diagram Template
Works best for:
Diagramming
The Task Analysis Diagram Template is a helpful tool that simplifies complex tasks by breaking them down into smaller, more manageable steps. This strategic approach brings clarity and ensures a systematic method for tackling complex user paths. The template's most significant advantage is its precision, as it maps out every detail of a task to guarantee that nothing is missed. This results in more efficient operations.
Turtle Diagram Template
Works best for:
Diagramming
The Turtle Diagram Template is an essential tool for capturing the essence of a process. It offers many benefits, but one stands out: it fosters clear and comprehensive communication within teams. By breaking down processes into digestible components, the template creates a common ground for discussion. It helps team members unfamiliar with certain processes or from different departments collaborate effectively by ensuring everyone's on the same page about the inputs, outputs, roles, resources, and procedures. This is crucial for organizations that aim to maintain coherence in quality management practices and drive collective efforts toward operational excellence.
4-Circle Venn Diagram Template
Works best for:
Diagramming, Mapping, Brainstorming
The 4-Circle Venn Diagram Template has an easy, interactive, and dynamic way to visualize complex relationships between data sets. Empower your team's collaboration and communication with this powerful tool.
2-Circle Venn Diagram Template
The 2 Circle Venn Diagram Template is a dynamic, intuitive tool designed to represent the logical relationships between two data sets visually. For teams, this template proves valuable in enabling efficient collaboration, clear communication, and shared understanding.
CI/CD Pipeline Diagram Template
Works best for:
Diagramming, Development
The CI/CD template is a well-designed roadmap for software deployment that enables a smooth and automated flow from development to production. This strategic layout includes critical elements such as source code management, automation servers, container orchestration, staging environments, and the final deployment to production. One of the key benefits of using such a template is that it builds a robust deployment pipeline, which significantly reduces manual intervention and human error. By visualizing each step and integrating automation throughout, teams can achieve faster deployment cycles, ensuring that new features, updates, and fixes are delivered to users promptly and reliably. This enhanced pace does not compromise quality, as the template inherently supports continuous testing and quality assurance, ensuring that each update is quick but also secure and stable before it is delivered to the end user.
Genogram Template
Works best for:
Diagramming
The Genogram Template maps out family structures and relationships with exceptional depth and detail. Unlike traditional family trees, this template provides a comprehensive perspective by encapsulating familial connections, emotional ties, and significant life events. Create a genogram to unearth patterns and trends within a family, whether hereditary or environmental. Professionals across different domains can gain a holistic understanding of familial dynamics by showing deep insights into the nuances of relationships, facilitating better communication and problem-solving.
Business Intelligence Architecture Template
Works best for:
Diagramming
The Business Intelligence Architecture Diagram Template in Miro visually maps the complex landscape of business intelligence systems. With elements encompassing data sources, warehouses, ETL processes, tools, and end-user interfaces, the template enables users to communicate complex concepts with clarity. One standout feature is the template's dynamic adaptability, empowered by Miro's automated diagramming capabilities. This feature ensures that the diagram remains up-to-date with minimal effort, allowing users to effortlessly incorporate changes in data structures and processes, thus maintaining the relevance and accuracy of their visual representations over time.
Bubble Map Template
Works best for:
Diagramming, Mapping, Brainstorming
A Bubble Map Template is a visual organization tool that uses bubbles or circles to represent various ideas or data points. These bubbles are linked together, displaying their relationships and creating a network of interconnected thoughts. Use a Bubble Map Template to streamline complex information, enhancing comprehension and promoting efficient decision-making.
Context Diagram Template
Works best for:
Business Management, Mapping, Diagrams
A context diagram is a perfect tool to view an entire system as a single process and understand how external factors interact with it. These external factors can include customers, developers, management, and more. The Context Diagram Template is your tool for creating this diagram.
Cause and Effect Diagram Template
Works best for:
Diagramming
The Cause and Effect Diagram Template is a useful tool for analyzing complex relationships, identifying root causes of problems, and improving organizational processes. It can be customized to fit user's unique needs and provides a structured framework for analysis. Teams can use real-time collaborative analysis on the Miro platform to drive continuous improvement initiatives.
VRIO Analysis Template
Works best for:
Diagramming, Strategy
The VRIO Analysis Template is a framework that helps businesses evaluate their resources and capabilities for competitive advantage. It categorizes resources into four areas: Value, Rarity, Imitability, and Organization. This provides a comprehensive view of an organization's strengths and potential weaknesses. The template has the key benefit of offering quick visual insights. Decision-makers can immediately identify and focus on resources that are valuable, rare, hard to imitate, and well-organized. This ensures a sustainable competitive edge and saves time by avoiding lengthy textual analyses.
Critical Path Method Template
Works best for:
Diagramming, Project Management
Elevate your project management game with the Critical Path Method Template—an indispensable tool that brings clarity and precision to your project timelines. The template instantaneously adjusts as you edit tasks and dependencies, ensuring that your critical path is consistently up-to-date. This capability not only simplifies the complex process of project scheduling but also empowers your team to proactively respond to evolving project dynamics, fostering adaptability and efficiency throughout the project lifecycle.
Causal Loop Diagram Template
Works best for:
Diagramming
The Causal Loop Diagram Template offers a structured framework to visualize the intricate interconnections within any system. Its standout benefit is the ability to provide a holistic perspective, ensuring that users don't just see isolated issues but understand the entire web of relationships, ultimately leading to more informed and strategic decision-making.
Bracket Template
Works best for:
Diagramming
The Bracket Template is a dynamic visualization tool that helps to organize and rank ideas, entities, or teams in a sequential and competitive manner. It is structured like a tree, starting with multiple entries on either side, which then face off in successive rounds, leading to a single winner or conclusion. One of its standout benefits is its ability to simplify complex decision-making processes. Breaking down choices into smaller, head-to-head comparisons, makes the path to a final decision clearer, ensuring clarity and fostering engagement among participants. Moreover, the Bracket Template is particularly useful when there are multiple options to consider and when there is a need to compare and contrast those options. It is an effective way to streamline decision-making, making it easier and more efficient.
Force Field Analysis Template
Works best for:
Diagramming, Strategic Planning
A Force Field Analysis Template is a powerful tool that helps teams identify and analyze the forces supporting or hindering progress toward a specific change or goal. This template provides a visual space where you can brainstorm and plot out 'driving forces' that push objectives forward and 'restraining forces' that prevent advancement, all on a single, intuitive board. One of the primary benefits of utilizing the Force Field Analysis template is that it fosters a shared understanding among team members. By visually mapping out and discussing each force, teams can prioritize efforts, build consensus on the central issues to tackle, and collaboratively devise strategic plans to strengthen positive influences while reducing negative ones.
Web Diagram Template
Miro's Web Diagram Template simplifies complex project organization and promotes effective communication. It allows users to easily connect elements and gain a comprehensive understanding of complex relationships, making it a versatile and invaluable asset for diverse projects.
Pie Chart Template
Works best for:
Education, Operations
Pie charts are an excellent way to present relationships between datasets graphically, where you can quickly compare information and see contrast right away. Professionals from many fields use pie charts to support their presentations and enrich their storytelling as it’s one of the most commonly used data charts.
Cladogram Template
Works best for:
Diagramming
The Cladogram Template offers seamless adaptability, empowering users to change, expand, and refine evolutionary representations with ease. Its intuitive interface and automated features ensure dynamic and responsive diagrams that keep up with evolving knowledge. Say goodbye to static diagrams and welcome fluidity and adaptability with Miro's Cladogram Template.
LUMINAI Refinery Advisor on AWS Template
Works best for:
AWS
The LUMINAI Refinery Advisor on AWS template streamlines and optimizes refinery operations through AWS. It provides a structured approach to setting up and managing AWS services, tailored specifically for engineers, developers, and data scientists in the refinery sector. This template not only saves time and effort by offering a predefined structure and best practices but also allows for customization to meet specific operational needs. With its focus on enhancing data processing capabilities, the LUMINAI Refinery Advisor on AWS template is an invaluable resource for improving the efficiency, effectiveness, and optimization of refinery processes on the AWS platform.
UML Class Content Management System (CMS) Template
Works best for:
UML
The UML Class Content Management System CMS Template simplifies documenting and designing the architecture of a Content Management System. It allows for the creation of UML class diagrams to visualize the structure of a CMS. Teams can efficiently map out key classes and their interactions, such as how users create, manage, and publish digital content. The template's integration into Miro's collaborative platform allows for real-time teamwork, customization, and easy sharing of feedback. This streamlines the documentation process and is valuable for software development projects aiming to develop or refine a CMS.
Flowchart Template
Works best for:
Flowcharts, Mapping, Diagrams
Trying to explain a process or workflow to your team — or just wrap your head around it yourself? Sometimes the best way is to see it, and that’s when you create a flowchart. Using common shapes (generally just ovals, rectangles, diamonds, and arrows), a flowchart shows you the direction a process or workflow goes and the order of steps. Beyond giving you a clear understanding, you’ll also be able to see potential flaws and bottlenecks, which helps you refine and improve your process and create a better product more efficiently.
Affinity Diagram Template
Works best for:
Desk Research, Mapping, Product Management
You can use an affinity diagram to generate, organize, and consolidate information that comes out of a brainstorming session. Whether you’re building a product, working through a complex problem, establishing a process, or piecing apart an issue, an affinity diagram is a useful and simple framework that gives each team member the opportunity to pitch in and share their thoughts. But it’s not just ideal for brainstorms—this is a great template and tool when you need to reach consensus or analyze data such as survey results.
UML Diagram Template
Works best for:
Diagrams, Software Development
Originally used as a modeling language in software engineering, UML has become a popular approach to application structures and documenting software. UML stands for Unified Modeling Language, and you can use it to model business processes and workflows. Like flowcharts, UML diagrams can provide your organization with a standardized method of mapping out step-by-step processes. They allow your team to easily view the relationships between systems and tasks. UML diagrams are an effective tool that can help you bring new employees up to speed, create documentation, organize your workplace and team, and streamline your projects.
Swimlane Diagram Template
Works best for:
Flowcharts, Diagrams, Workflows
A swimlane diagram shows you which stakeholders are responsible for each area of your critical processes. You can use it to understand current processes or plan new ones.
AWS Cloud Infrastructure Optimization Template
Works best for:
AWS , Diagramming
The AWS Cloud Infrastructure Optimization Template is part of Miro's Intelligent Templates collection, designed to streamline and enhance the management of your AWS cloud resources. This template leverages Miro's advanced diagramming tools and integrates seamlessly with AWS to provide real-time data visualization, cost analysis, and performance optimization. One key benefit of using this template is its ability to auto-generate detailed diagrams of your current AWS setup, providing a clear visual representation of your architecture. This feature saves time and reduces the manual effort required to visualize and optimize your AWS infrastructure, making it easier to manage and scale your cloud resources effectively.
Vertical Organizational Chart
Works best for:
Organizational Charts, Organizational Design
The Vertical Organizational Chart Template is an efficient way to illustrate the hierarchy of an entity in a top-down format. This tool helps represent roles and relationships in a clear manner, starting from the topmost authority and branching downwards. It allows for a better understanding of the flow of responsibilities and communication channels within the organization. One of its most significant advantages is promoting clear communication. Depicting the organization's structure helps avoid misunderstandings and ensures everyone is on the same page regarding the chain of command.
Azure Architecture Diagram Template
Works best for:
Software Development, Diagrams
The Azure Architecture Diagram Template is a diagram that will help you visualize the combination of any data and build and deploy custom machine learning models at scale. Azure is Microsoft’s cloud computing platform, designed to provide cloud-based services such as remote storage, database hosting, and centralized account management. Use Azure Architecture Diagram template to build sophisticated, transformational apps.
Fault Tree Analysis Template
Works best for:
Diagramming
The Fault Tree Analysis Template visually breaks down potential system malfunctions, highlighting complex causal relationships between faults. One of its standout benefits is its ability to enhance clarity in complex scenarios, allowing professionals to swiftly pinpoint root causes and prioritize interventions, ensuring a more streamlined approach to problem-solving.
Brace Map Template
Works best for:
Diagramming, Planning
Transform your brainstorming and planning tasks with Miro's Brace Map Template. This powerful visual thinking tool clarifies complex concepts by creating a visual hierarchy that organizes each element precisely. The central idea connects seamlessly to sub-elements through intuitive braces, providing an easily understandable framework. This clarity enhances individual understanding and fosters collaborative efforts, allowing teams to navigate complex ideas with precision and coherence. The Brace Map Template will enable you to organize your thoughts efficiently and solve complexities visually.
Spider Diagram Template
Works best for:
Diagramming, Mapping
Perfect for brainstorming sessions, project planning, or simply organizing thoughts, the Spider Diagram Template allows you to create 'legs' branching out from a central idea, representing related topics or subtopics.
Production Flowchart Template
Works best for:
Flowcharts
The Production Flowchart Template is a well-crafted tool that clearly represents a production process from start to finish. It breaks down complex procedures into easy-to-understand segments, making it easier for stakeholders to grasp the entire process. One of the key benefits of using this template is that it helps to clarify complex production pathways. By mapping out operations visually, teams can identify potential bottlenecks or inefficiencies, facilitating timely and well-informed decision-making.
Login Sequence Diagram Template
Works best for:
Diagramming, Technical Diagramming
The UML Sequence Login Diagram Template is a valuable tool for visualizing user authentication processes. It breaks down complex login sequences into clear, visual components, facilitating collaborative understanding among team members, regardless of their technical expertise. This shared understanding is crucial for ensuring all stakeholders, from developers to project managers, are on the same page, leading to efficient decision-making and a smoother development process. The template's ability to translate technical details into an accessible format streamlines communication and significantly reduces the likelihood of misinterpretation or oversight, making it an essential asset in any software development project.
Pyramid Diagram Template
Works best for:
Business Management, Strategic Planning, Prioritization
A pyramid diagram is a perfect tool for demonstrating concepts that can be broken down into a layered hierarchy. Each level of the pyramid builds on the one before it, clearly illustrating how certain actions lead to specific results. The Miro Pyramid Diagram template is your tool for any and all pyramid illustrations.
Security Automations for AWS WAF Template
The Security Automations for AWS WAF template is designed to streamline the process of enhancing the security of your AWS applications. It allows teams to collaboratively design, visualize, and refine AWS WAF configurations to protect against common web exploits effectively. This template includes various components such as automated deployment pipelines, instance schedulers, and serverless image handlers, providing a robust framework for managing AWS WAF security automations. By using this template, teams can improve collaboration, achieve a clear visual representation of their AWS WAF configurations, enhance efficiency in managing AWS WAF rules, and customize the template to meet specific application security needs.
Dichotomous Key Template
Works best for:
Diagramming
The Dichotomous Key Template stands out as an exceptional tool for simplifying complex classification processes, significantly enhancing learning experiences. Breaking down intricate subjects into a series of binary decisions transforms how information is absorbed and understood. This systematic approach not only aids in retaining intricate details but also makes the learning process more engaging and interactive. Whether for educational purposes or professional use, the template’s design fosters a deeper comprehension of the subject matter, allowing learners and professionals to navigate complex scenarios with clarity and ease.
Driver Diagram Template
Works best for:
Diagramming
The driver diagram template is a strategic visual tool that helps teams map out their primary objectives and break them down into actionable components. It presents goals, drivers, and specific change ideas in a coherent and interconnected format, ensuring clarity of objective. By doing so, every team member is aligned towards a common endpoint, fostering unified efforts. The visual nature of the template simplifies complex objectives, making it easier for teams to stay on track and measure their progress effectively.
Current State vs. Future State Flowchart Template
Works best for:
Diagramming
The Current State vs Future State Flowchart Template is an essential tool for strategic planning, providing teams with a dynamic and visual roadmap for organizational transformation. One of its key benefits is streamlining collaboration by using swimlanes to allocate tasks to specific departments. This feature promotes accountability and transparent communication, ensuring everyone is aligned on their responsibilities. As a result, teams can navigate complex processes with ease, fostering a shared understanding of the current and future states, ultimately leading to efficient and collaborative decision-making.
Cisco Data Network Diagram Template
Works best for:
Software Development
Cisco offers data center and access networking solutions built for scale with industry-leading automation, programmability, and real-time visibility. The Cisco Data Network Diagram uses Cisco elements to show the network design of Cisco Data Networks visually.
Cisco Network Diagram Template
Works best for:
Software Development, Diagrams
Cisco offers data center and access networking solutions built for scale with industry-leading automation, programmability, and real-time visibility. The Cisco Data Network Diagram uses Cisco elements to show the network design of Cisco Data Networks visually.
Datavant Switchboard with AWS Clean Rooms Template
Works best for:
AWS
The AWS Datavant Switchboard Clean Rooms Template integrates health data sources using Datavant's secure data connection capabilities and AWS Clean Rooms' scalable data processing environment. It's useful for professionals in engineering, database management, and development. The customizable Miro interface streamlines secure and efficient data handling and team collaboration for a wide range of projects.
Cisco Recommended Security Architecture Template
Works best for:
Software Development, Diagrams
Cisco offers data center and access networking solutions built for scale with industry-leading automation, programmability, and real-time visibility. The Cisco Recommended Security Architecture uses Cisco elements to visually show the network design of Cisco networks.
Cross-Account EC2 Status Monitoring for HPC Clusters Template
Works best for:
AWS
The Cross-Account EC2 Status Monitoring for HPC Clusters Template provides a centralized view of the health and performance of EC2 instances across multiple AWS accounts. It helps in early issue detection, reducing downtime and ensuring optimal efficiency of HPC clusters. The template offers customization options to meet specific HPC cluster configurations, simplifying monitoring and improving operational efficiency for administrators.
On-Premise to Cloud Migration Process Flowchart Template
Works best for:
Flowcharts
The On-Premise to Cloud Migration Process Flowchart Template is a strategic tool designed to streamline the transition from traditional on-premise systems to more flexible, scalable cloud-based solutions. This template acts as a visual roadmap, guiding teams through each phase of the migration process with clarity and precision. By breaking down the migration into manageable steps, it ensures a comprehensive approach, minimizing risks and aligning with best practices for cloud adoption.
Incident Management Process Flowchart Template
The Incident Management Process Flowchart Template in Miro is designed to streamline and clarify the process of managing incidents within an organization. This template serves as a visual guide that outlines the steps involved in incident management, from the initial declaration to the final review. It is a living document, continuously evolving based on feedback and lessons learned from past incidents, ensuring that the process remains up-to-date with best practices. By defining incidents as disruptions requiring a coordinated response to restore service levels, the template emphasizes the importance of a structured, organized, and timely approach. It covers various phases such as Incident Declaration, Assessment, Response, Communication, and Review, providing a clear framework for teams to follow.
Product Development Process Flowchart Template
The Product Development Process Flowchart Template is a strategic tool designed to guide teams through the intricate journey of bringing a new product to market. This template serves as a visual roadmap, outlining each critical step in the product development lifecycle, from initial concept and design to testing, refinement, and eventual launch. It's structured to foster clarity, ensuring that all team members are aligned and aware of their roles and responsibilities at every phase.
ERD Blogging System Template
Works best for:
ERD
The ERD Blogging System template in Miro efficiently manages and organizes digital content. It features key entities such as User, Post, Comment, Category, Tag, and File, which are essential for managing the creation and publication of blog posts, engaging users through comments, and organizing content via categories and tags. Additionally, it supports media attachments through the File entity, linking them to the relevant content. This template helps streamline the blogging process, making it an invaluable tool for content management and publication.
ERD Customer Relationship Management (CRM) Template
Works best for:
ERD, CRM
The ERD Customer Relationship Management (CRM) template streamlines and enhances the management of customer relationships within businesses. It focuses on organizing customer information and interactions in a visually intuitive manner. Key entities such as Customer, Interaction, Sales Opportunity, Product, and Support Ticket are central to the template, facilitating the tracking of customer relationships, sales funnel activities, product purchases, and customer service interactions. This structured approach is critical for boosting customer satisfaction and optimizing sales strategies, making the ERD CRM template an invaluable asset for businesses aiming to improve their CRM processes.
ERD Supply Chain Management System Template
Works best for:
ERD
The ERD Supply Chain Management System Template streamlines and optimizes supply chain operations. It serves as a visual support that helps businesses understand and manage the complex relationships between different entities within their supply chain, such as suppliers, products, inventory, orders, and shipments. By providing a clear visualization of these relationships, the template enables users to identify inefficiencies and areas for improvement, facilitating strategic decision-making.
ERD Educational Learning Management System Template
Works best for:
ERD
The ERD Educational Learning Management System Template is designed to streamline the management and organization of educational systems, particularly useful for institutions adapting to online and hybrid learning environments. It helps in efficiently planning and implementing Learning Management System (LMS) features by identifying key entities such as Students, Courses, Instructors, Assignments, and Grades, and the relationships between them.
Entity–Relationship Diagram (ERD) HR Management System Template
Works best for:
ERD
The Entity–Relationship Diagram (ERD) HR Management System Template in Miro is designed to streamline the management of employee-related information and processes within an organization. This template allows for the visualization and organization of complex HR systems, making it easier to understand relationships and processes. It enables users to map out departments, positions, and employee details, including attendance records, payroll, and performance reviews.
UML Use Case Online Shopping System Template
Works best for:
UML
The Online Shopping System Template simplifies the process of documenting and visualizing how users interact with an online shopping system. It provides a standard way to map out user interactions, such as product listings, inventory management, shopping carts, order processing, payments, and shipping details. By using this template, teams can collaborate effectively in real-time or at different times, adjusting the diagram to meet their project's specific needs. This not only improves clarity and efficiency but also fosters better communication among team members and stakeholders, ensuring a thorough understanding of the system's design and requirements.
Gantt Chart Template
Works best for:
Project Management, Mapping, Roadmaps
Simplicity, clarity, and power — that’s what make Gantt charts such a popular choice for organizing and displaying a project plan. Built upon a horizontal bar that represents the project progress over time, these charts break down projects by task, allowing the whole team to see the task status, who it’s assigned to, and how long it will take to complete. Gantt charts are also easily shareable among team members and stakeholders, making them great tools for collaboration.
Join thousands of teams collaborating and doing their best work on Miro.
Sign up freeAbout the Diagram Templates Collection
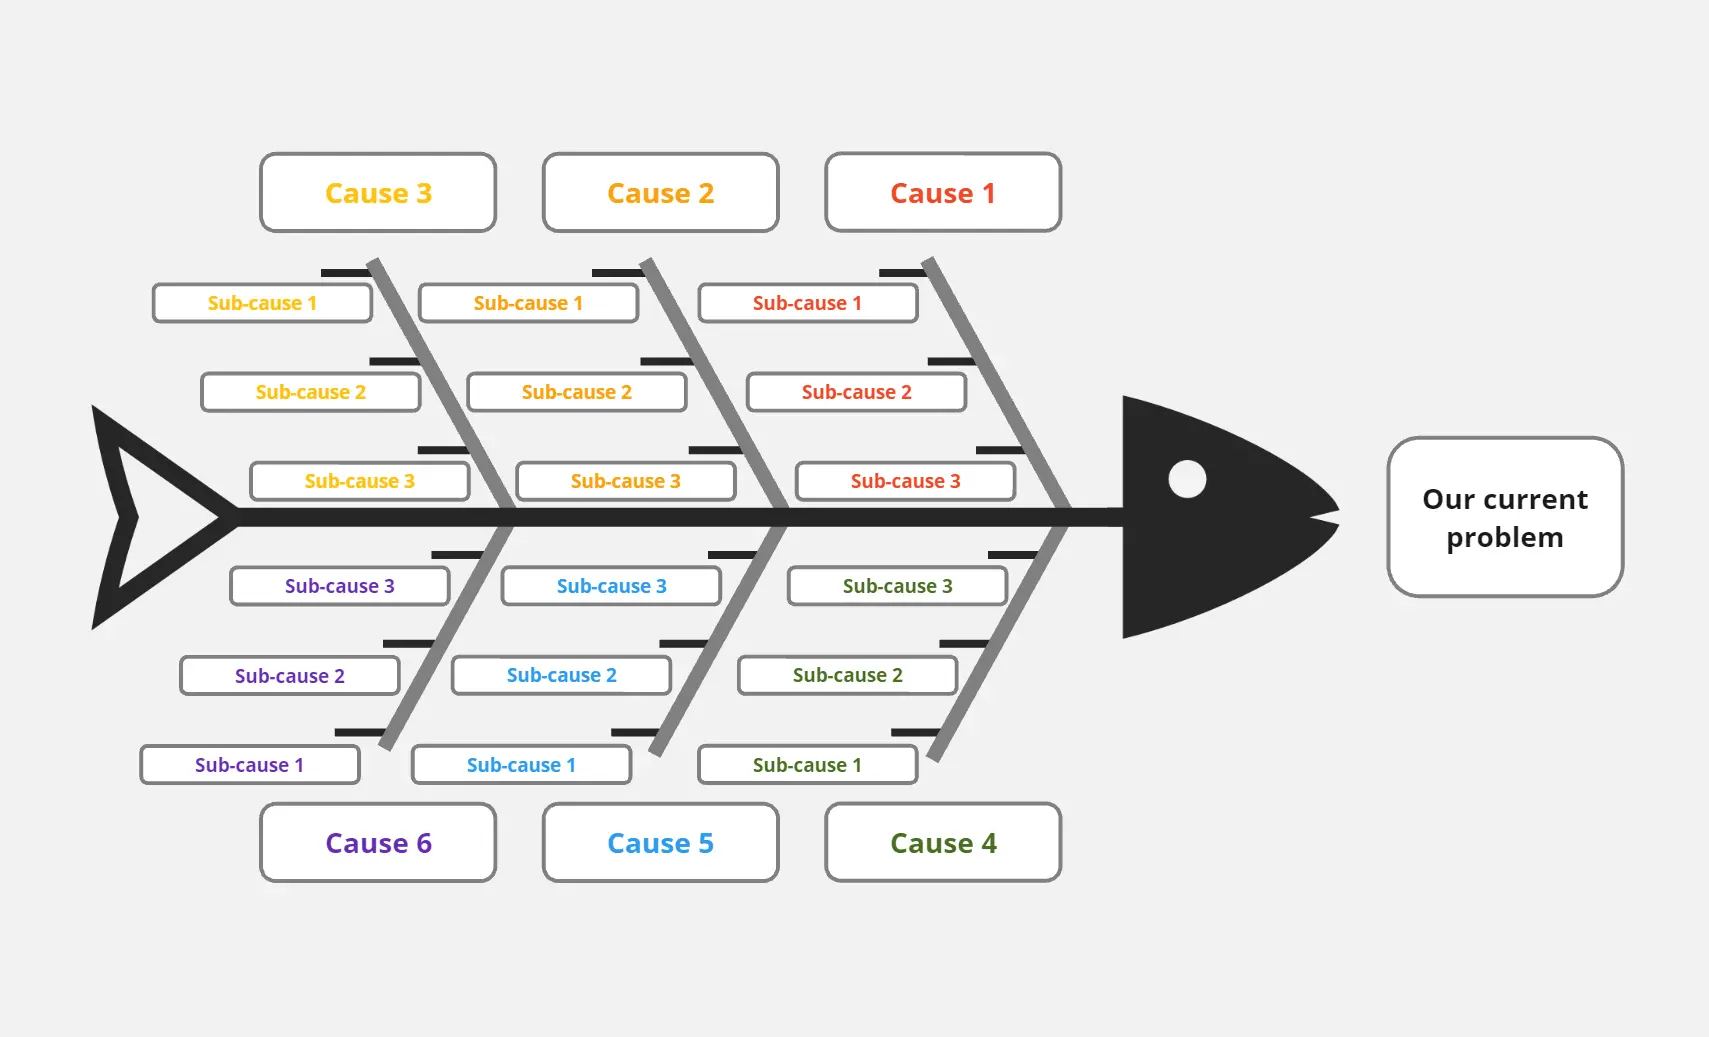
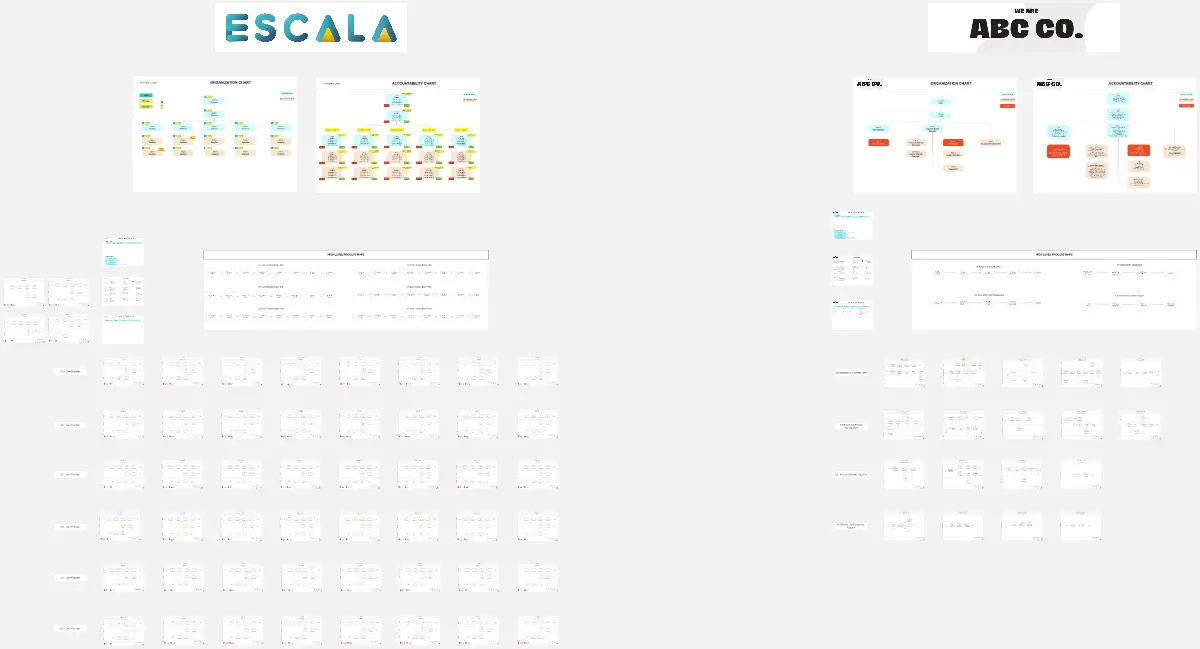
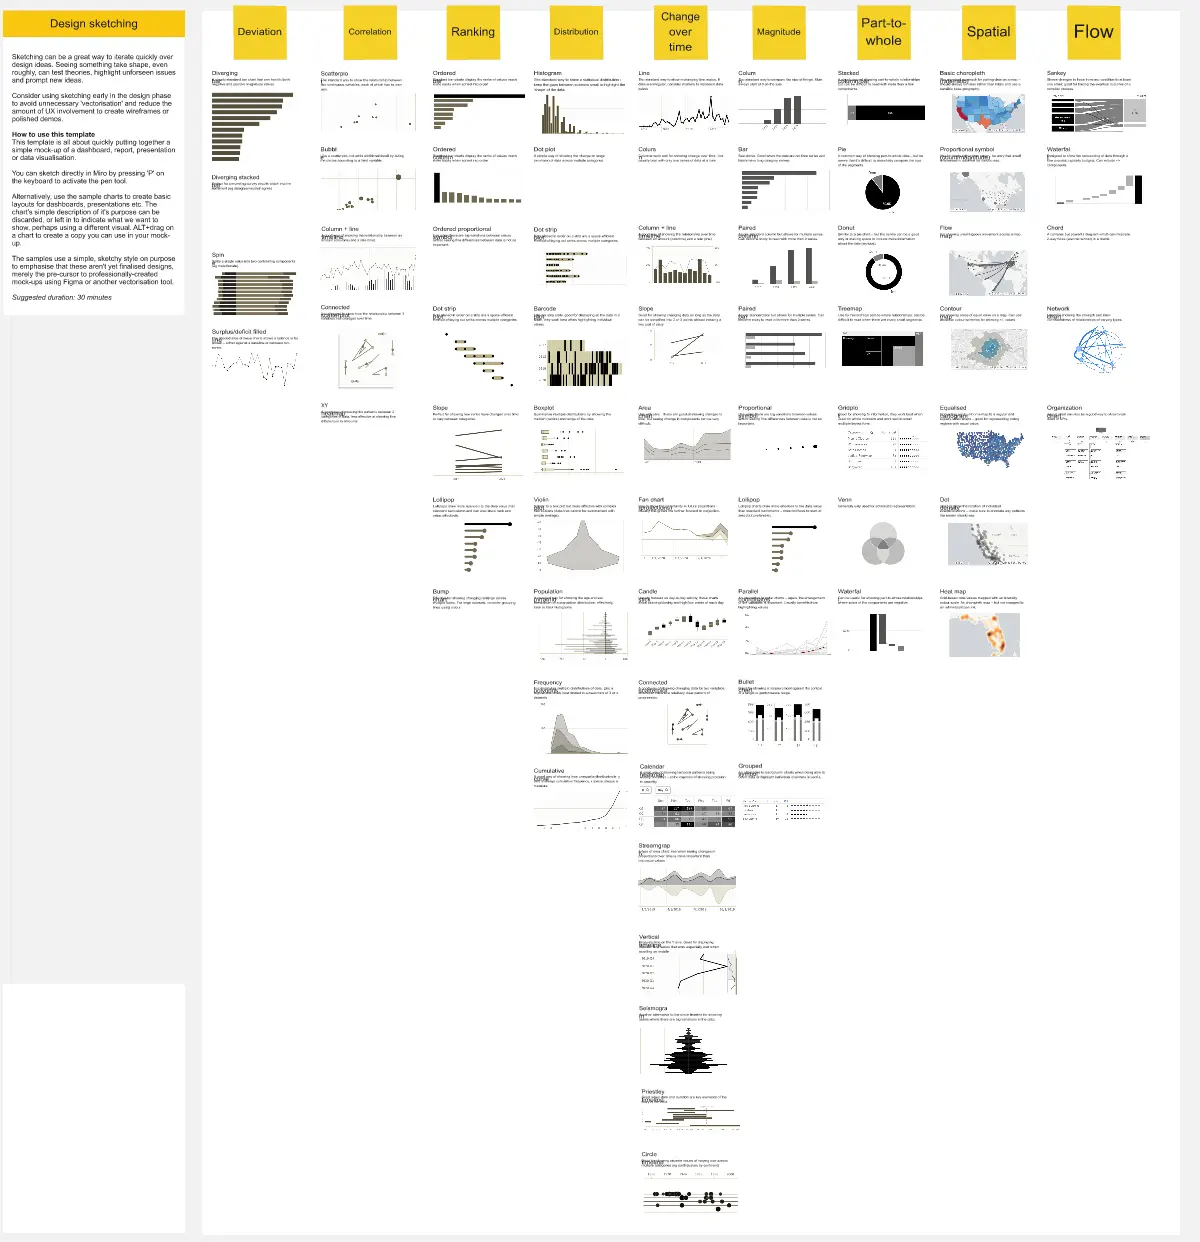
Miro's diagram templates collection is designed to simplify the process of creating visual representations of data, ideas, and processes. Whether you're mapping out a complex system, identifying root causes, or comparing different sets of data, our templates provide a structured and efficient way to visualize your thoughts. The collection includes a variety of templates, such as Venn diagram templates, fishbone diagram templates, and many more, each tailored to meet specific needs and use cases.
Why you'll love our diagram templates
Using Miro's diagram templates offers many benefits:
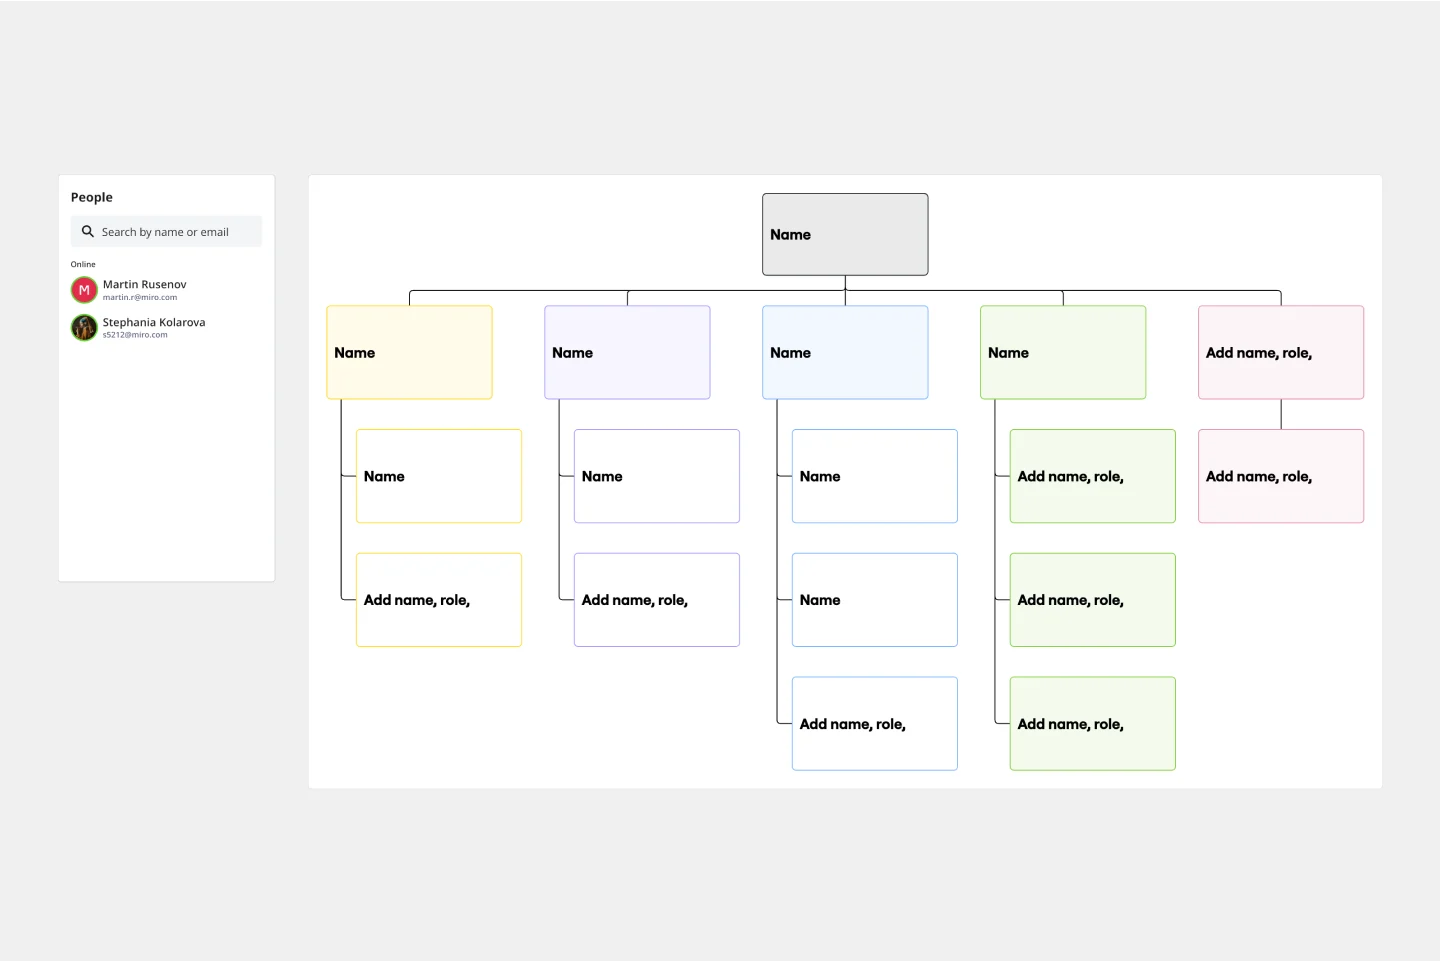
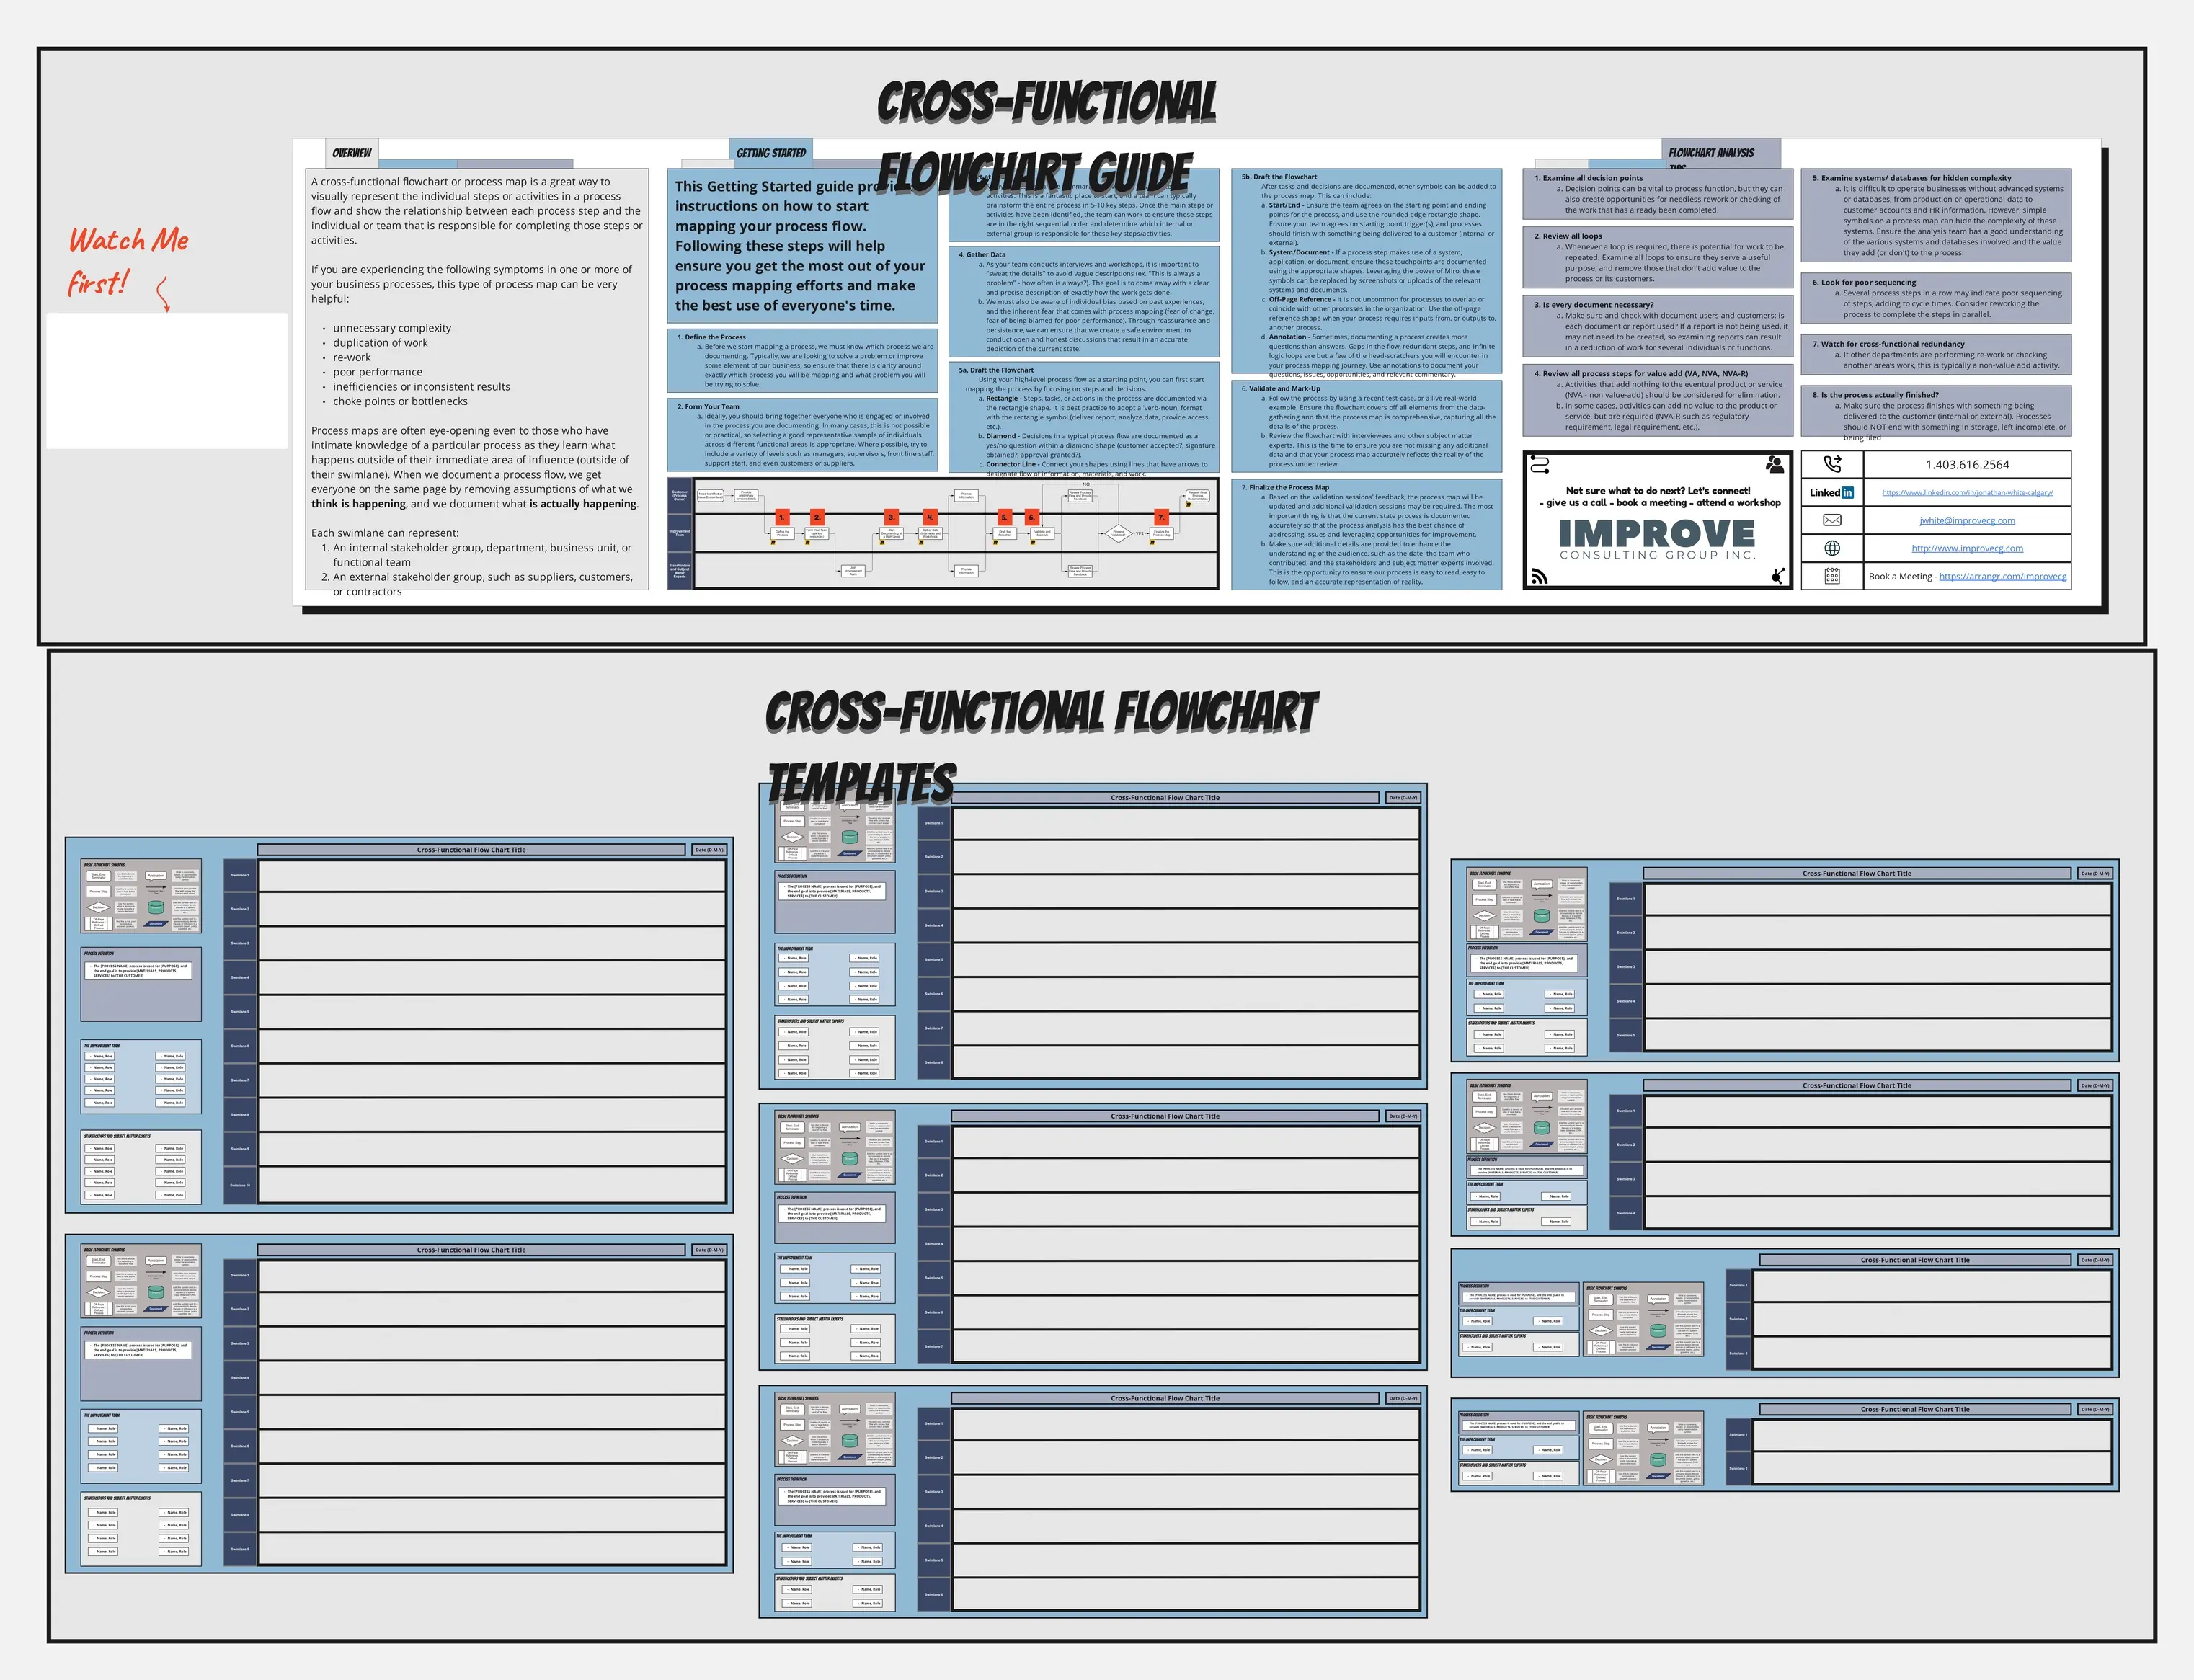
Efficiency: Create professional diagrams easily using various diagram examples. You don’t have to start from scratch. Choose from a variety of templates and tools to customize your diagrams to meet your needs. Whether you need flowcharts, organizational charts, or network diagrams, these examples will help you focus on the content.
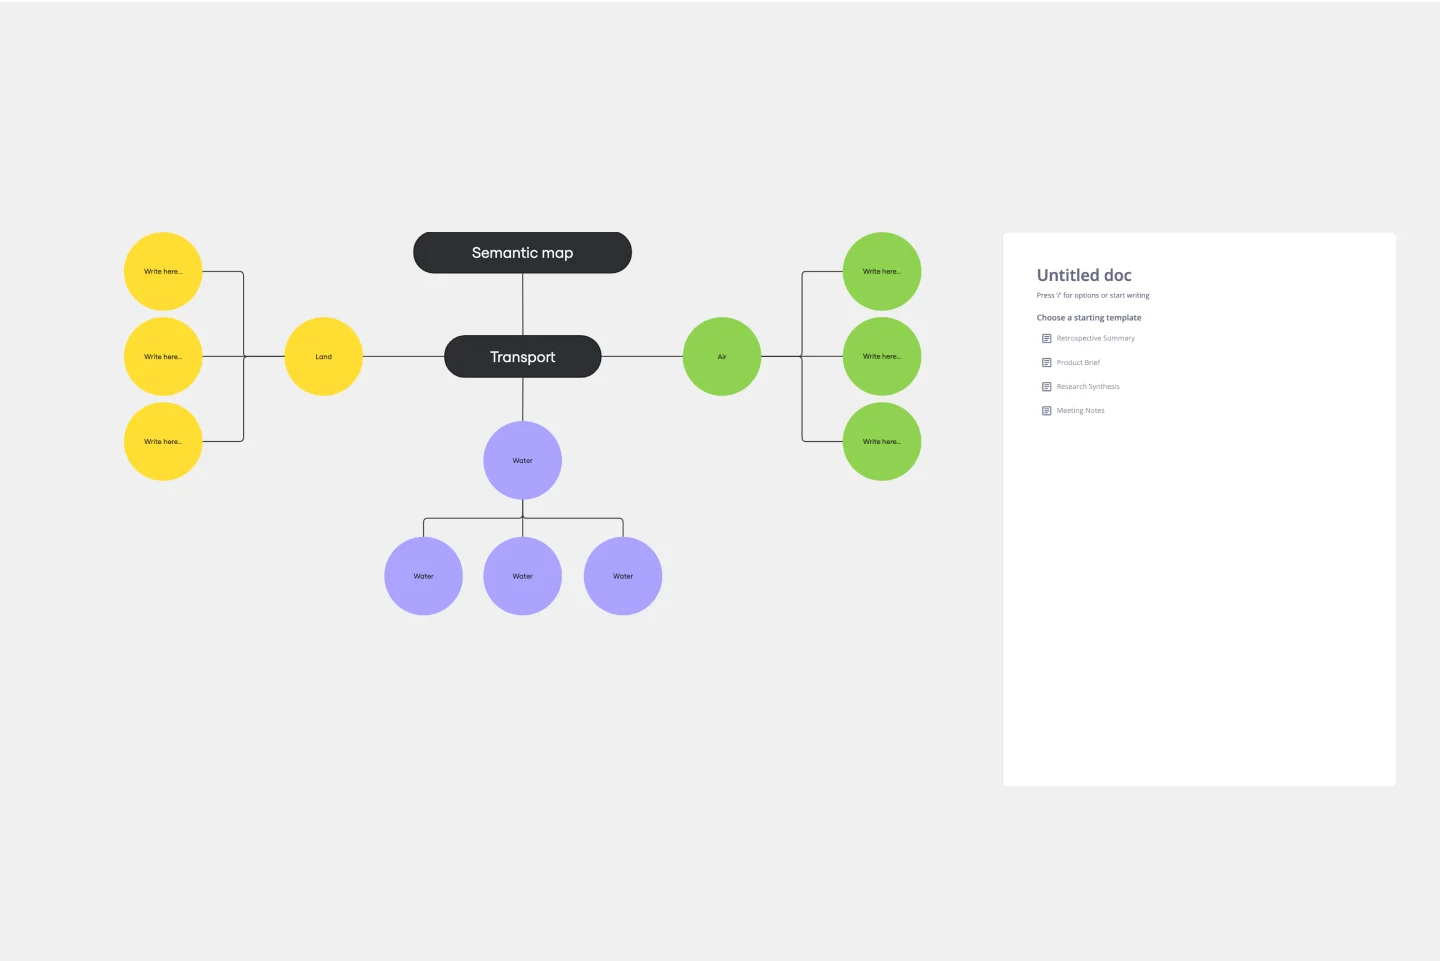
Clarity: Transform complex and multifaceted information into a format that is accessible and easily understandable, ensuring that the key concepts are clearly highlighted and simplified for better comprehension.
Collaboration: Work with your team in real time, no matter where they are. Using templates makes it easier to collaborate, they provide a clear structure for your projects. With Miro's diagram templates help everyone share ideas, give feedback, and stay on the same page. This way, your team can work together effectively and stay productive.
Customization: Easily change templates to fit your specific needs.
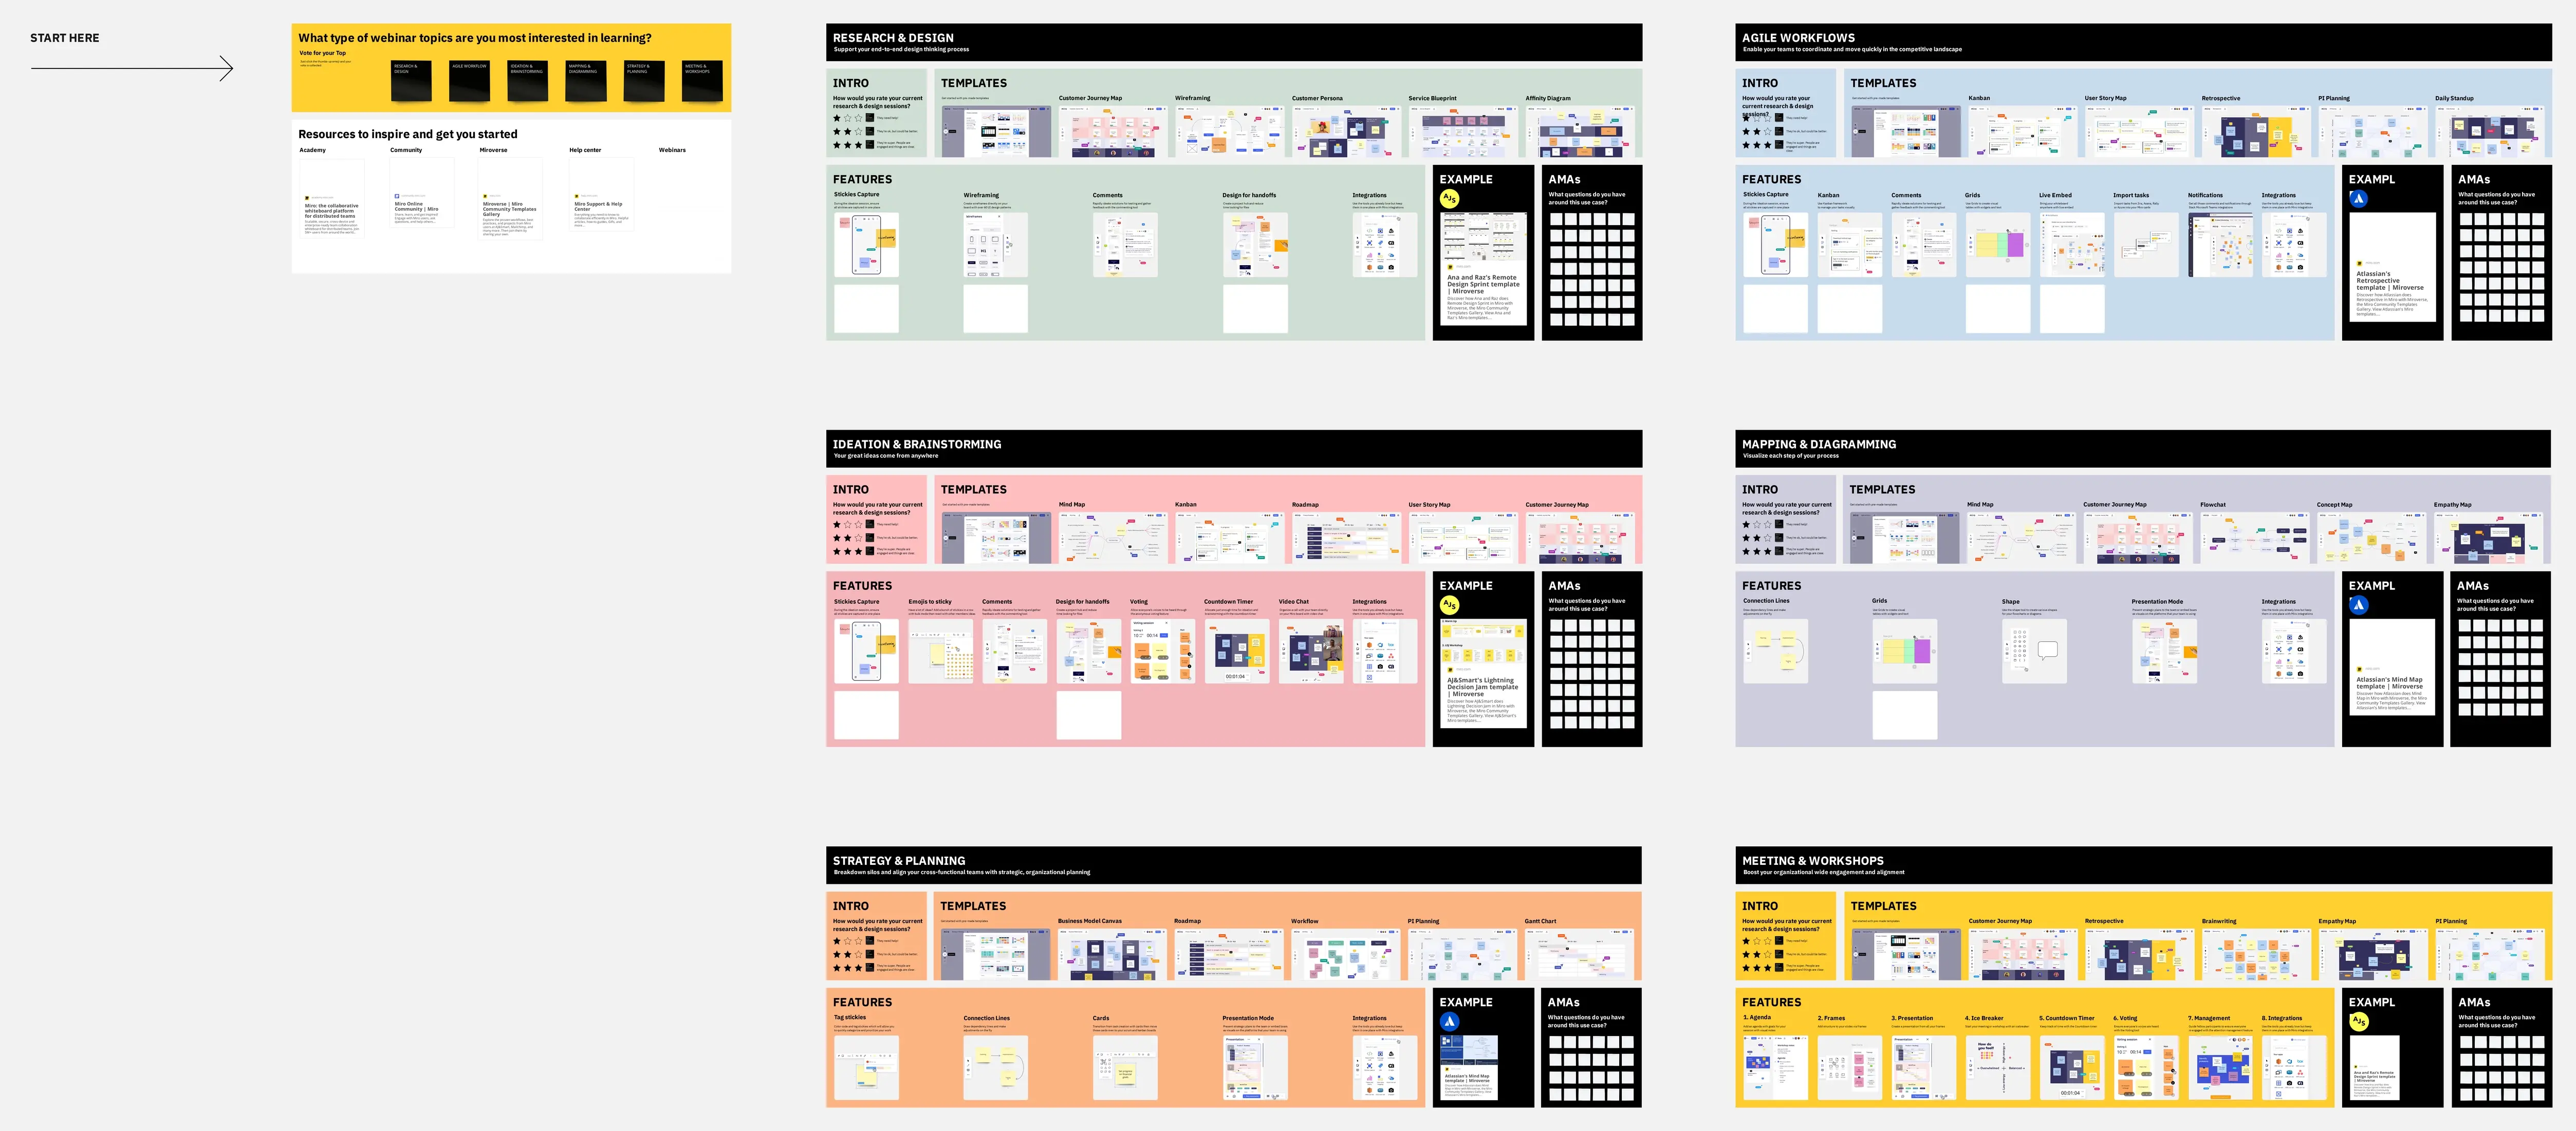
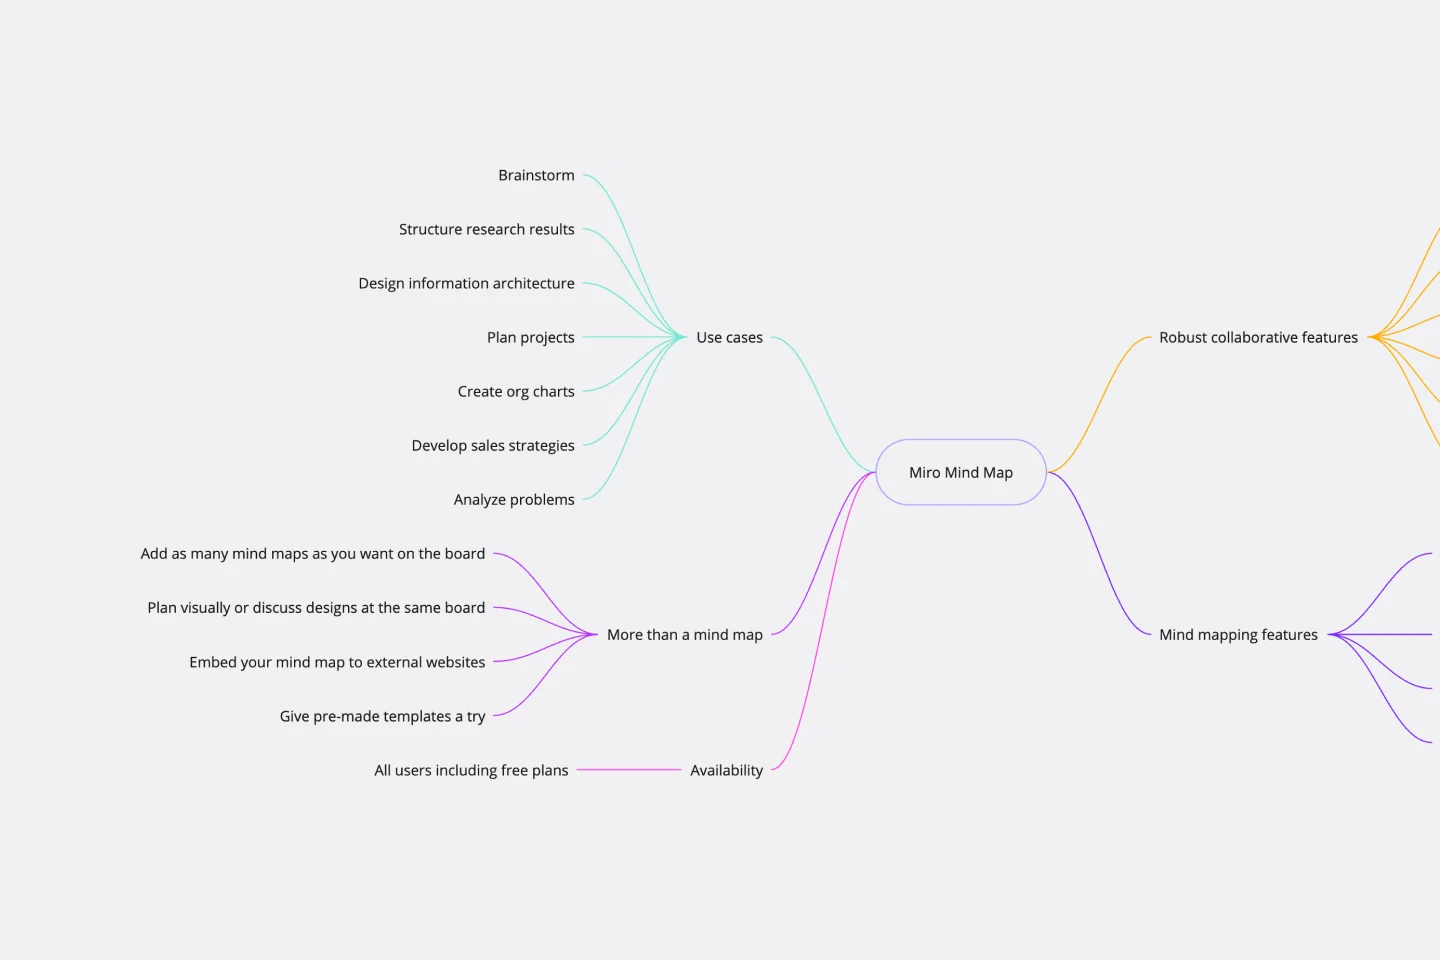
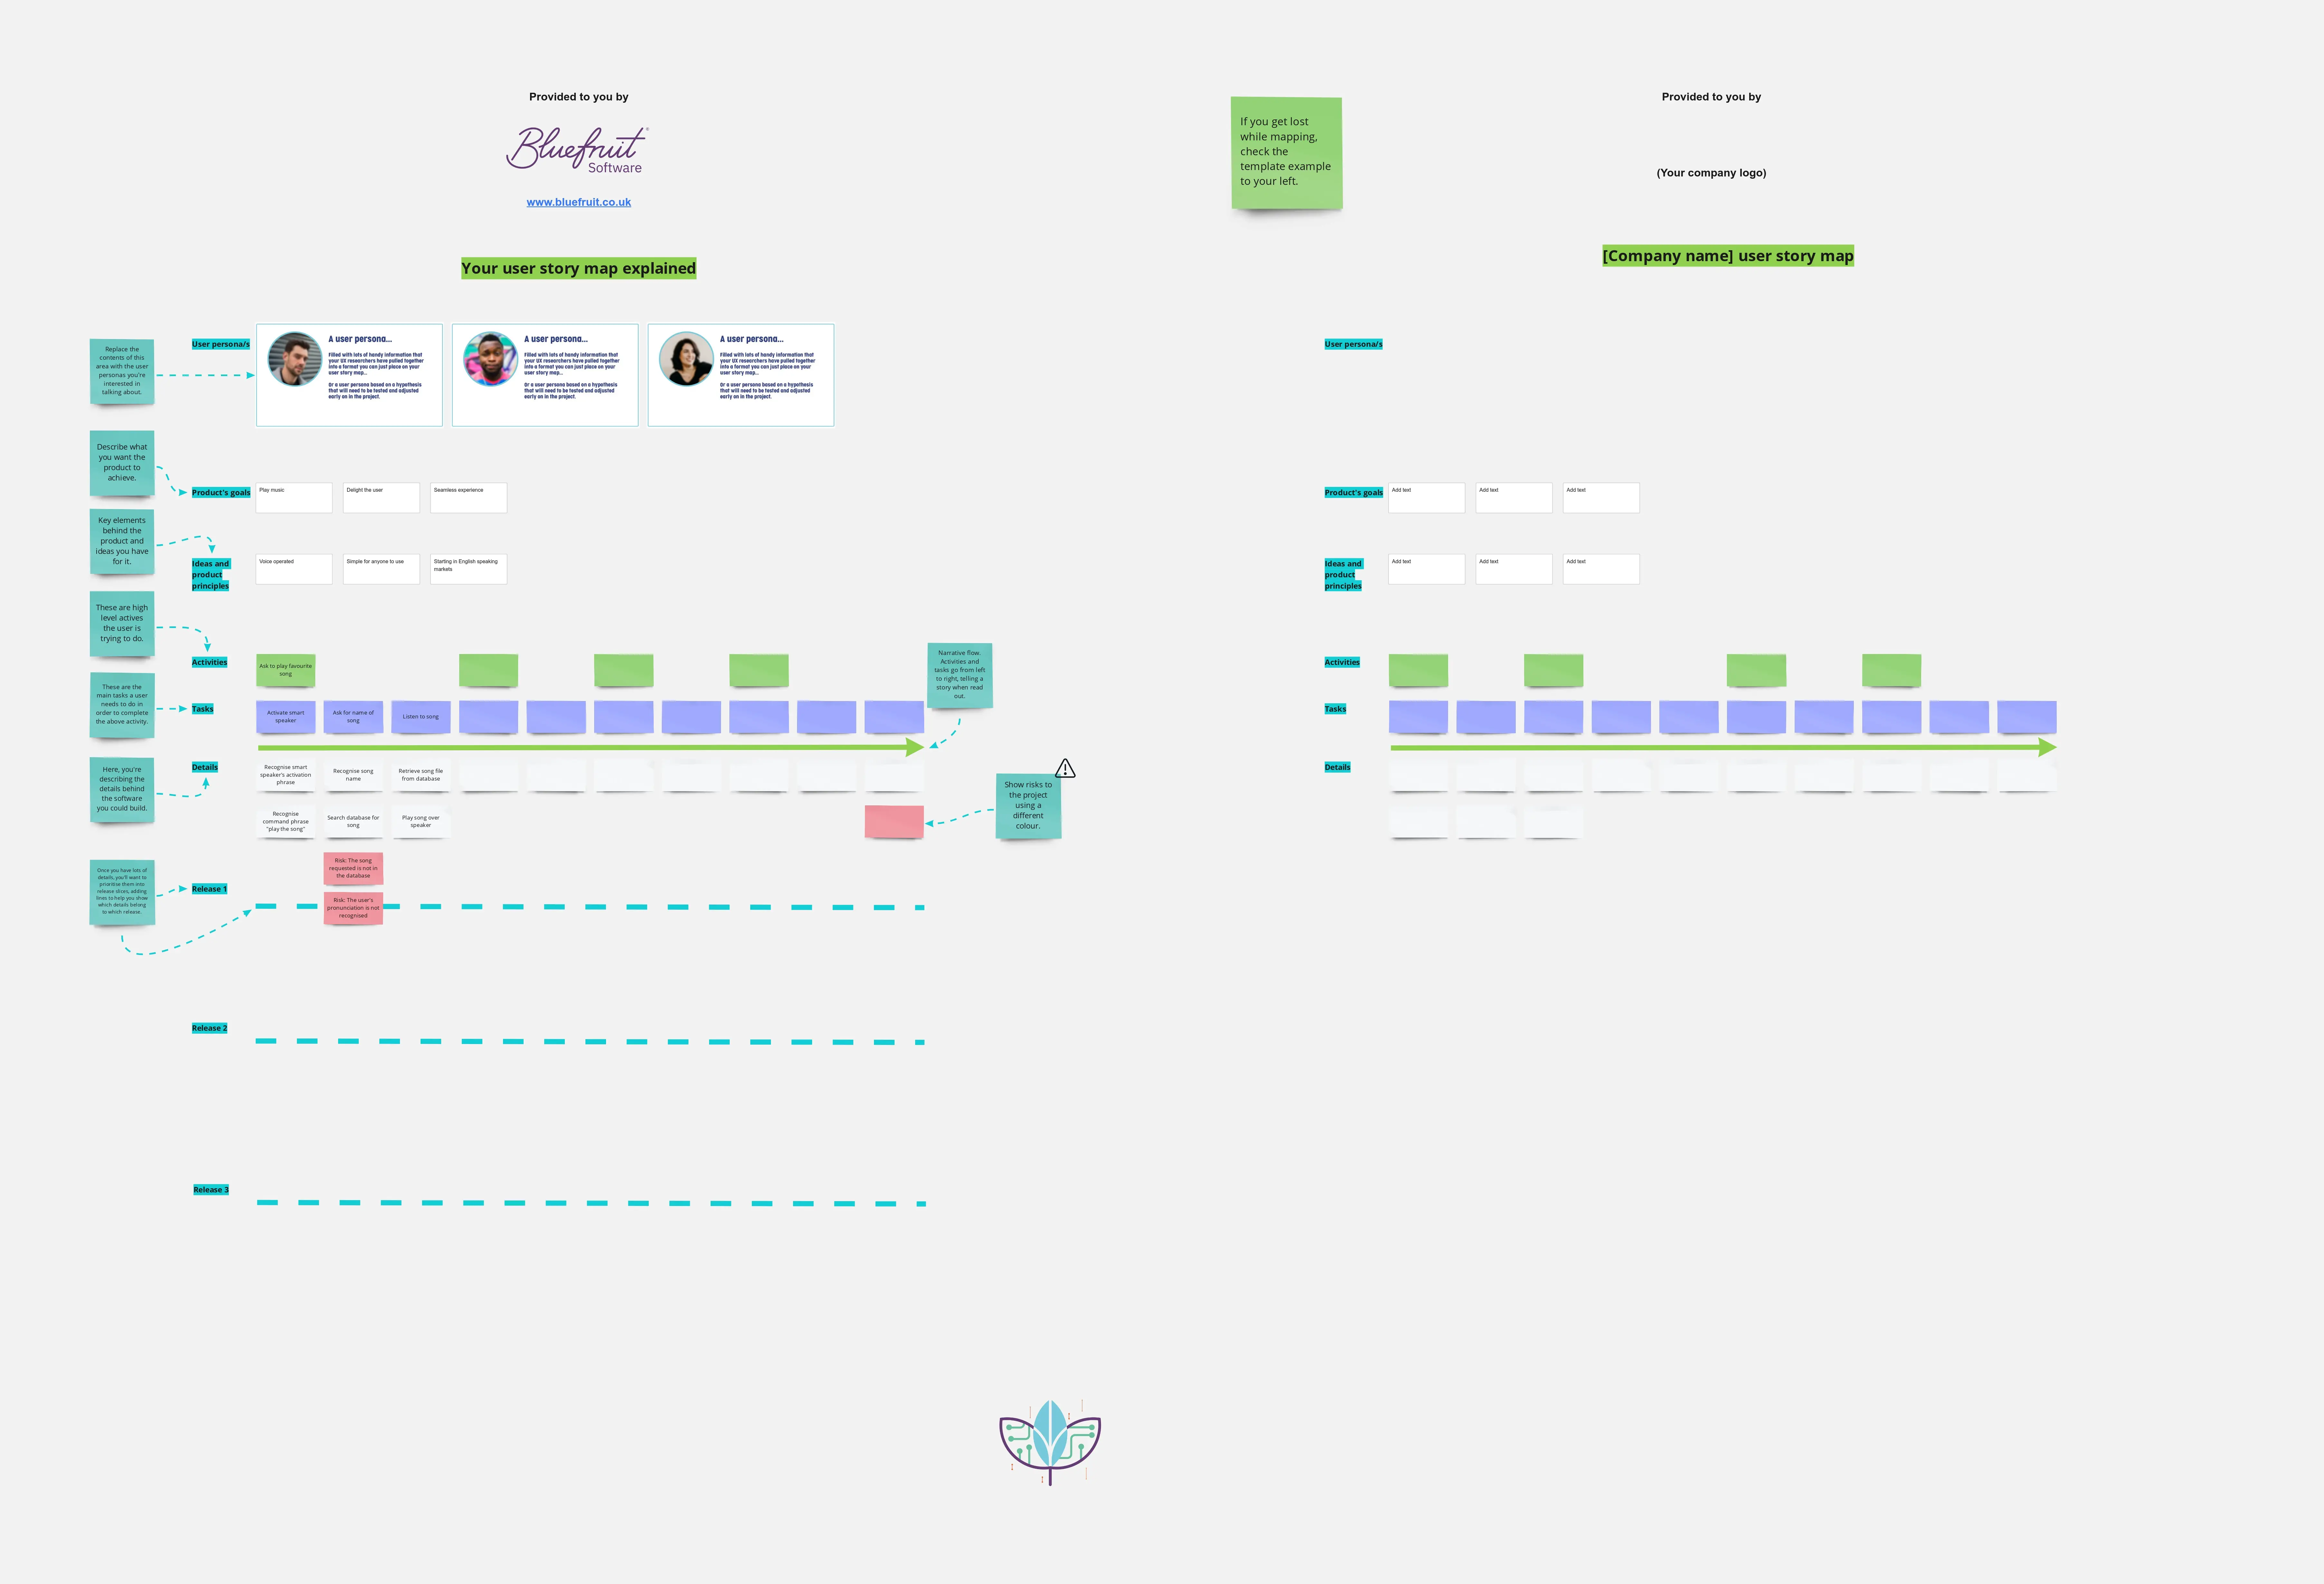
Versatility: Miro's diagram templates are suitable for various use cases, including brainstorming sessions, detailed process mapping, and creating web diagram templates. They help clarify connections and structures, enhancing teamwork and creativity across different tasks.
How to use the diagram templates in Miro
Choose a template: Select the diagram template that best fits your needs. For example, choose a Venn diagram template to compare and contrast different sets of data.
Customize your diagram: Use Miro's intuitive tools to add, remove, or modify elements within the template. You can change colors, add text, and insert images to make the diagram your own.
Collaborate with your team: Share the diagram with your team and collaborate in real time. Use comments and sticky notes to gather feedback and make adjustments on the fly.
Save and share: Once your diagram is complete, save it to your board and share it with stakeholders. You can export it in various formats or integrate it into other tools and platforms.
Miro's diagram templates empower teams to visualize their ideas and processes effectively, fostering collaboration and innovation. By leveraging these templates, teams can streamline their workflows, enhance communication, and ultimately thrive in a dynamic work environment. Discover our extensive template library, featuring Venn diagram templates, fishbone diagram templates, UML diagram templates, network diagram templates, and many more.