Market research templates
102 templates
Use Case Diagram Template
0likes
76uses

Use Case Diagram Template
A use case diagram is a visual tool that helps you analyze the relationships between personas and use cases. Use case diagrams typically depict the expected behavior of the system: what will happen and when. A use case diagram is helpful because it allows you to design a system from the perspective of the end user. It’s a valuable tool for communicating your desired system behavior in the language of the user, by specifying all externally visible system behavior.
App Wireframe Template
0likes
76uses

App Wireframe Template
Ready to start building an app? Don’t just imagine how it will function and how users will interact with it—let a wireframe show you. Wireframing is a technique for creating a basic layout of each screen. When you wireframe, ideally early in the process, you’ll gain an understanding of what each screen will accomplish and get buy-in from important stakeholders—all before adding the design and content, which will save you time and money. And by thinking of things in terms of a user’s journey, you’ll deliver a more compelling, successful experience.
Research Report: Sharing Insights
28likes
71uses
Competitor Product Research
13likes
70uses

Competitor Product Research
The Competitor Product Research template assists product teams in analyzing competitor offerings and market landscapes effectively. By identifying competitor strengths, weaknesses, and market trends, this template enables teams to uncover insights and opportunities for differentiation. With sections for conducting feature comparisons, SWOT analysis, and market positioning assessments, it facilitates informed decision-making and strategic planning. This template serves as a valuable resource for gaining competitive intelligence and driving product innovation and differentiation.
Fishbone Diagram Template
2likes
63uses

Fishbone Diagram Template
What is the best way to solve any problem your team faces? Go straight to the root. That means identifying the root causes of the problem, and fishbone diagrams are designed to help you do it best. Also known as the Ishikawa Diagram (named after Japanese quality control expert Kaoru Ishikawa), fishbone diagrams allow teams to visualize all possible causes of a problem, to explore and understand how they fit together holistically. Teams can also use fishbone diagrams as a starting point for thinking about what the root cause of a future problem might be.
Low-Fidelity Prototype Template
0likes
62uses

Low-Fidelity Prototype Template
Low fidelity prototypes serve as practical early visions of your product or service. These simple prototypes share only a few features with the final product. They are best for testing broad concepts and validating ideas. Low fidelity prototypes help product and UX teams study product or service functionality by focusing on rapid iteration and user testing to inform future designs. The focus on sketching and mapping out content, menus, and user flow allows both designers and non-designers to participate in the design and ideation process. Instead of producing linked interactive screens, low fidelity prototypes focus on insights about user needs, designer vision, and alignment of stakeholder goals.
Website Flowchart Template
0likes
60uses

Website Flowchart Template
A website flowchart, also known as a sitemap, maps out the structure and complexity of any current or future website. The flowchart can also help your team identify knowledge gaps for future content. When you’re building a website, you want to ensure that each piece of content gives users accurate research results based on keywords associated with your web content. Product, UX, and content teams can use flowcharts or sitemaps to understand everything contained in a website, and plan to add or restructure content to improve a website’s user experience.
Collaborative User Research
28likes
58uses
Supply and Demand Graph Template
0likes
57uses

Supply and Demand Graph Template
How do you price your product so that you make a profit while keeping customers and manufacturers happy? By finding a fair price. A supply and demand diagram is a graph that visualizes how much demand there is for your product and how many products you need. This, in turn, helps you with product pricing.
Perceptual Map Template
0likes
56uses

Perceptual Map Template
To shape your messaging, tailor your marketing, improve your product, and build your brand, you have to know your customers’ perceptions — what they think of you and your competitors. You can gain those insights by exploring a perceptual map. This simple, powerful tool creates a visual representation of how customers rank your price, performance, safety, and reliability. Put this template to work and you’ll be able to size up your competition, see gaps in the market, and understand changes in customer behavior and purchasing decisions.
Ecosystem Map [Research]
16likes
56uses

Explore more
10
Branding25
Canvas Templates312
Customer Journey Map31
Design181
Documentation54
Empathy Map42
FMEA Analysis Templates7
Human-Centered Design36
Marketing Brief Templates14
Persona Templates113
Position Statement Templates13
RACI chart templates6
Raid Log templates6
Root Cause Analysis Templates9
Service Blueprint Templates48
Storyboard33
UI19
UX378
About the Market Research Templates Collection
Miro's market research templates collection is designed to streamline the process of gathering, analyzing, and presenting market data. These templates cater to various stages of market research, from initial data collection to final reporting. Whether you're conducting a comprehensive market analysis or a focused survey, our templates provide a structured approach to ensure thorough and accurate results. The collection includes templates for market research reports, market research analysis, and more, making it easier for teams to collaborate and share insights.
Why you'll love our market research templates
Our market research templates are designed to enhance your research process from start to finish. Here's why you'll love using them:
User-friendly design: Our templates are intuitive and easy to navigate, allowing you to focus on your research rather than the formatting. This user-centric approach ensures that even beginners can quickly get up to speed.
Customizable: Tailor the templates to fit your specific needs and branding, ensuring that your reports and analyses are uniquely yours. This flexibility allows you to adapt the templates to various research scenarios and organizational requirements.
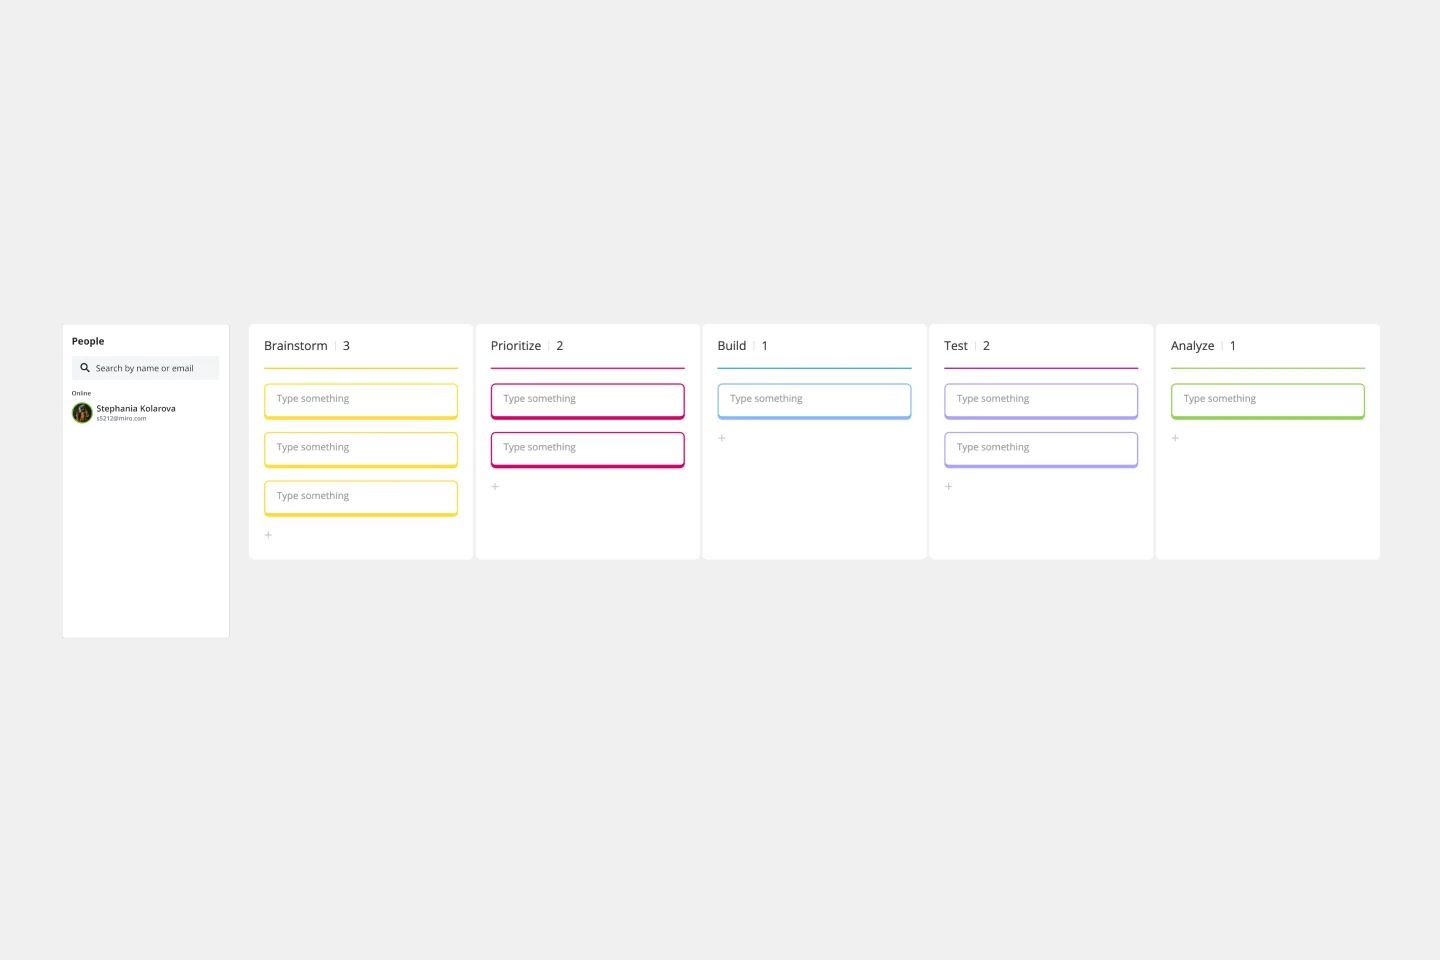
Collaborative features: Miro's templates facilitate teamwork, enabling real-time collaboration and seamless sharing of insights. This means that team members can work together simultaneously, providing immediate feedback and ensuring everyone is on the same page.
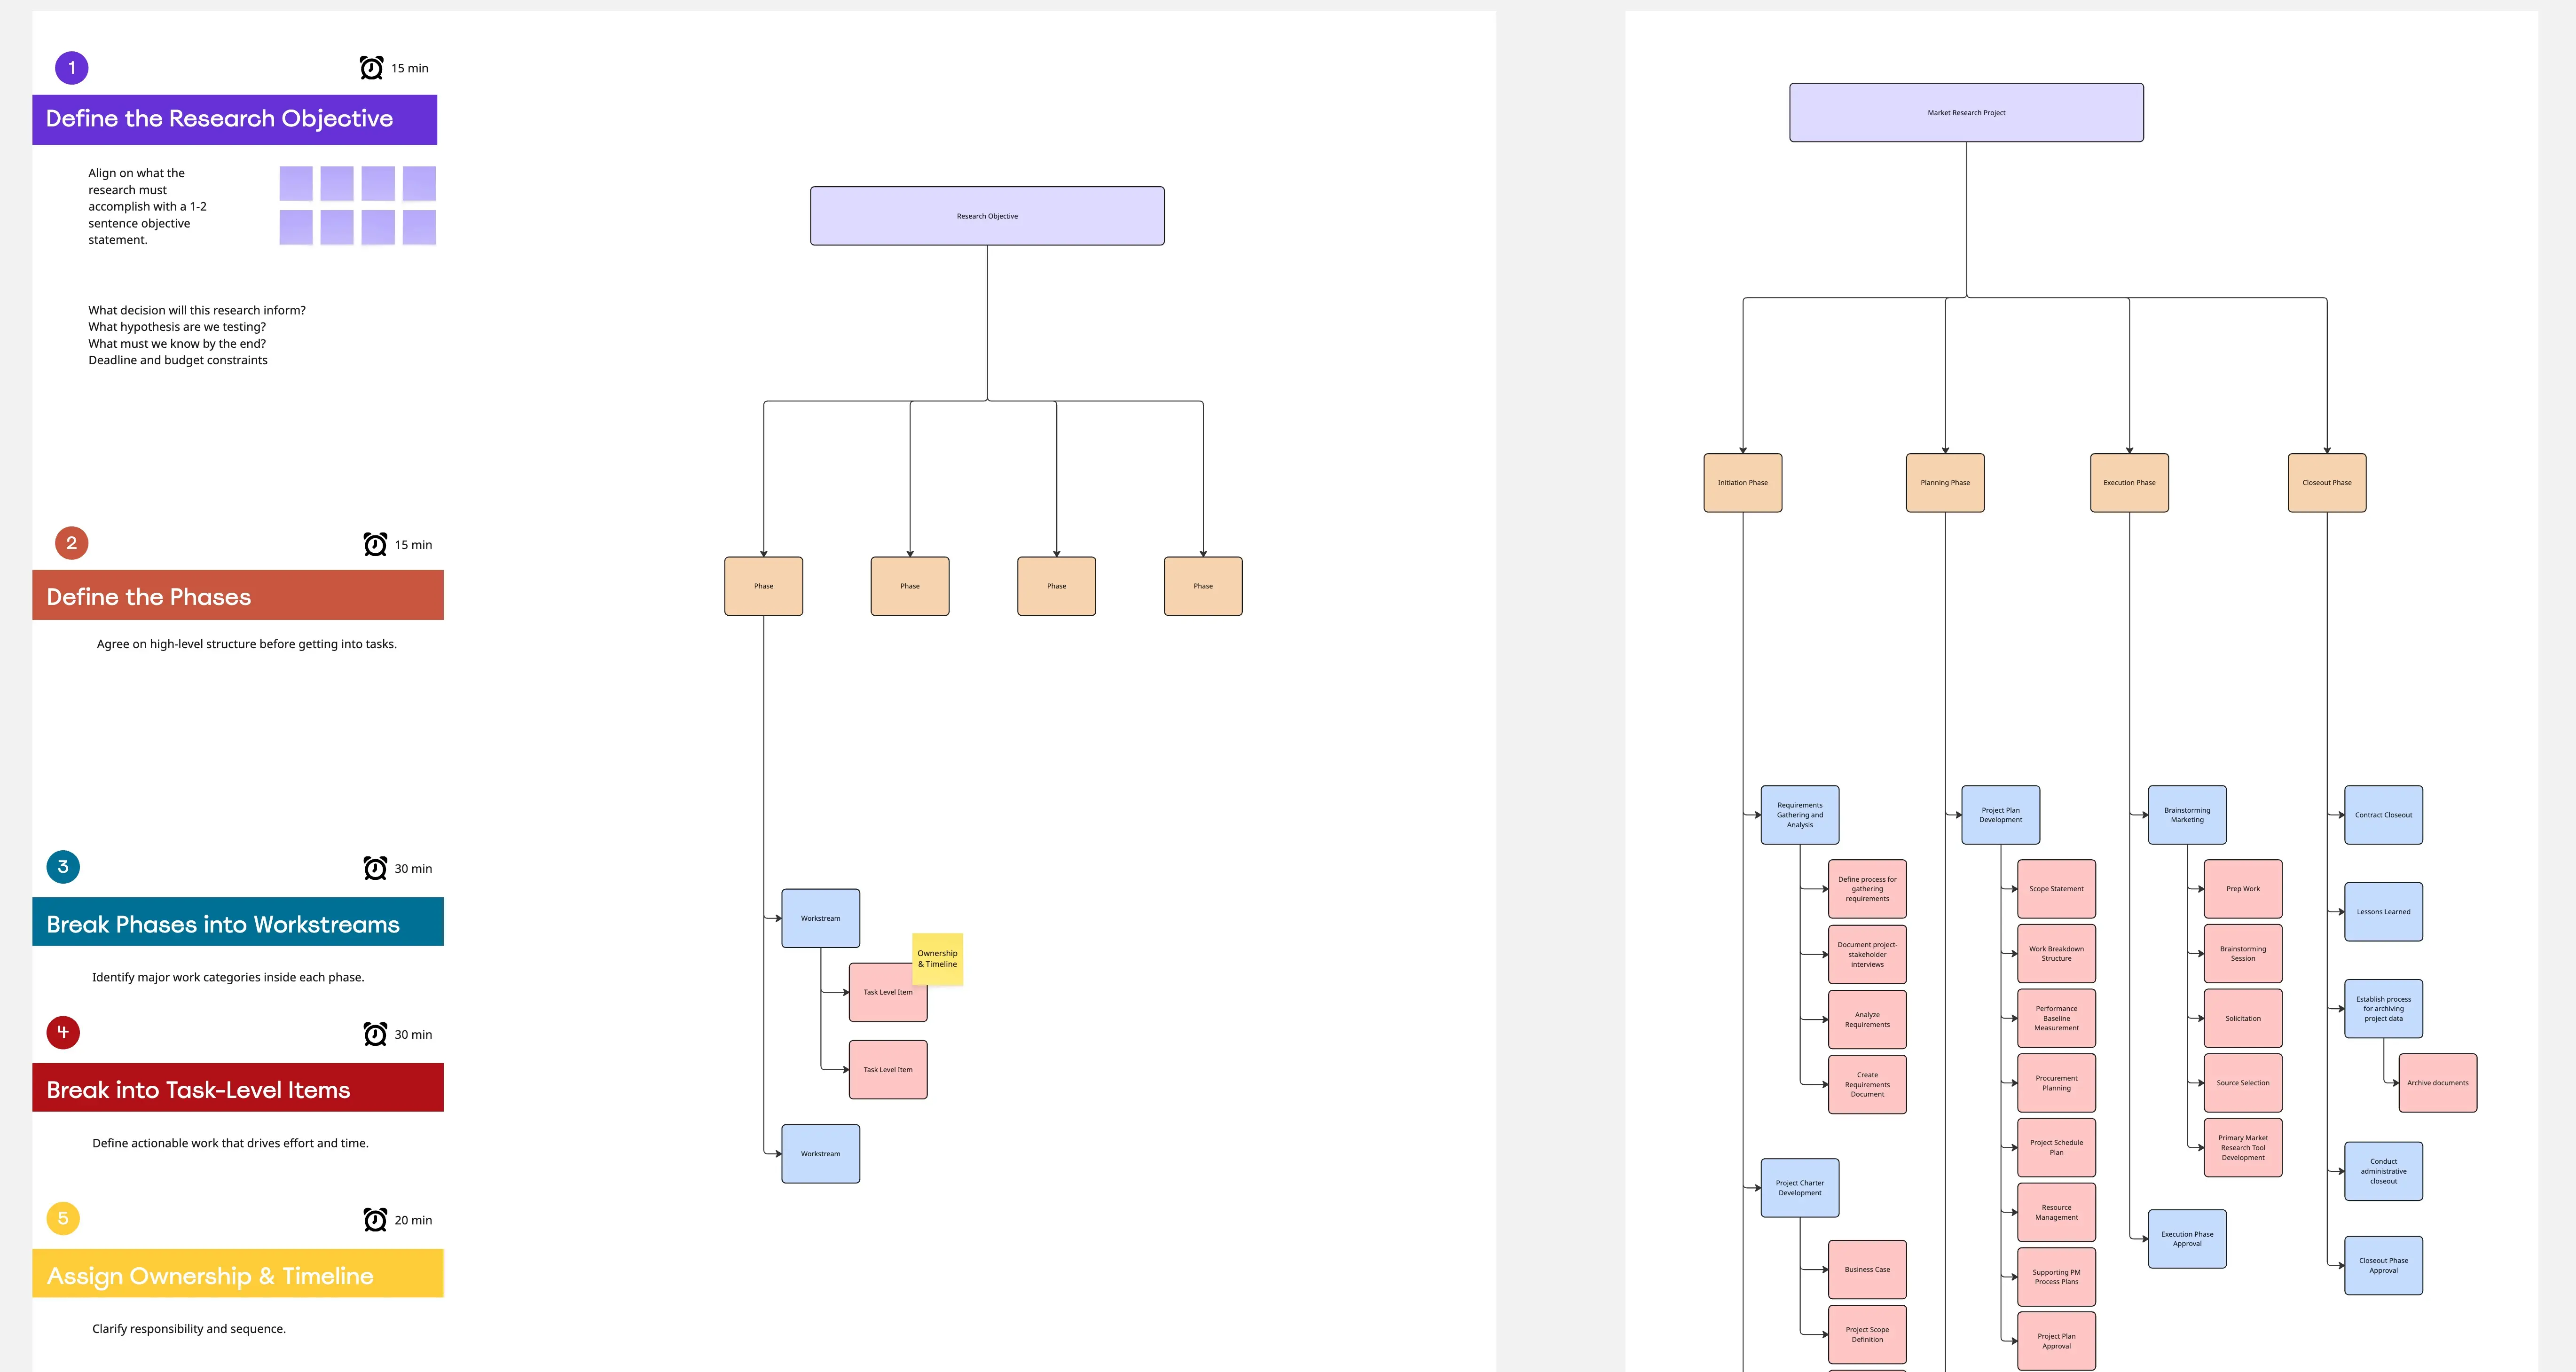
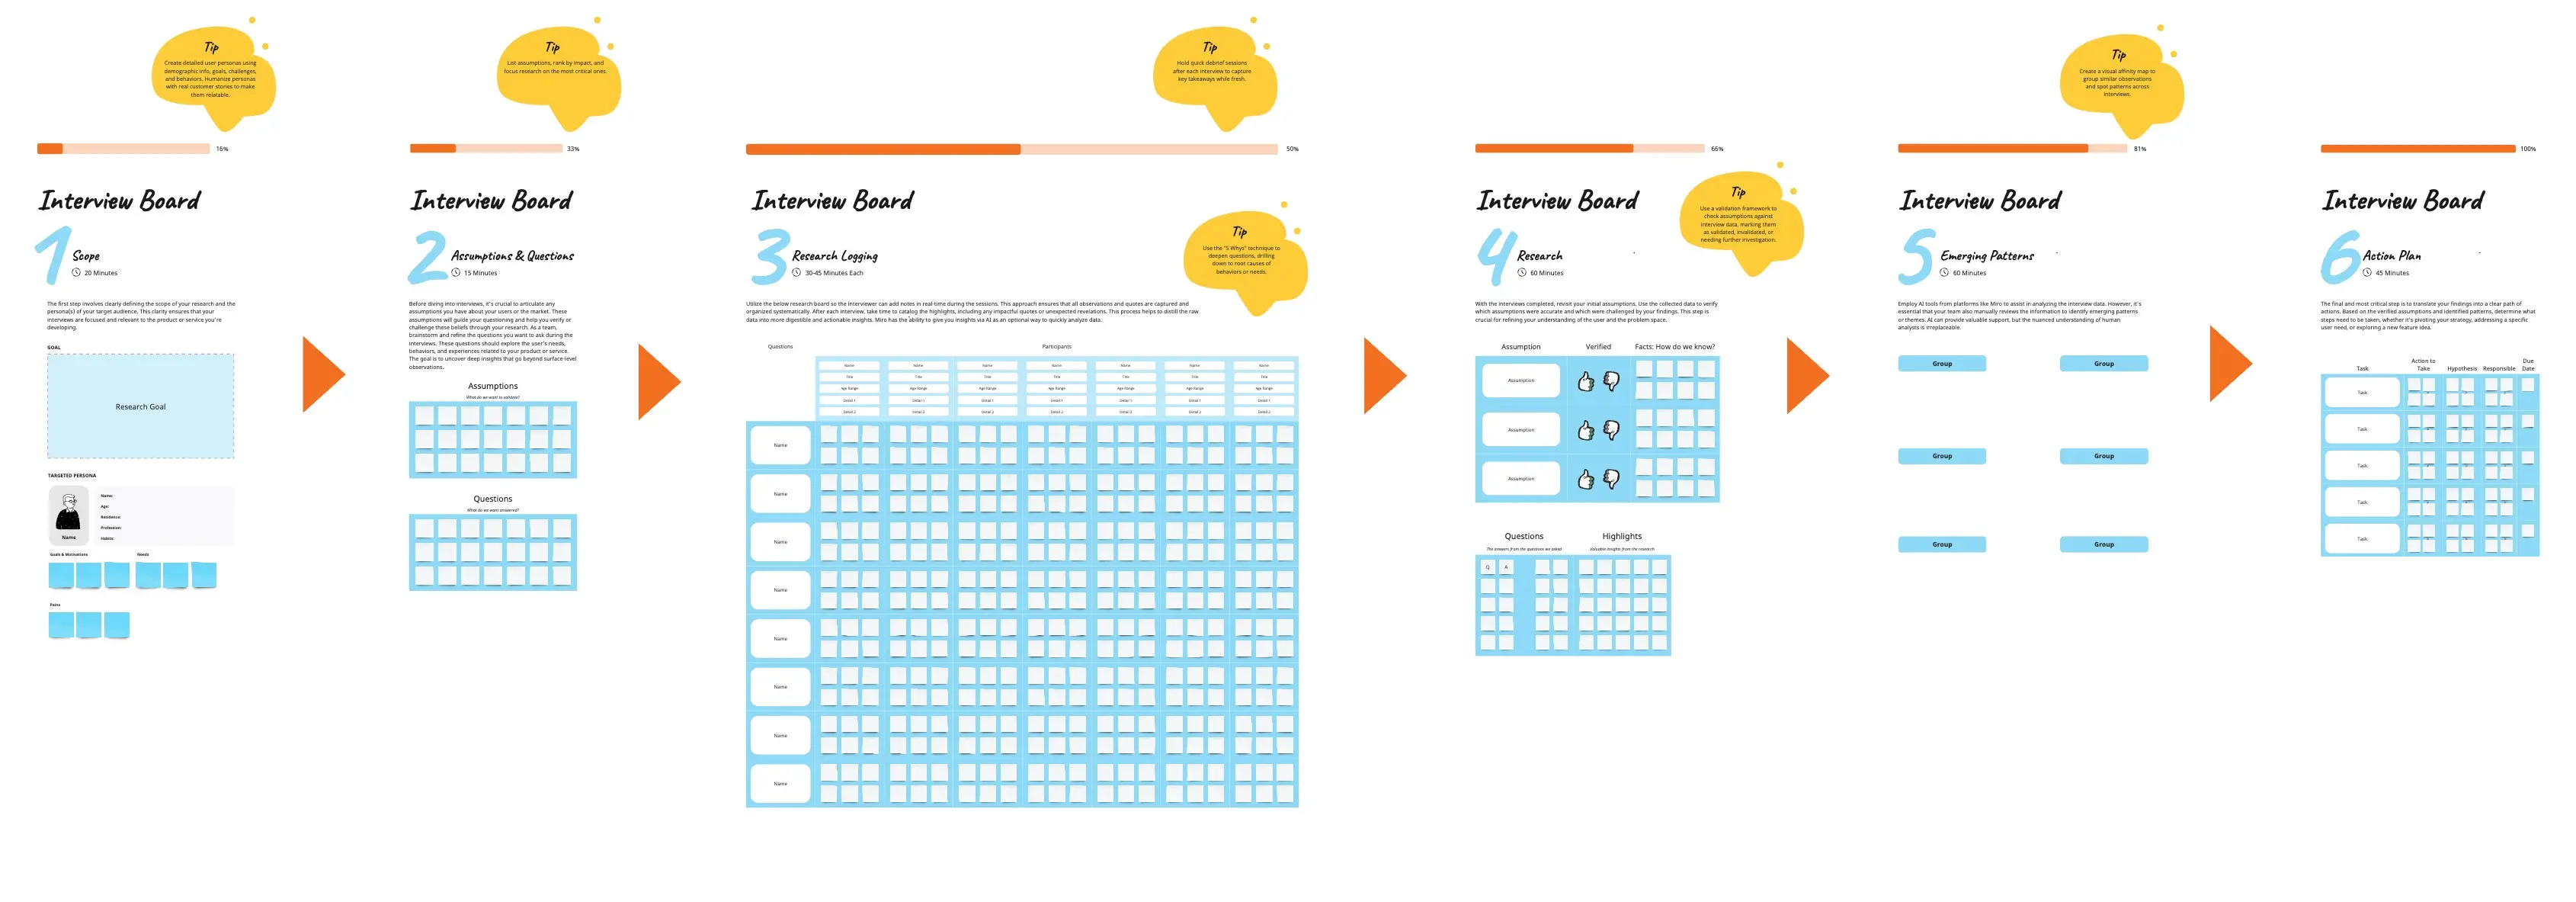
Comprehensive structure: Each template covers all essential aspects of market research, from data collection to analysis and reporting. This thoroughness helps you maintain a structured approach, ensuring no critical element is overlooked.
Time-saving: By providing a structured approach, our templates help you save time and streamline your workflow. This efficiency allows you to focus more on analyzing data and deriving actionable insights rather than spending time on formatting and structuring your research.
How to use the market research templates in Miro
Using the market research templates in Miro is straightforward. Follow these step-by-step instructions:
Select a template: Browse our extensive library and choose the market research template that best fits your needs. The variety ensures that you can find a template suitable for any research project.
Customize the template: Add your data, adjust the layout, and incorporate your branding elements to make the template your own. This customization ensures that the final output meets your organization's standards and requirements.
Collaborate with your team: Use Miro's collaborative features to invite team members to contribute in real time, ensuring everyone stays aligned and informed. This real-time collaboration enhances productivity and fosters a more cohesive team effort.
Integrate other tools: Enrich your research by integrating other tools and data sources directly into the template. This integration capability allows you to pull in data from various sources, providing a more comprehensive view of your research findings.
Present your findings: Use Miro's presentation features to effectively share your insights and recommendations with stakeholders. These features help you create compelling presentations that clearly communicate your research outcomes and support data-driven decision-making.
By following these steps, you can maximize the potential of Miro's market research templates and achieve comprehensive, data-driven results.