153likes
779uses
Bring everyone into your vision with our mapping and diagramming templates collection. Create diagrams, concept maps, and system mapping templates to communicate complex flows, creating a shared understanding.
581 templates
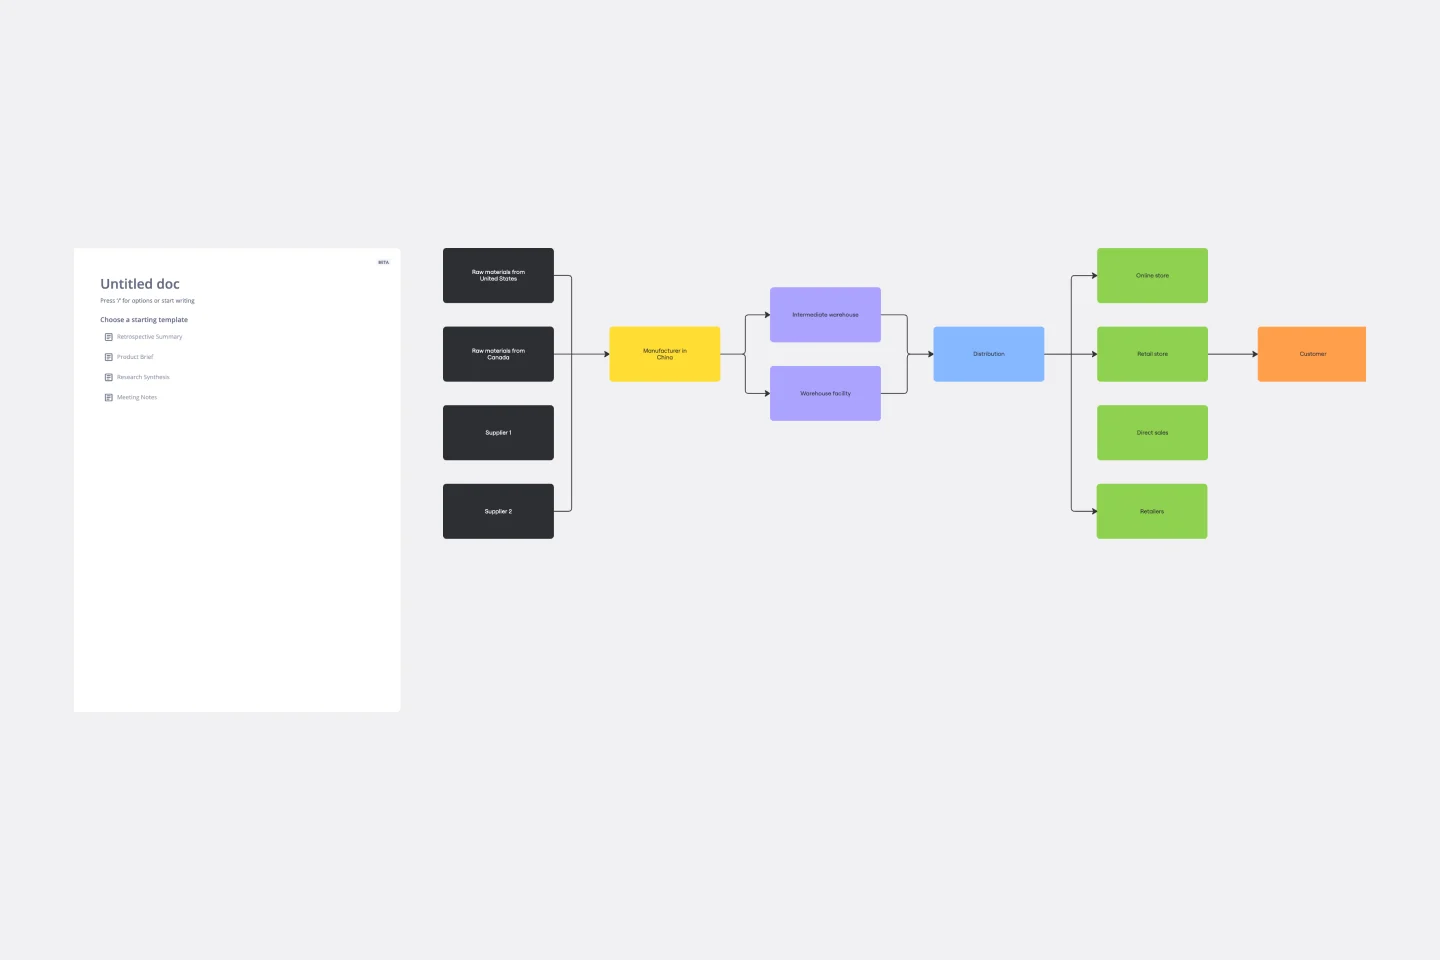
Supply Chain Diagram Template
The Supply Chain Diagram Template is great for businesses to streamline and enhance their supply chain processes. This template lets you visualize the entire supply chain, from sourcing raw materials to delivering finished products. Its intuitive layout simplifies complex networks, making identifying key areas and potential bottlenecks easier. One of the standout benefits of using this template is its clarity. It bridges the gap between complex processes and strategic decision-making by presenting a clear, visual supply chain representation. This clarity enables teams to pinpoint inefficiencies and implement more effective management strategies, which optimizes operations and facilitates better communication and understanding across different departments within an organization.
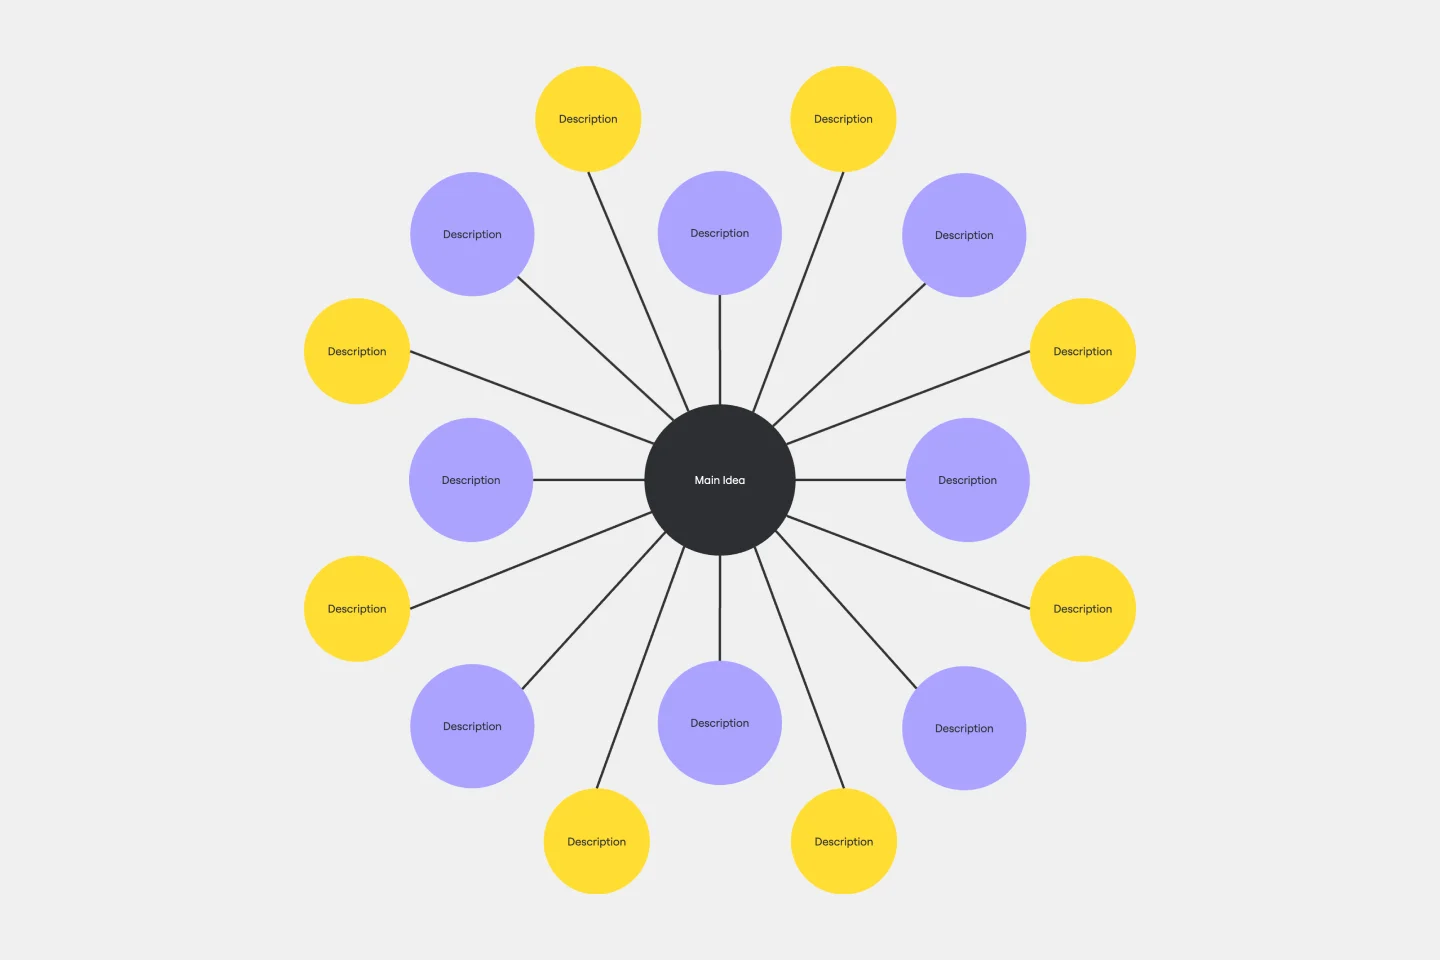
Bubble Map Template
A Bubble Map Template is a visual organization tool that uses bubbles or circles to represent various ideas or data points. These bubbles are linked together, displaying their relationships and creating a network of interconnected thoughts. Use a Bubble Map Template to streamline complex information, enhancing comprehension and promoting efficient decision-making.
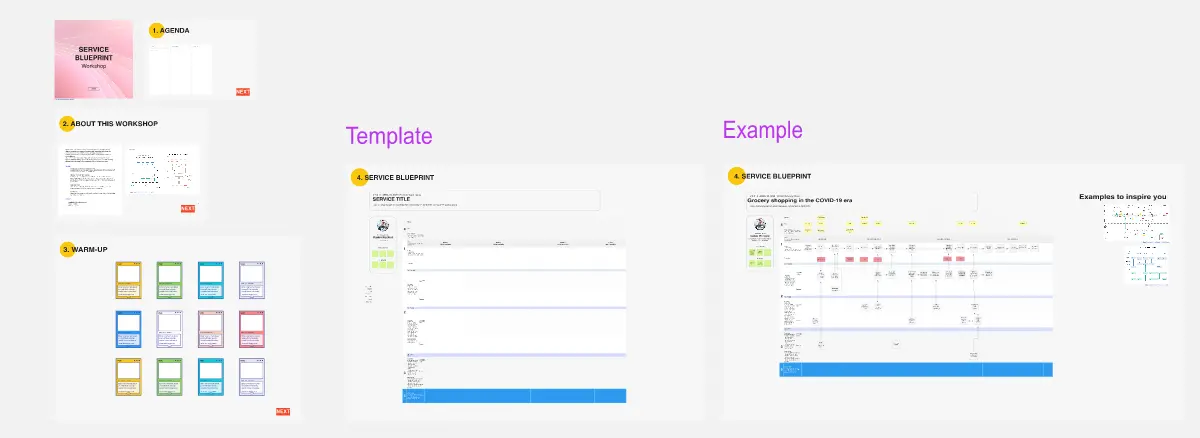
Service Blueprint Workshop
The Service Blueprint Workshop by Lidia Olszewska is designed for collaborative service design sessions. This template helps teams visualize service processes, identify pain points, and brainstorm solutions. Use it to align cross-functional teams, improve service delivery, and ensure a seamless customer experience. It's ideal for workshops aimed at service optimization, fostering collaboration, and strategic planning in service design.
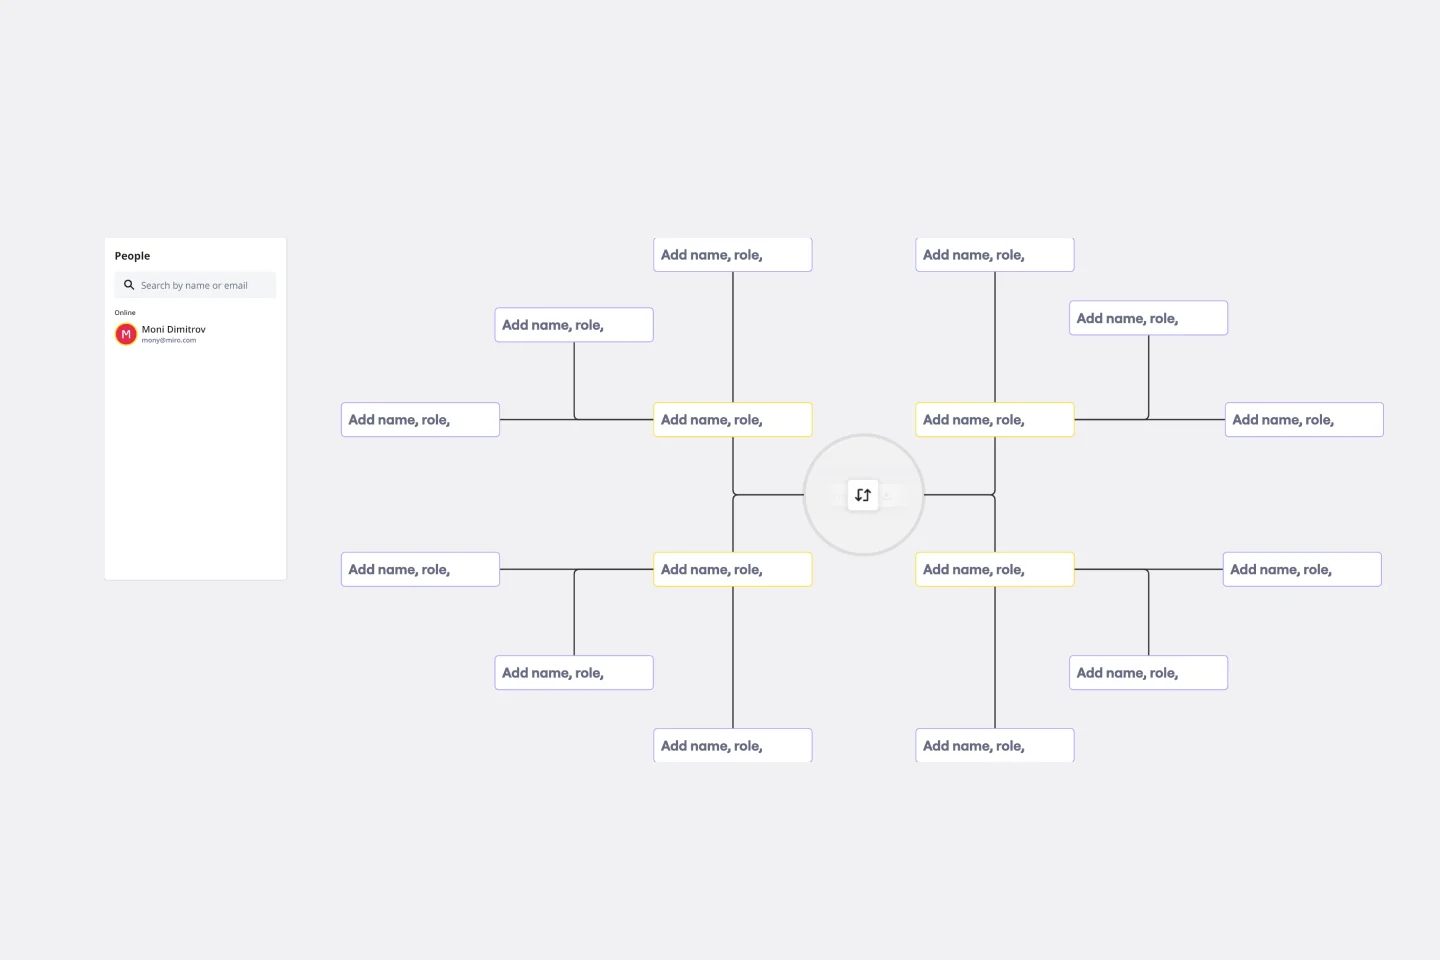
Circular Org Chart Template
The Circular Org Chart Template is an innovative solution that helps represent and visualize complex organizational structures with ease. The key advantage of this template is its ability to present complex hierarchies in a visually appealing and easy-to-understand format. By adopting a circular arrangement, the template provides a comprehensive and holistic view of the organization, making it effortless for teams to comprehend reporting relationships at a glance. The visual clarity offered by this template fosters efficient communication and decision-making, offering a seamless experience for teams to understand their organizational structure. The template's intuitive design and emphasis on visual representation significantly enhance transparency, promoting a deeper understanding of organizational roles and relationships.
AI Accelerated
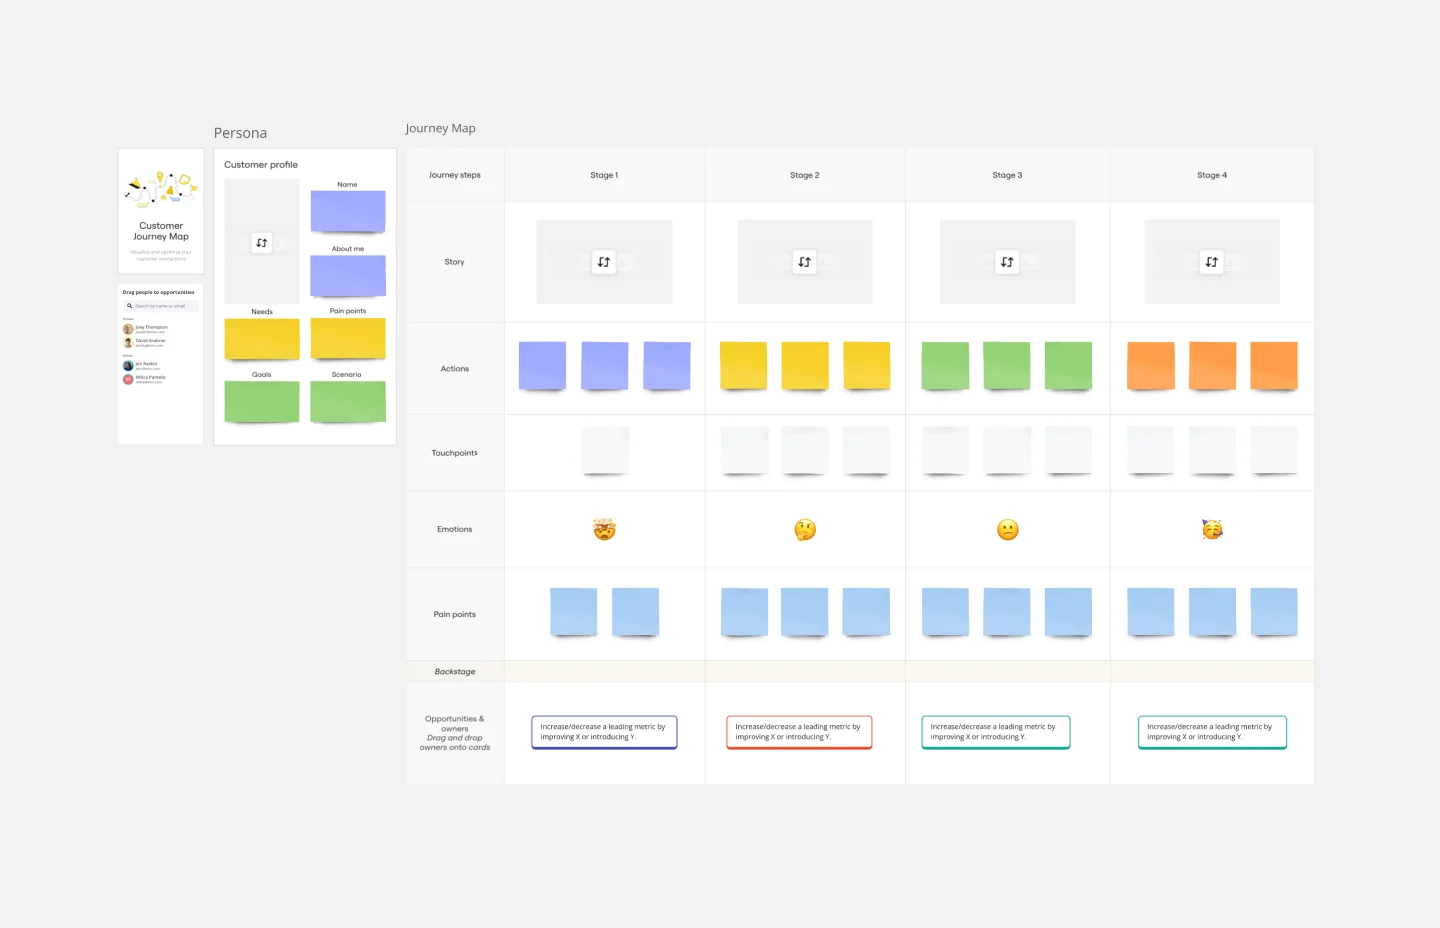
Customer Journey Map AI Template
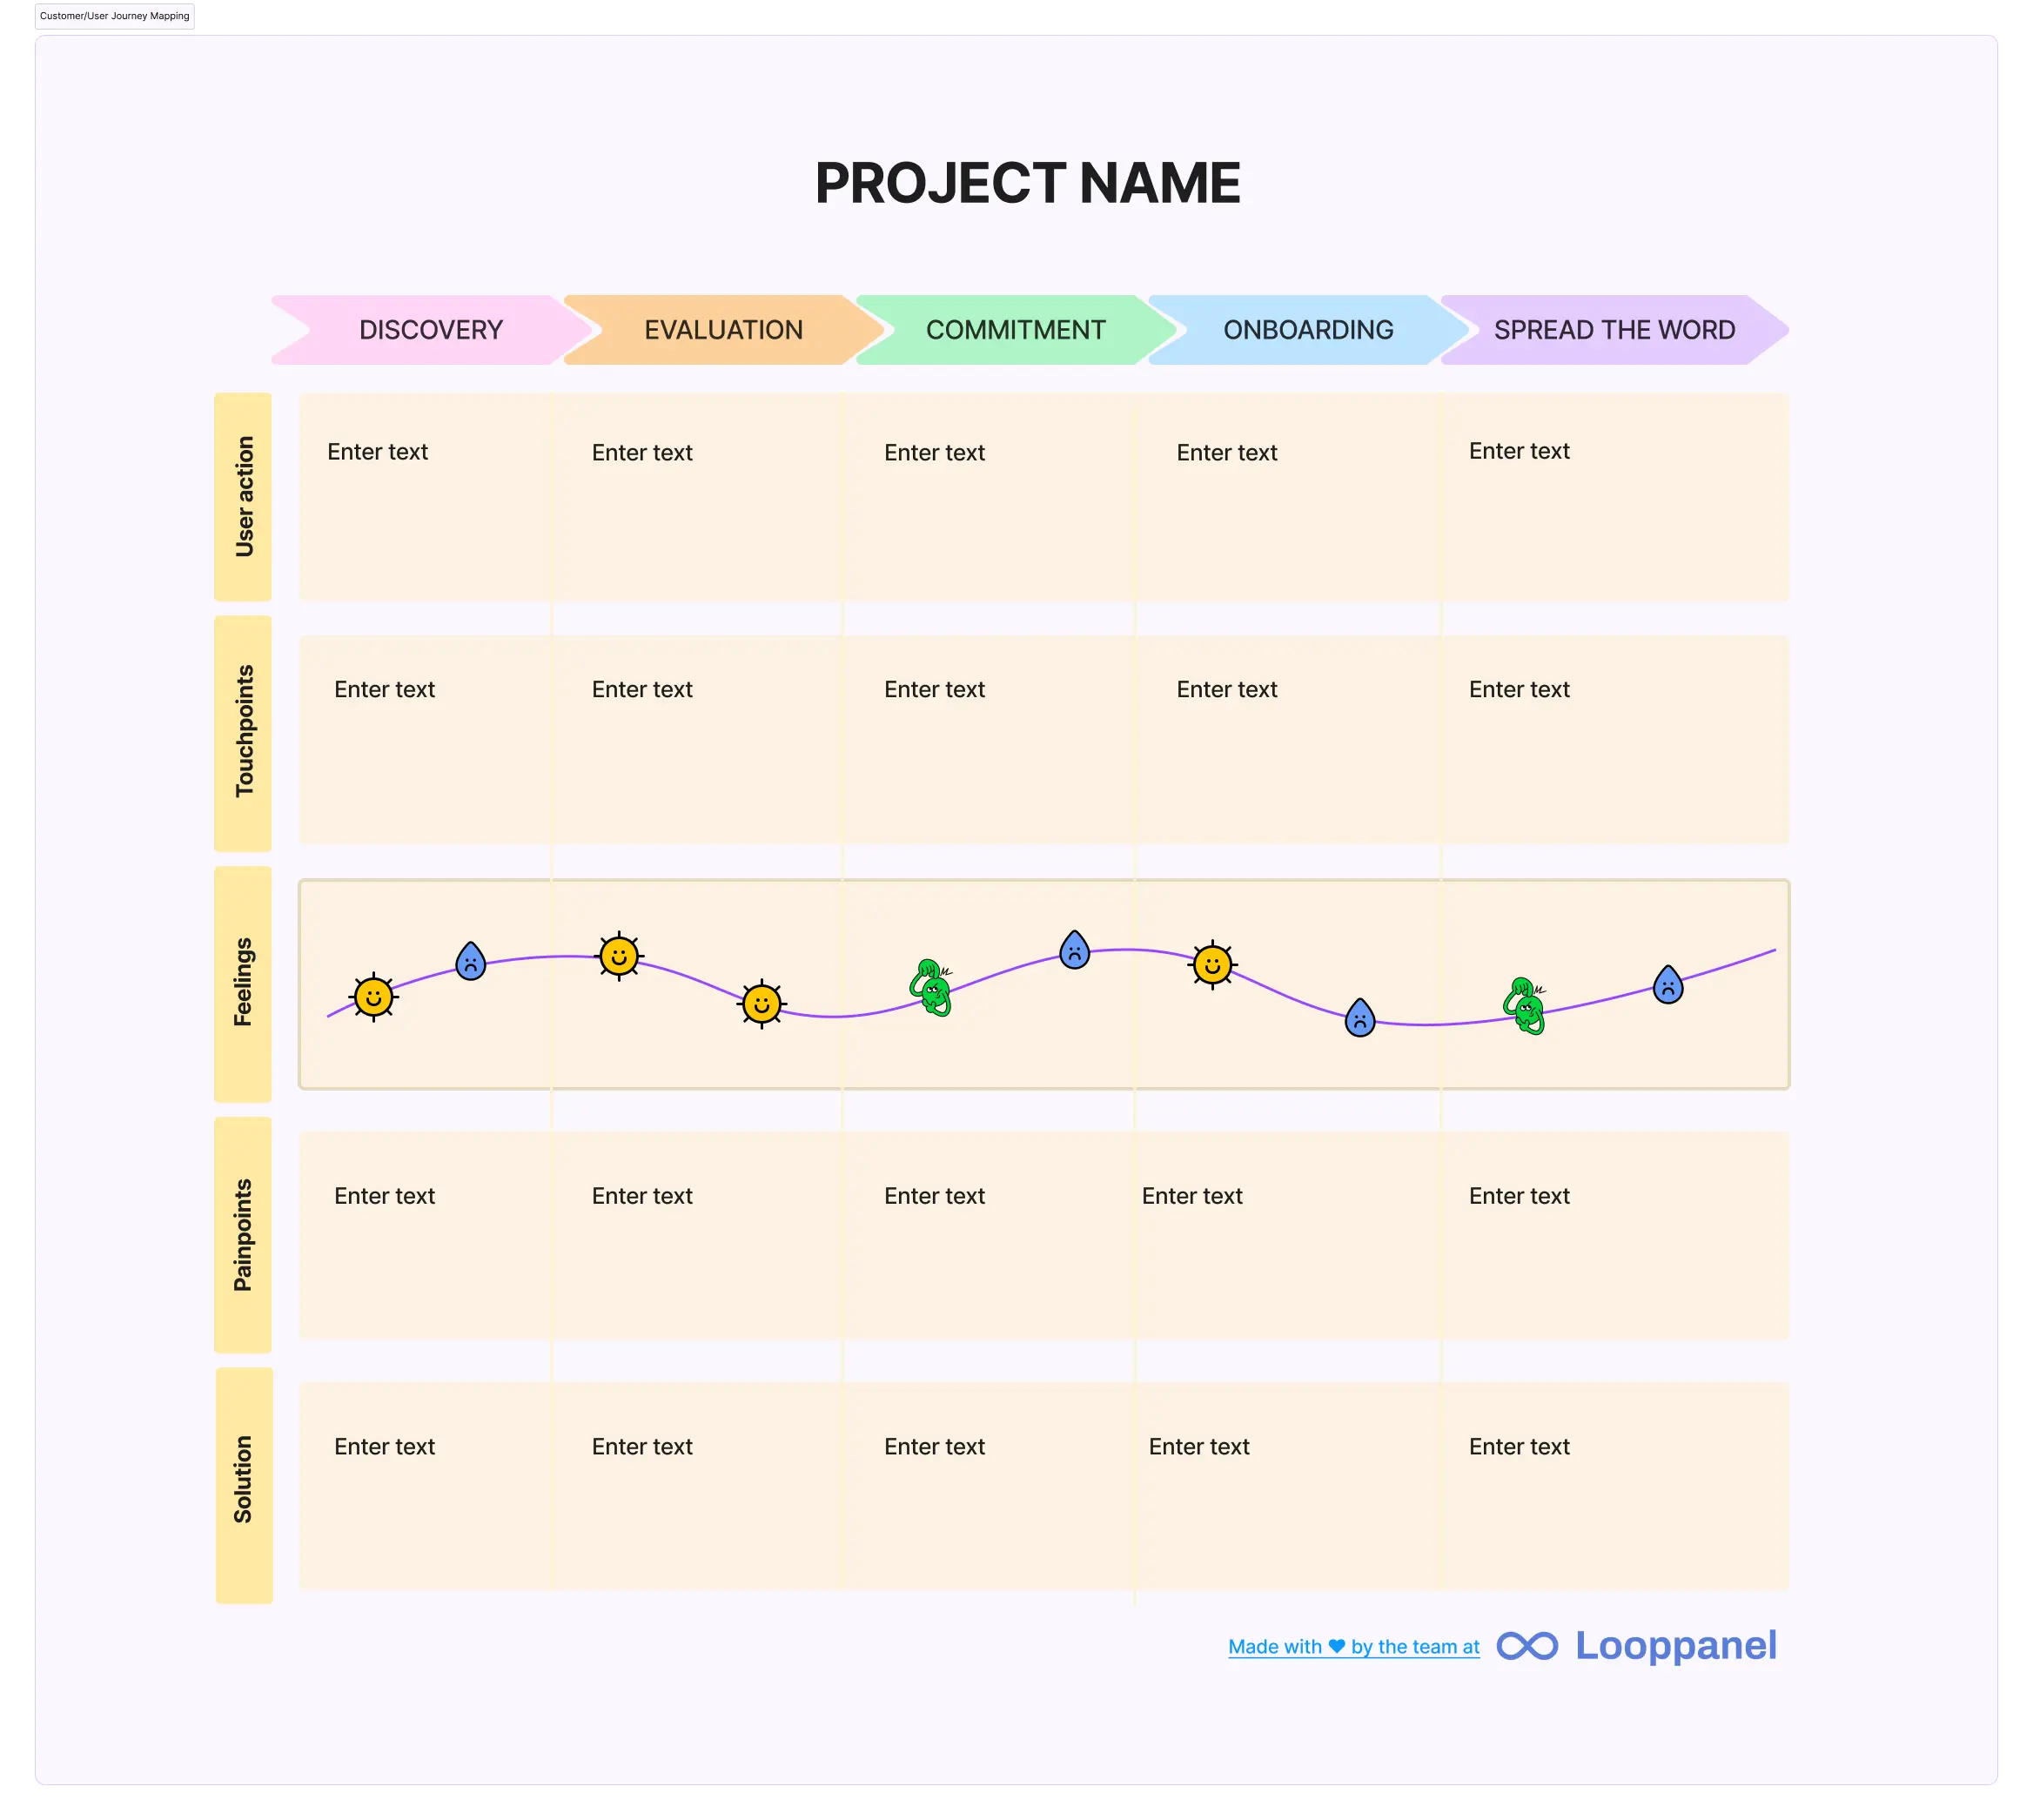
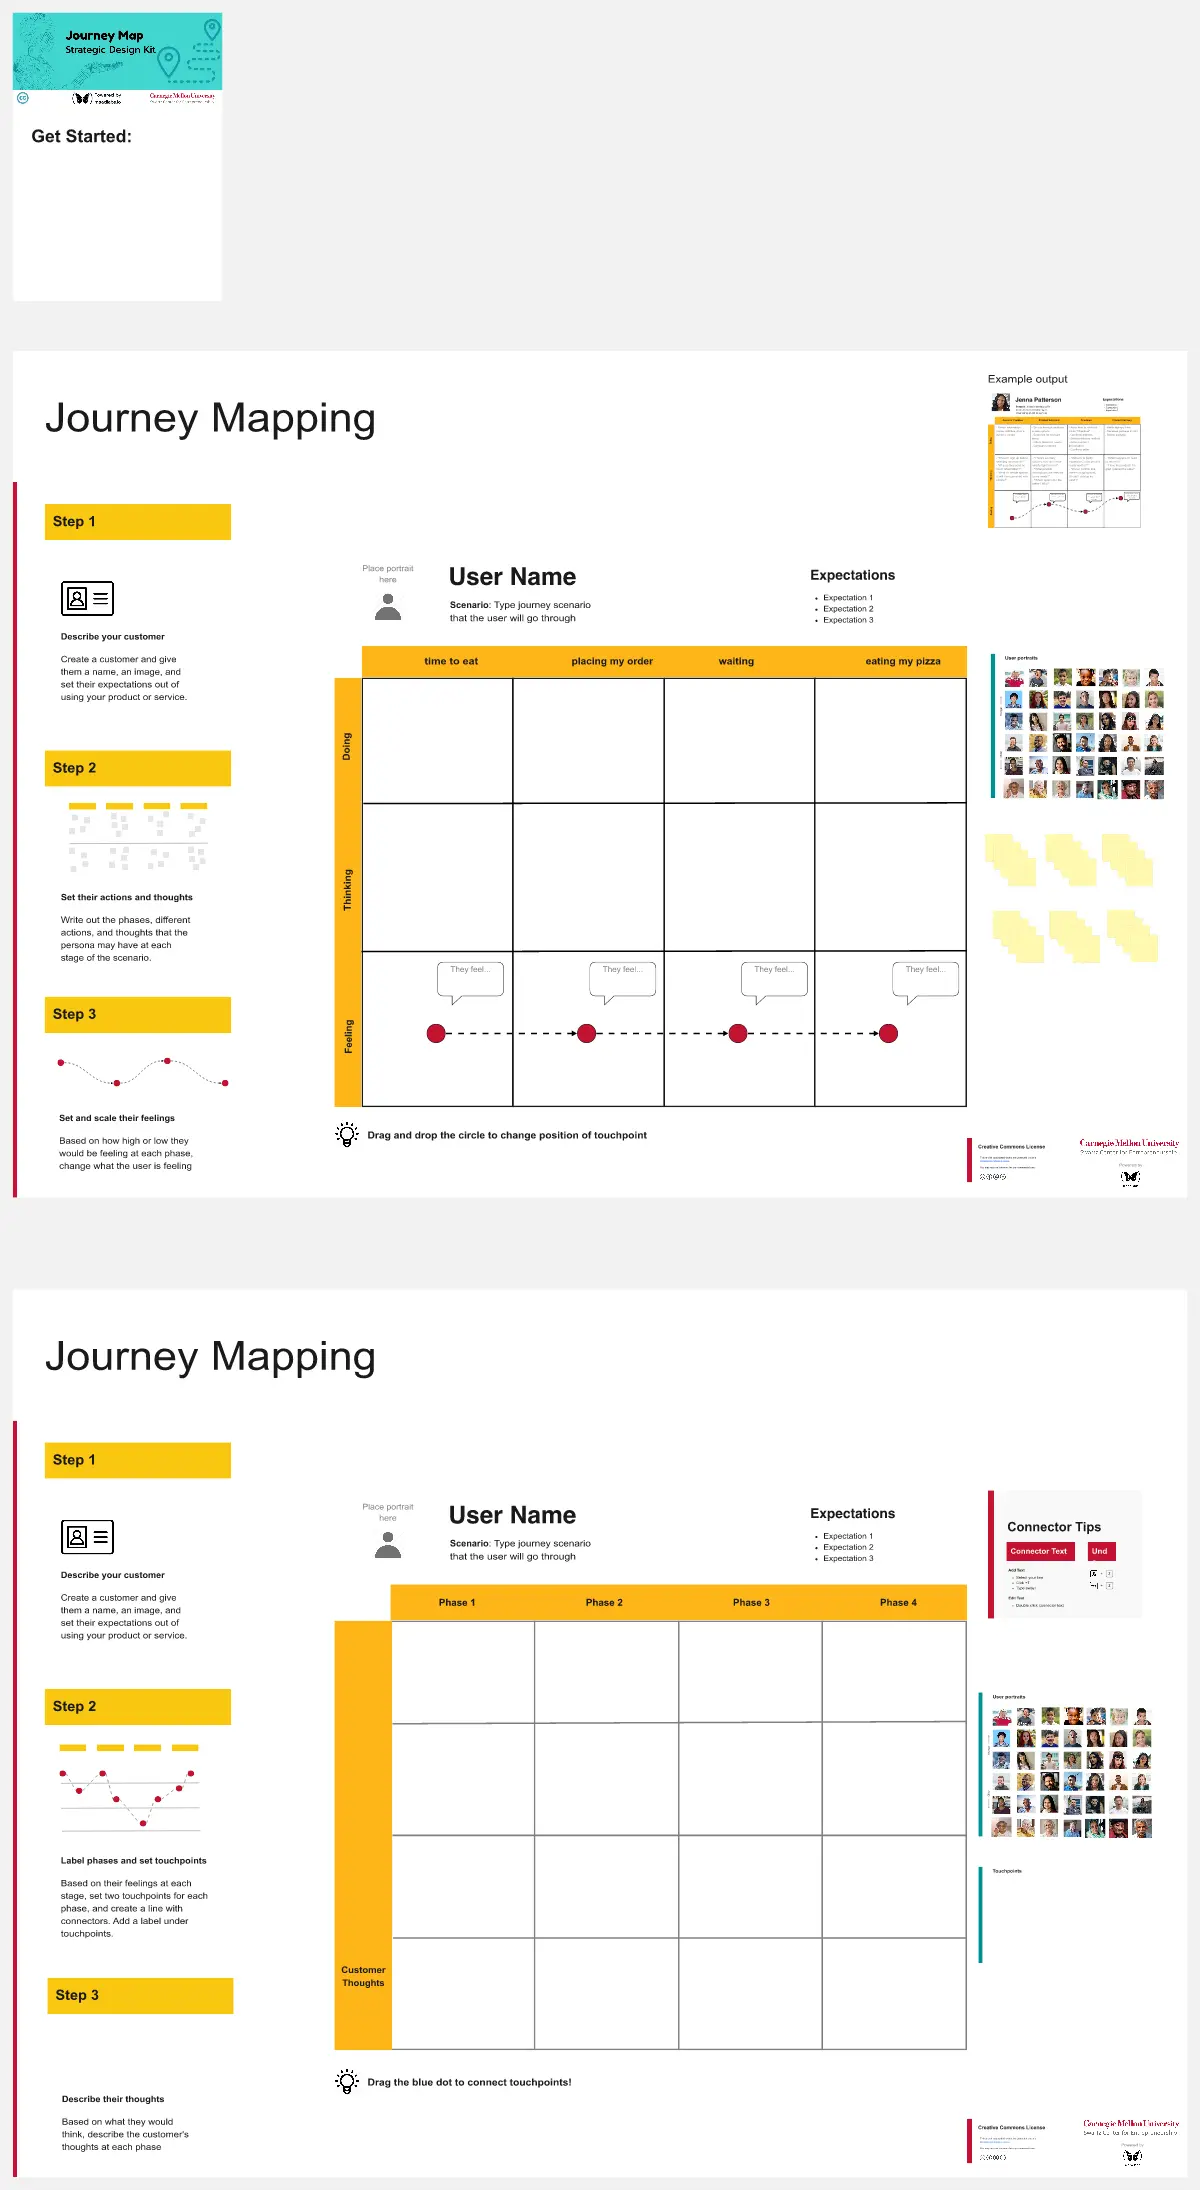
A customer journey map (CJM) is a visual representation of your customer’s experience. It allows you to capture the path that a customer follows when they buy a product, sign up for a service, or otherwise interact with your site. Most maps include a specific persona, outlines their customer experience from beginning to end, and captures the potential emotional highs and lows of interacting with the product or service. Use this template to easily create customer journey maps for projects of all kinds.
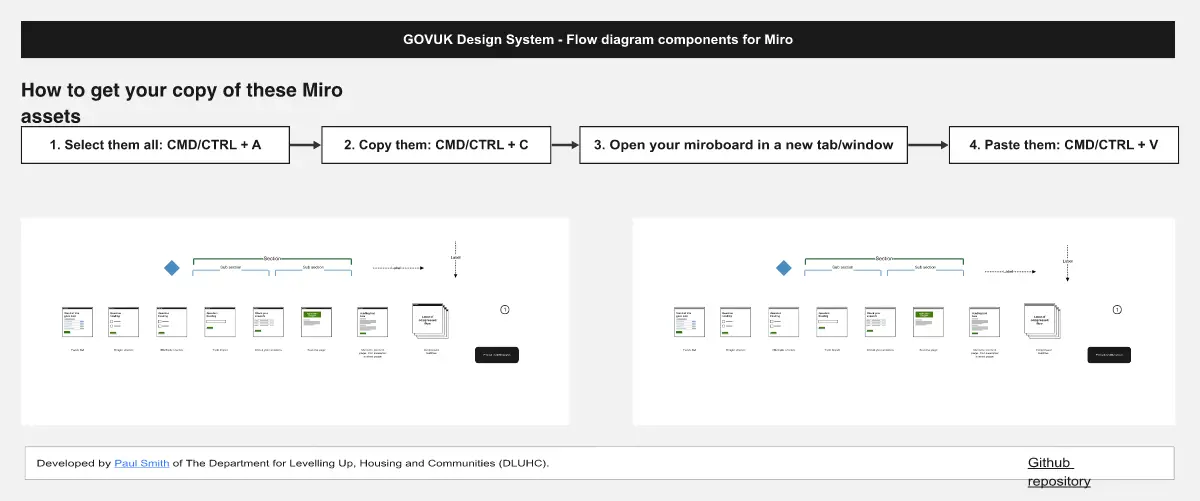
Flow Diagrams
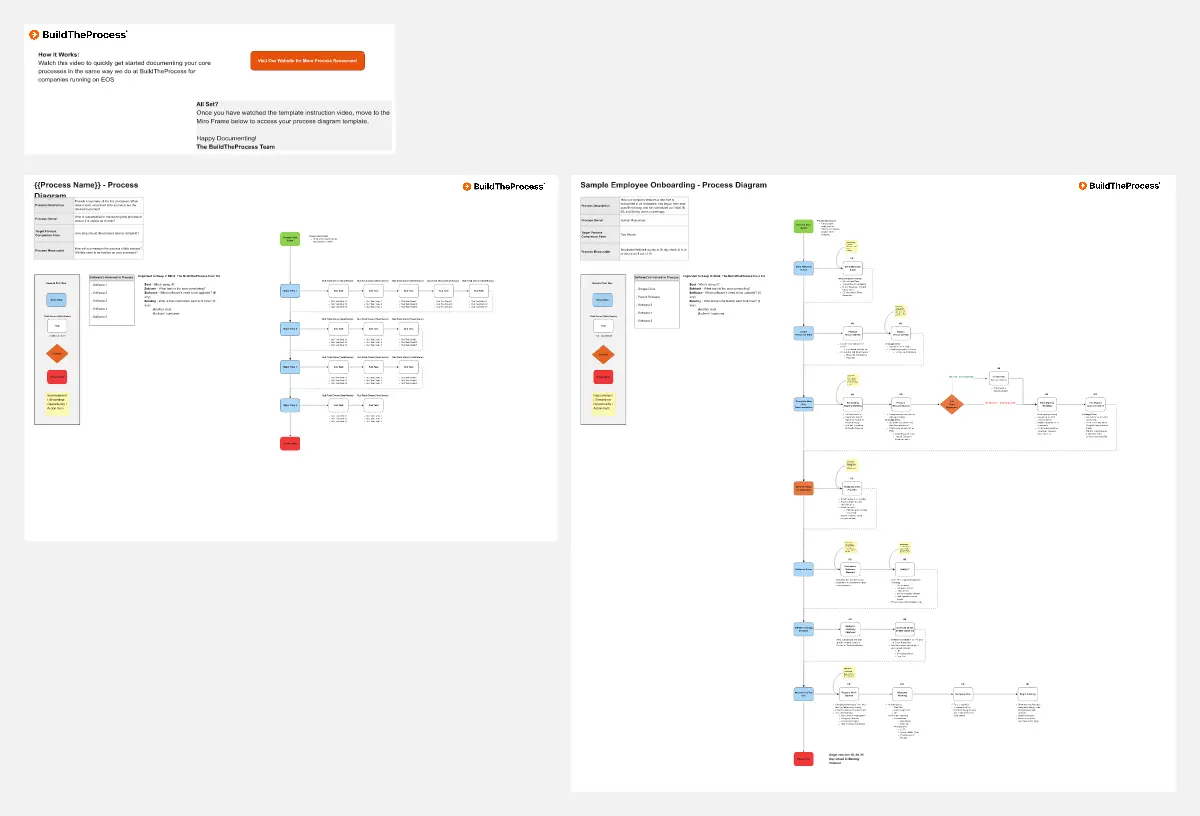
The Flow Diagrams template offers a versatile tool for visualizing processes, workflows, and systems. It provides a range of shapes and connectors for creating flowcharts, process maps, and data flow diagrams. This template enables teams to represent complex systems and processes in a clear and structured manner, facilitating communication and decision-making. By promoting visual clarity and understanding, Flow Diagrams empower teams to analyze and optimize processes effectively, driving efficiency and productivity.
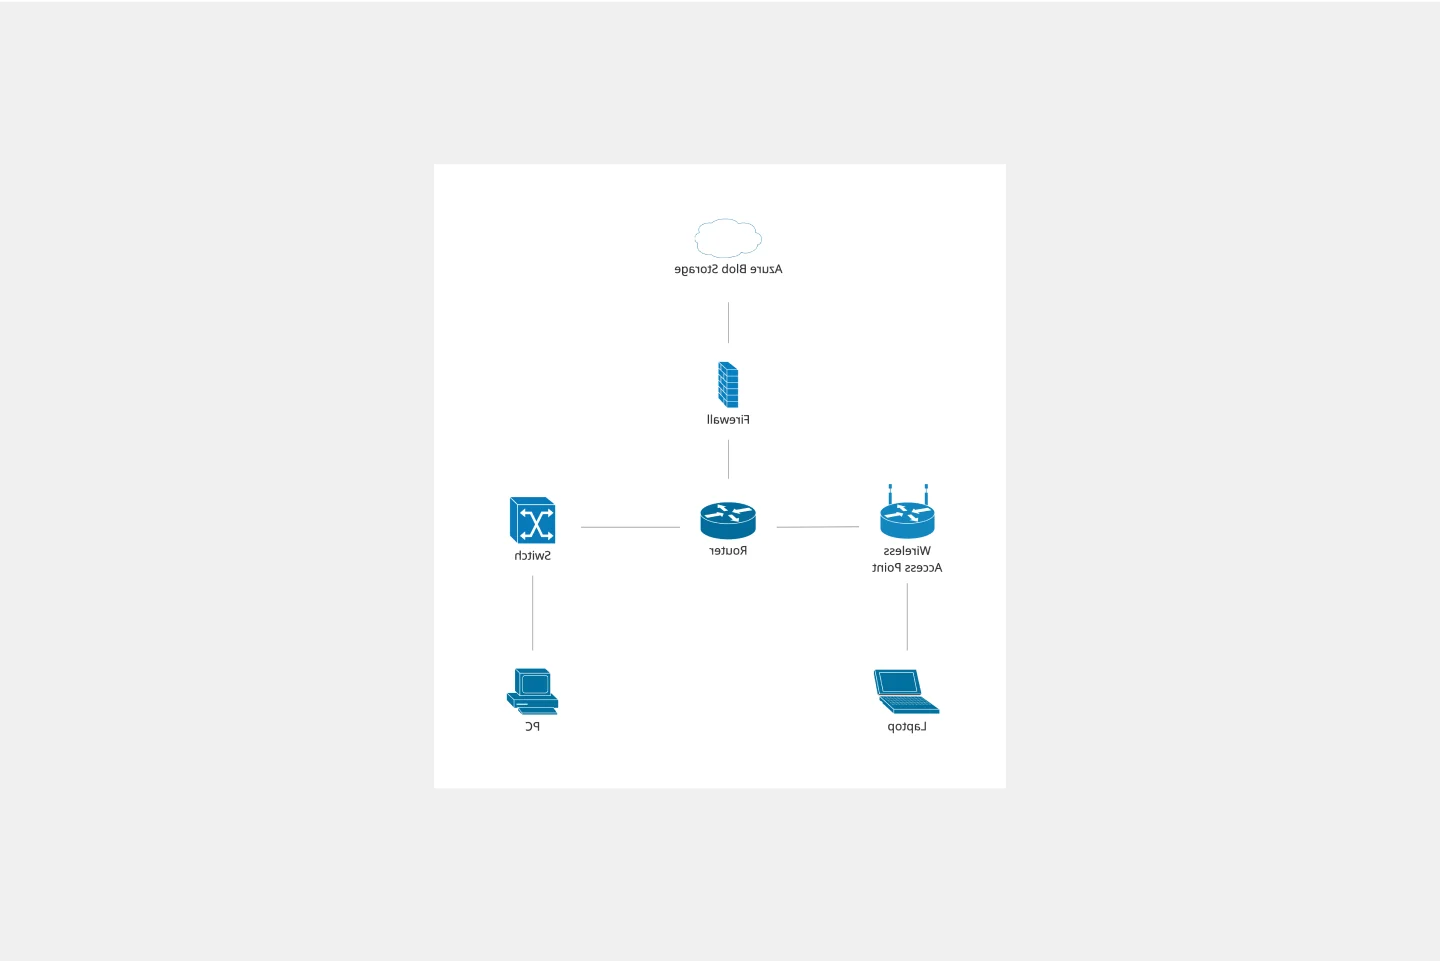
Cisco Network Diagram Template
Cisco offers data center and access networking solutions built for scale with industry-leading automation, programmability, and real-time visibility. The Cisco Data Network Diagram uses Cisco elements to show the network design of Cisco Data Networks visually.
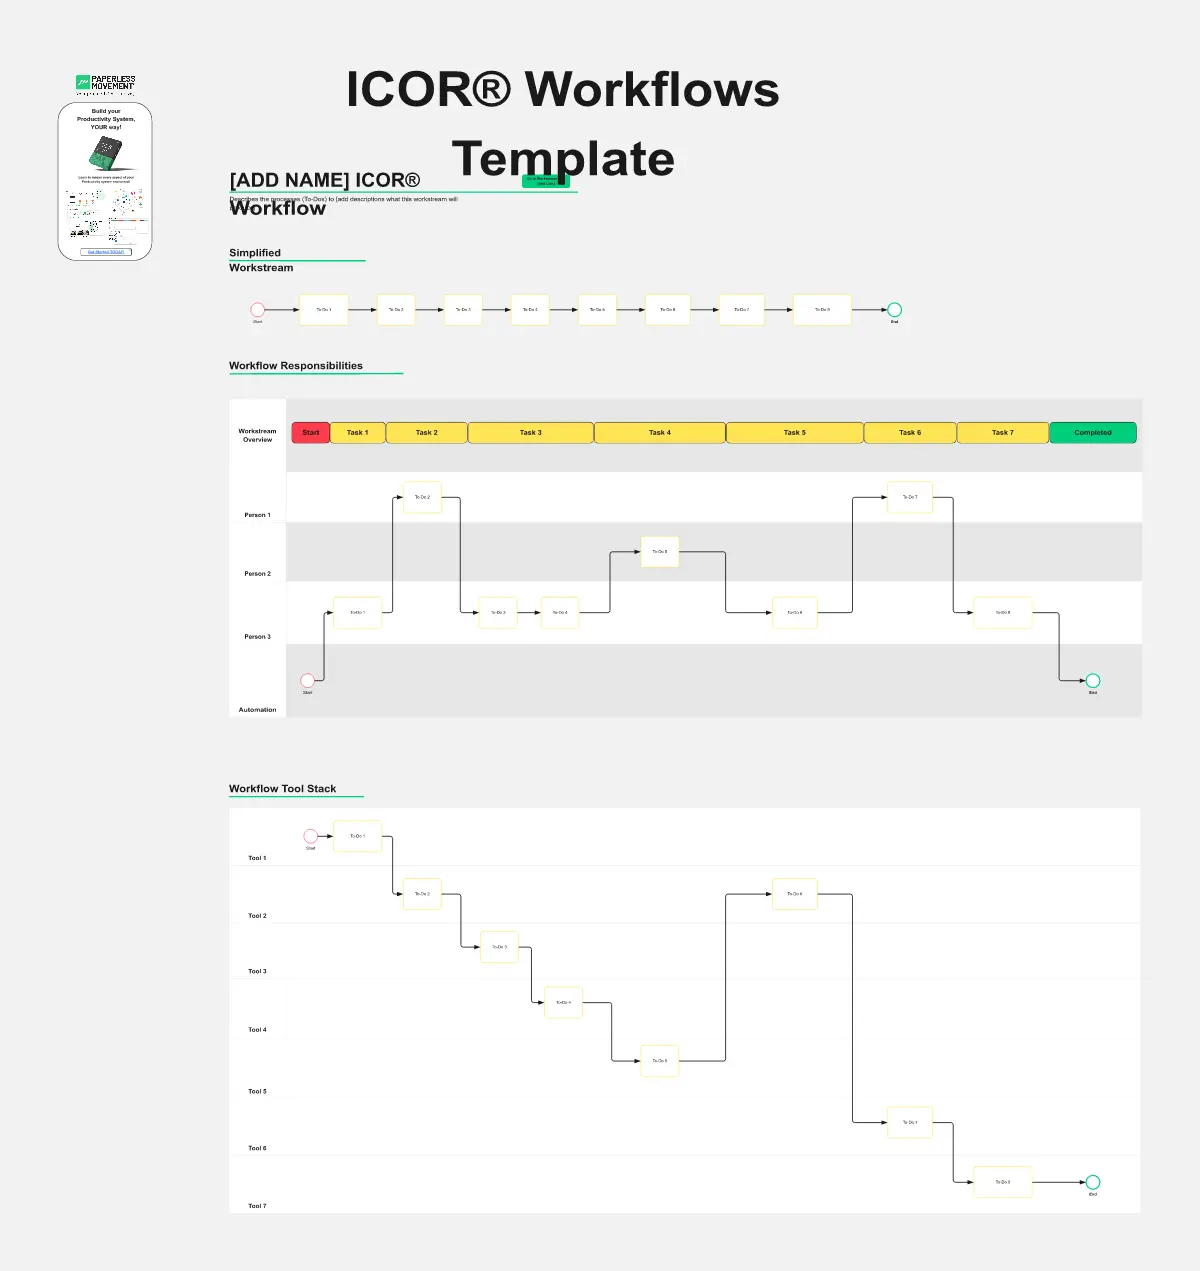
ICOR® Workflows
The ICOR® Workflows template offers a visual framework for documenting and optimizing business processes according to the ICOR® (Input, Control, Output, Resources) methodology. It provides elements for defining process inputs, controls, outputs, and resource requirements. This template enables organizations to streamline operations, enhance quality management, and achieve process excellence. By promoting systematic process documentation and analysis, the ICOR® Workflows template empowers organizations to optimize efficiency, minimize risks, and deliver value to stakeholders effectively.
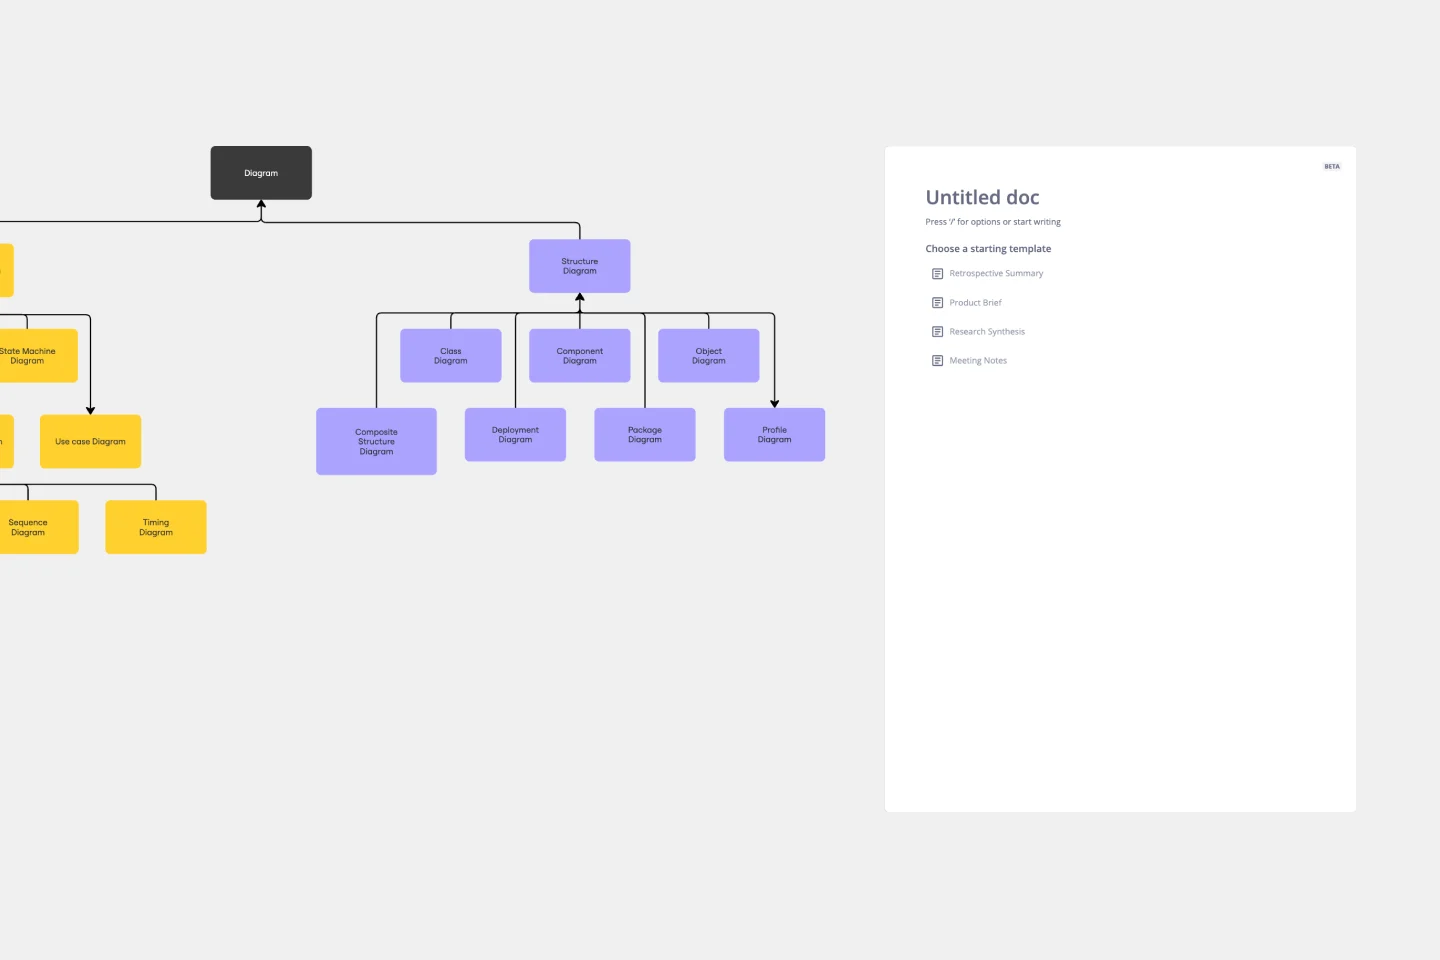
UML Class Diagram Template
Get a template for quickly building UML class diagrams in a collaborative environment. Use the UML class diagram template to design and refine conceptual systems, then let the same diagram guide your engineers as they write the code.
AI Accelerated
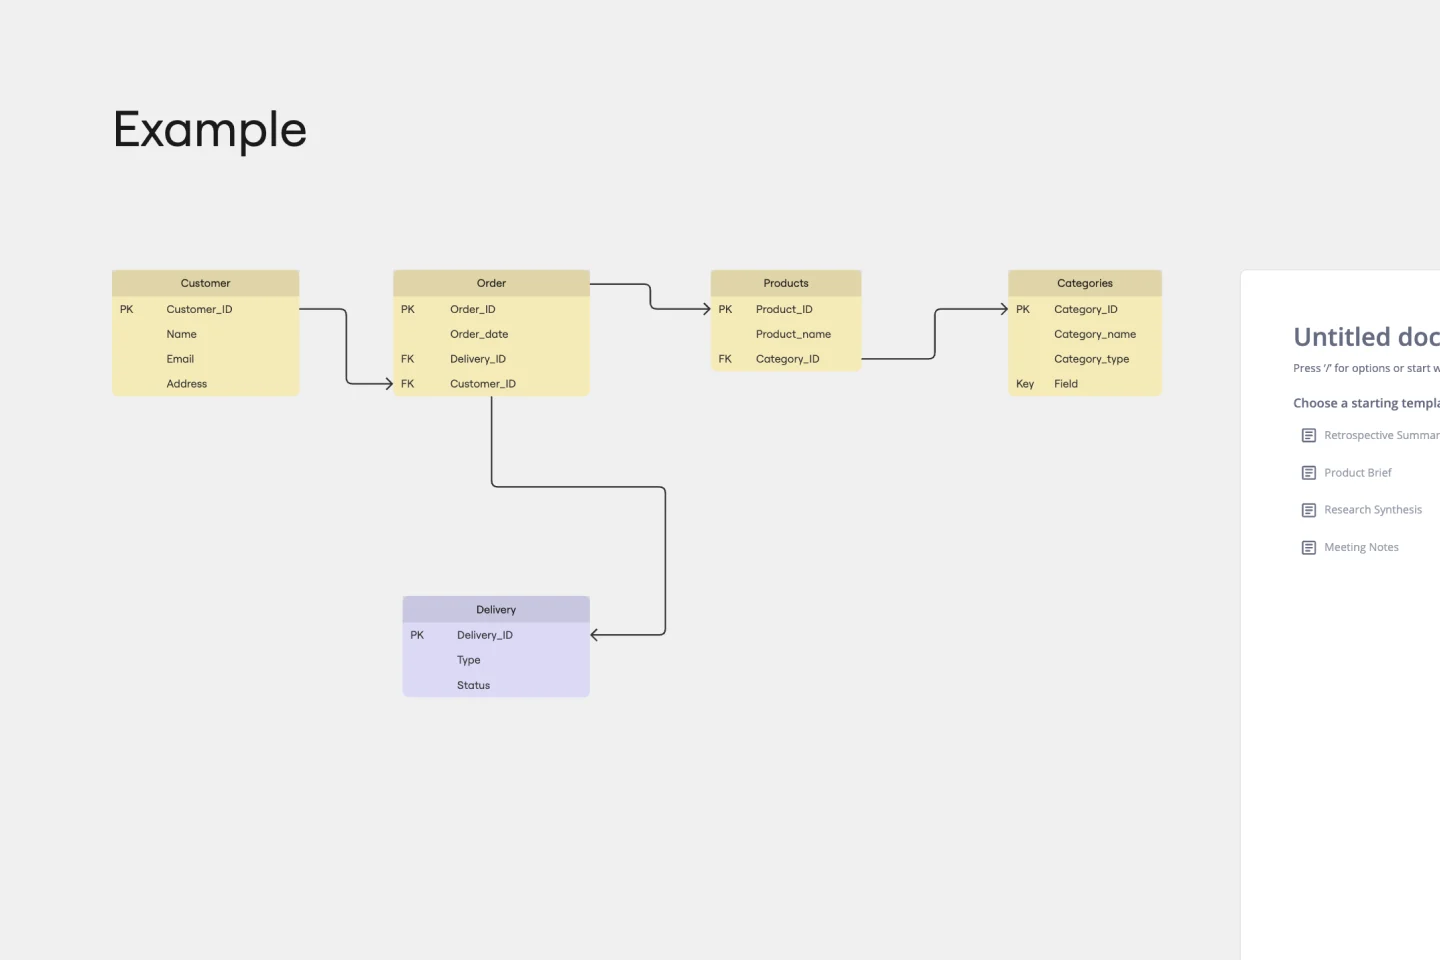
AI Entity Relationship Diagram Template
Sometimes the most important relationships in business are the internal ones—between the teams, entities, and actors within a system. An entity relationship diagram (ERD) is a structural diagram that will help you visualize and understand the many complex connections between different roles. When will an ERD come in handy? It’s a great tool to have for educating and onboarding new employees or members of a team, and our template makes it so easy to customize according to your unique needs.

Spider Diagram Template
Perfect for brainstorming sessions, project planning, or simply organizing thoughts, the Spider Diagram Template allows you to create 'legs' branching out from a central idea, representing related topics or subtopics.
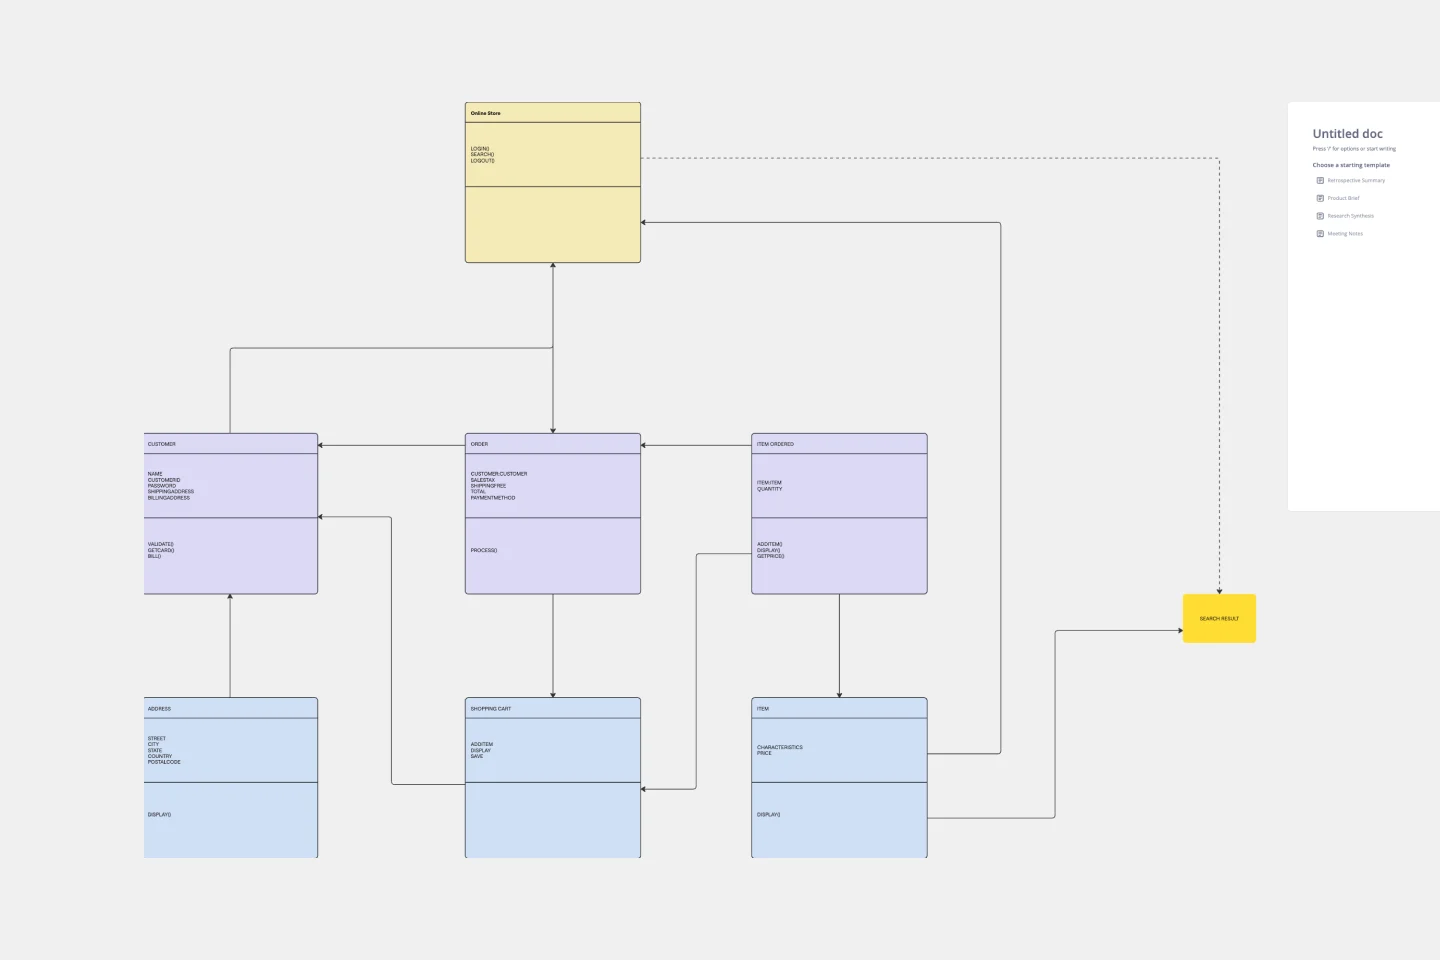
UML Diagram Template
Originally used as a modeling language in software engineering, UML has become a popular approach to application structures and documenting software. UML stands for Unified Modeling Language, and you can use it to model business processes and workflows. Like flowcharts, UML diagrams can provide your organization with a standardized method of mapping out step-by-step processes. They allow your team to easily view the relationships between systems and tasks. UML diagrams are an effective tool that can help you bring new employees up to speed, create documentation, organize your workplace and team, and streamline your projects.
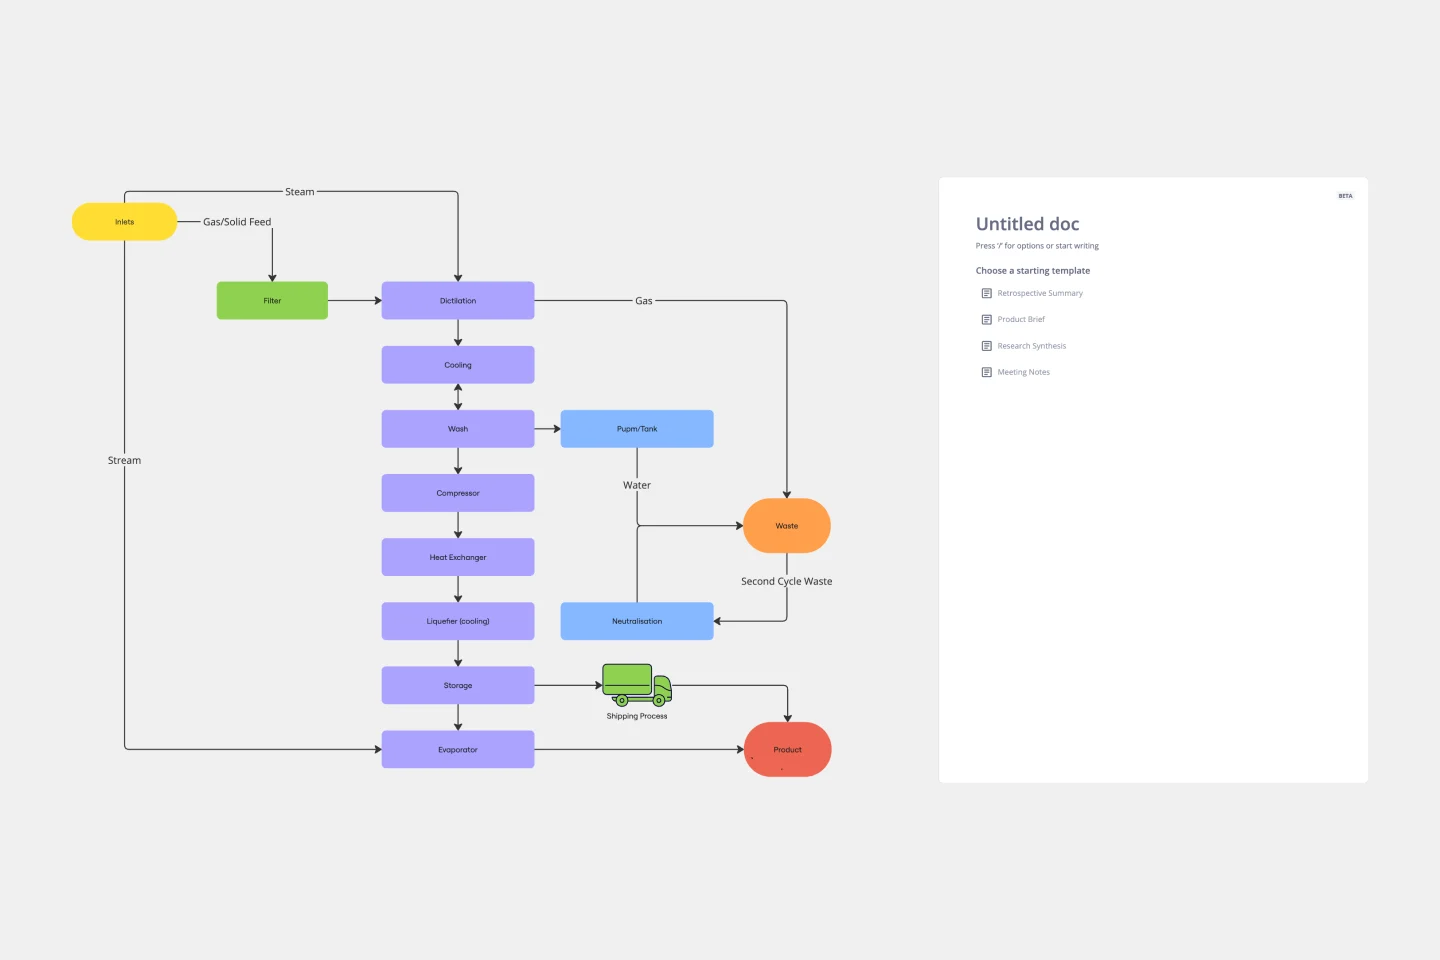
Block Diagram Template
Use this template to illustrate technical systems. Blocks represent important objects in the system, and arrows demonstrate how the objects relate to each other. Perfect for engineers, workflow managers, or anyone trying to build a better process.
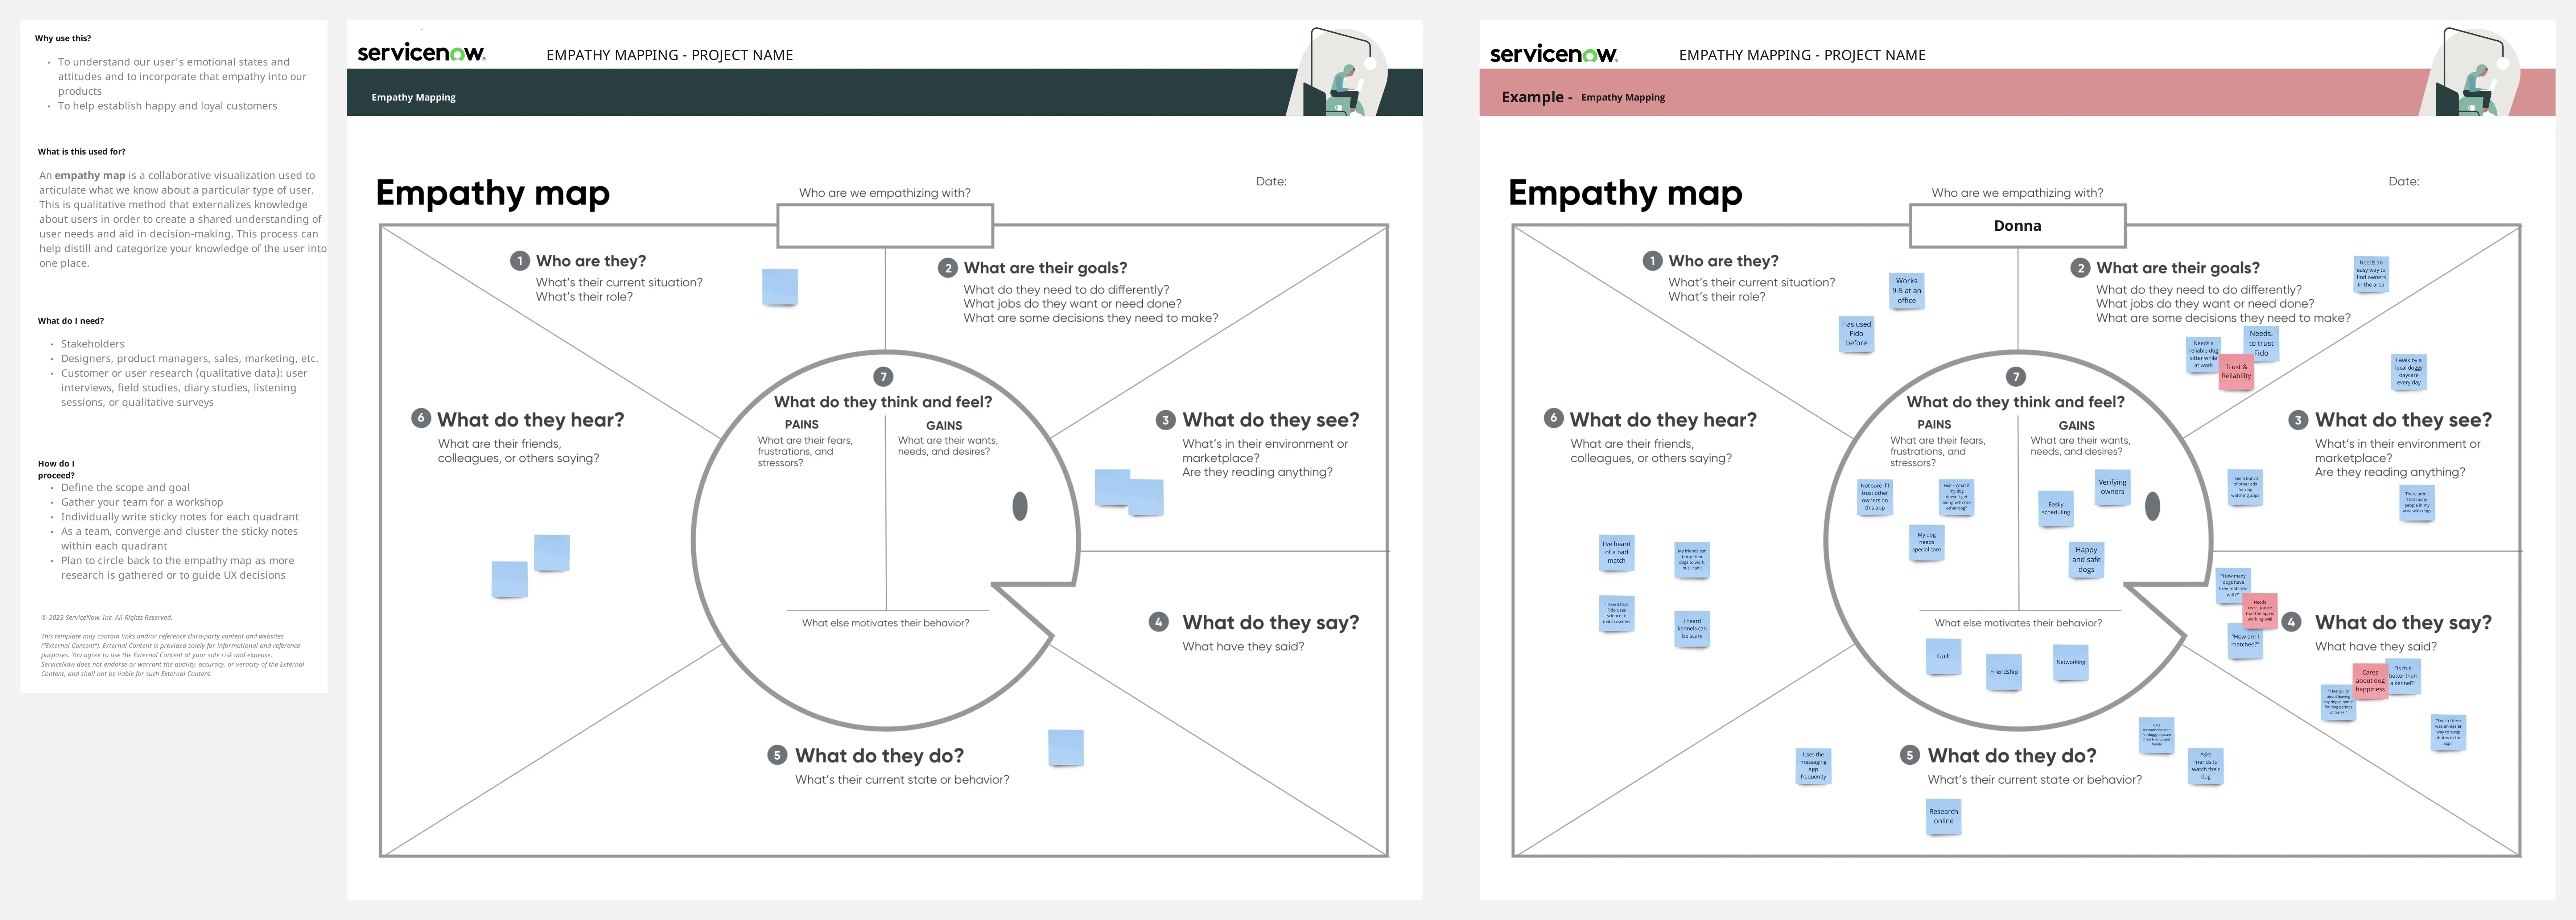
Empathy Mapping
The Empathy Mapping template helps teams capture detailed user insights. By understanding user perspectives, you can improve product features and customer satisfaction. This template is perfect for user research and product development.
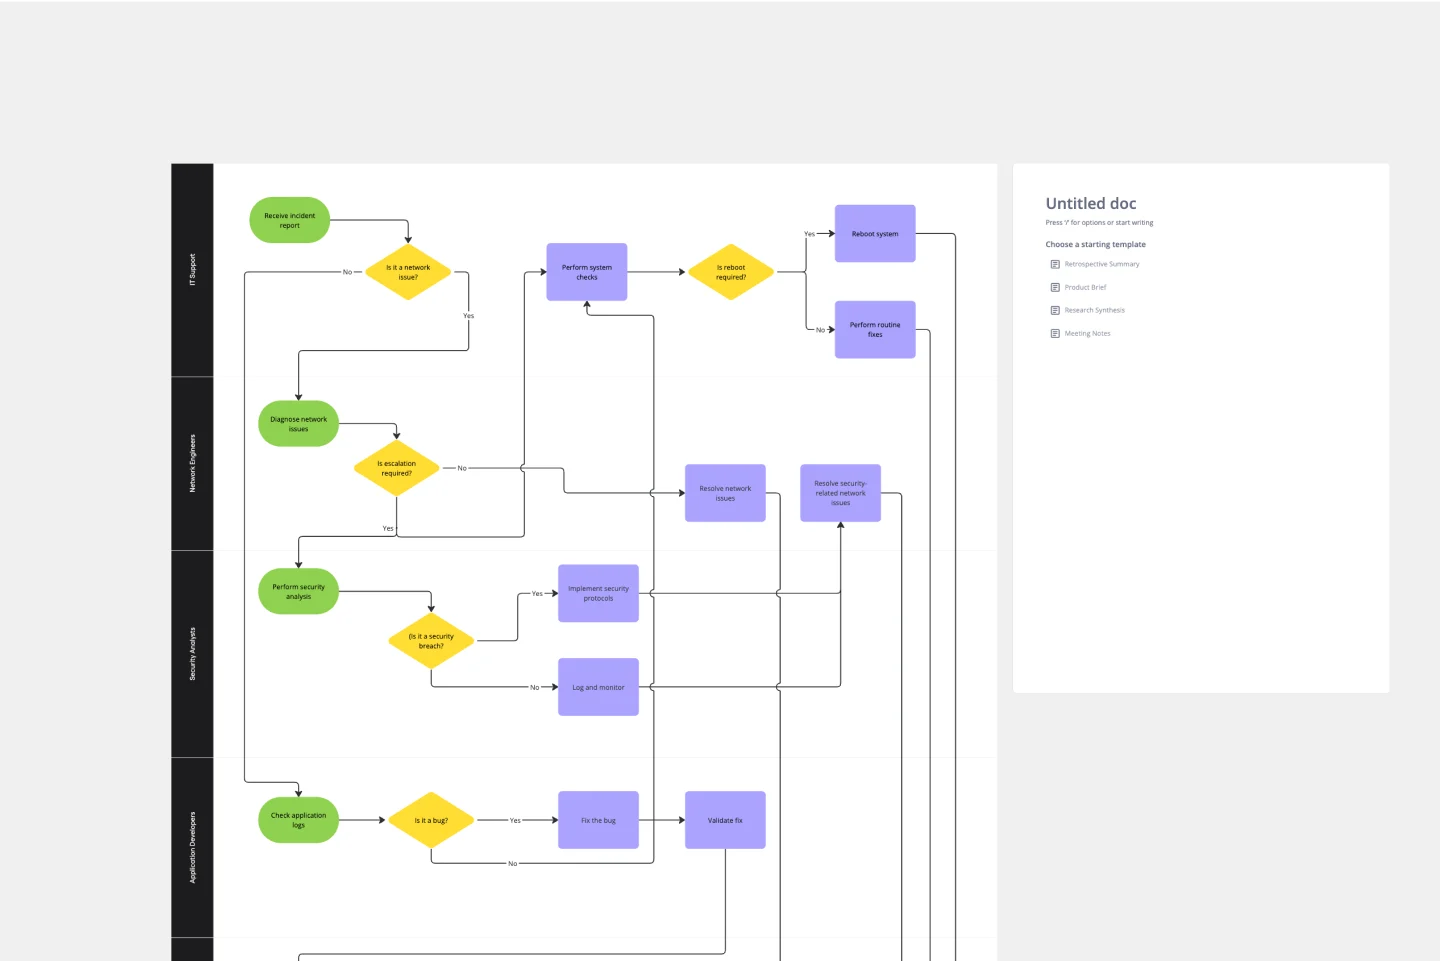
Incident Management Process Flowchart Template
The Incident Management Process Flowchart Template in Miro is designed to streamline and clarify the process of managing incidents within an organization. This template serves as a visual guide that outlines the steps involved in incident management, from the initial declaration to the final review. It is a living document, continuously evolving based on feedback and lessons learned from past incidents, ensuring that the process remains up-to-date with best practices. By defining incidents as disruptions requiring a coordinated response to restore service levels, the template emphasizes the importance of a structured, organized, and timely approach. It covers various phases such as Incident Declaration, Assessment, Response, Communication, and Review, providing a clear framework for teams to follow.
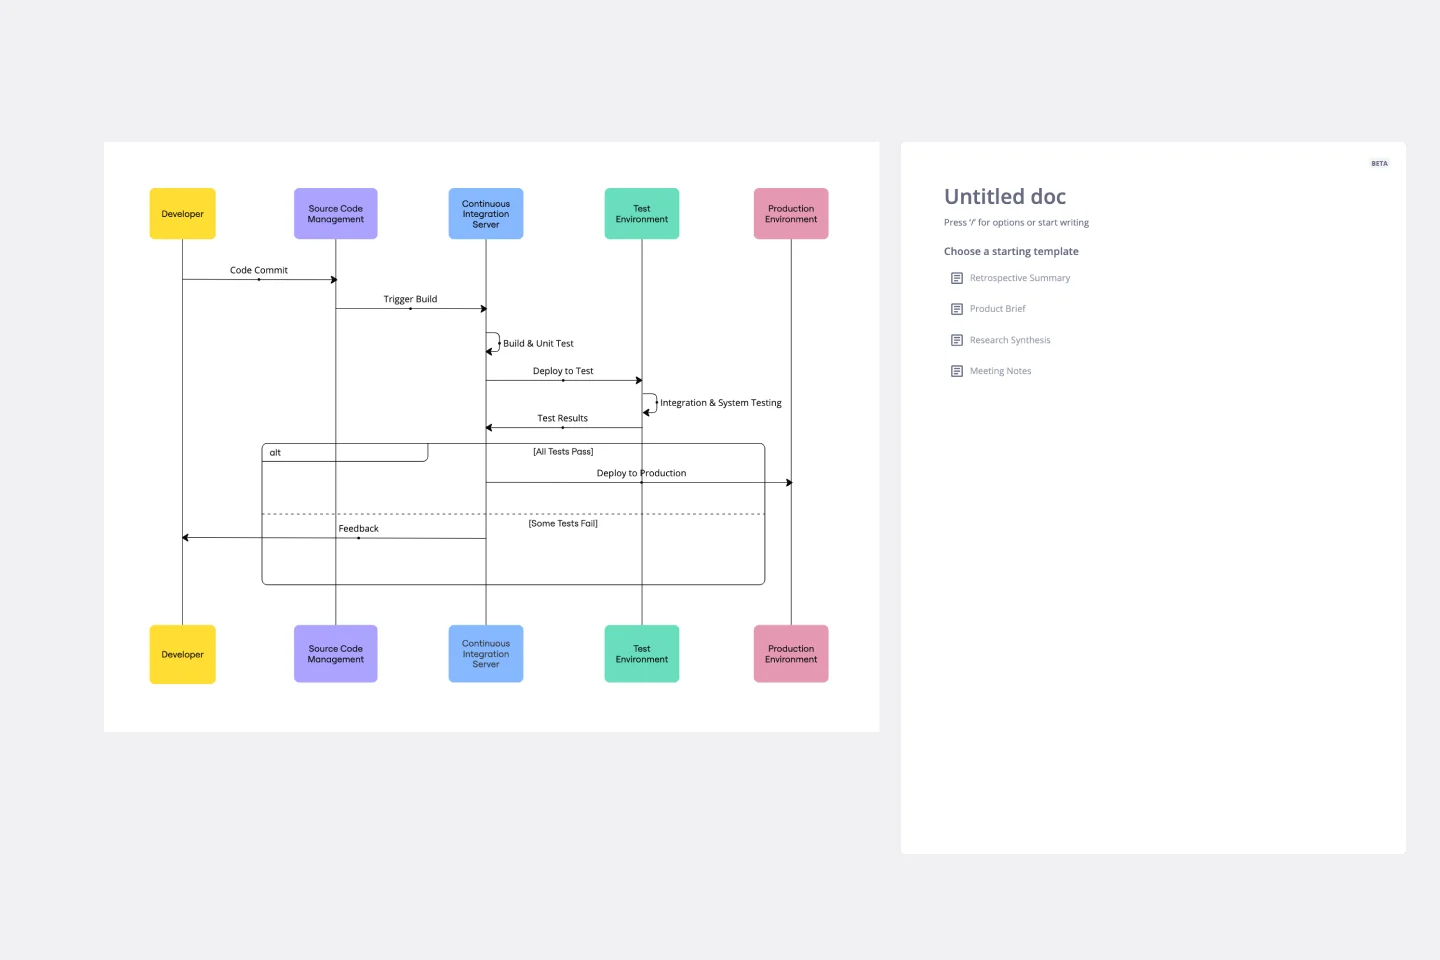
UML Sequence Deployment Pipeline Template
The UML Sequence Deployment Pipeline Template in Miro visually maps the sequence of steps in an automated deployment pipeline, helping teams in software development and deployment. It helps identify bottlenecks, standardizes the deployment process, and facilitates new member onboarding for continuous improvement.
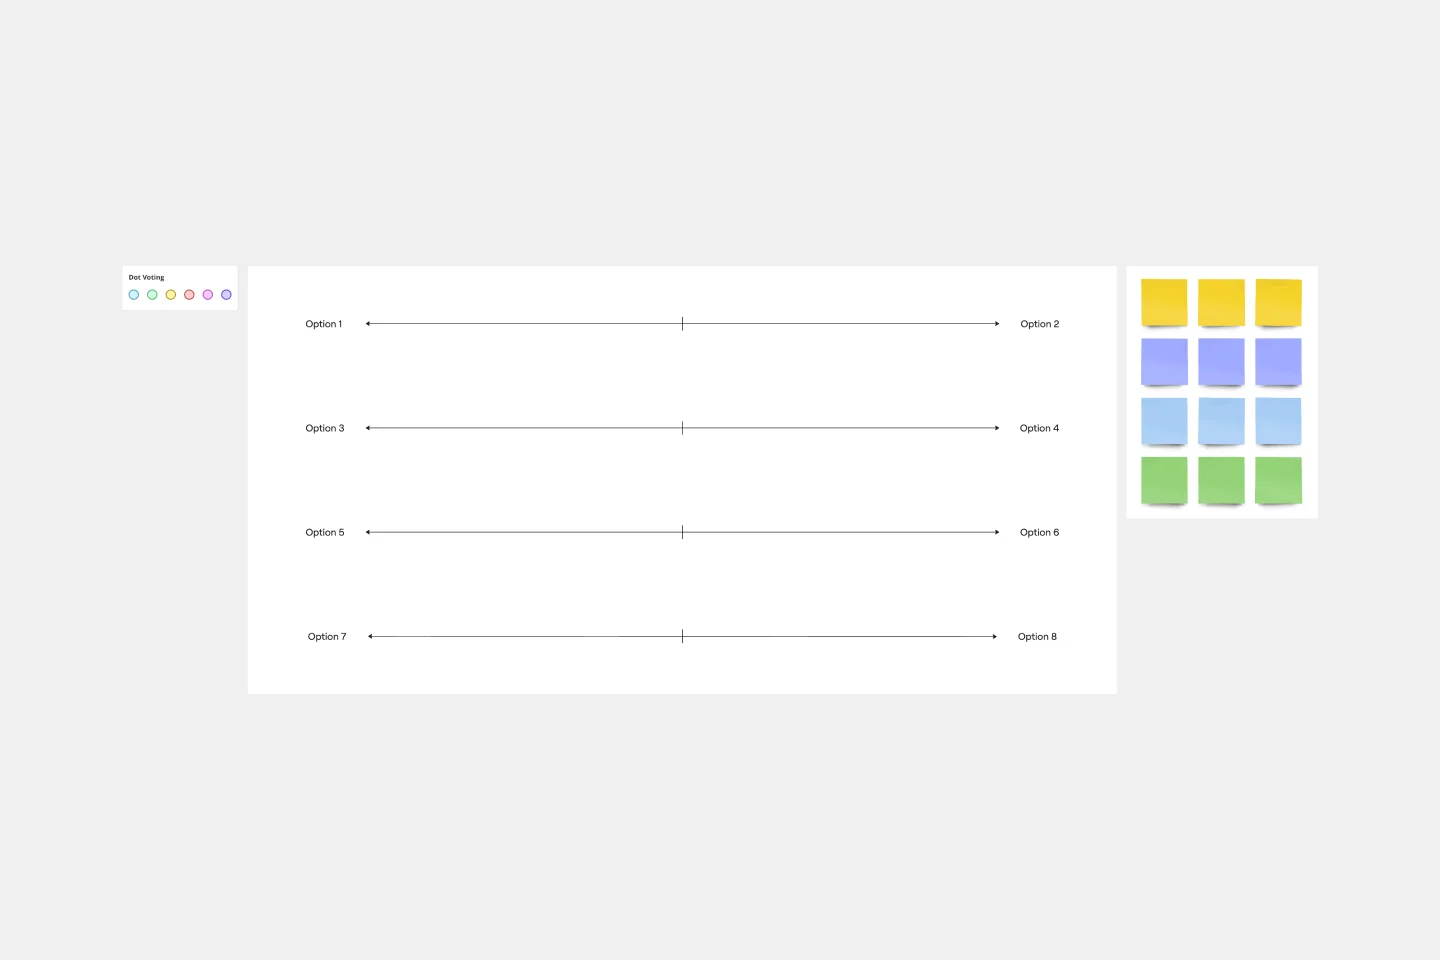
Likert Scale Template
It’s not always easy to measure complex, highly subjective data — like how people feel about your product, service, or experience. But the Likert scale is designed to help you do it. This scale allows your existing or potential customers to respond to a statement or question with a range of phrases or numbers (e.g., from “strongly agree” to “neutral,” to “strongly disagree,” or from 1 to 5). The goal is to ask your customer some specific questions to turn into easy-to-interpret actionable user insights.
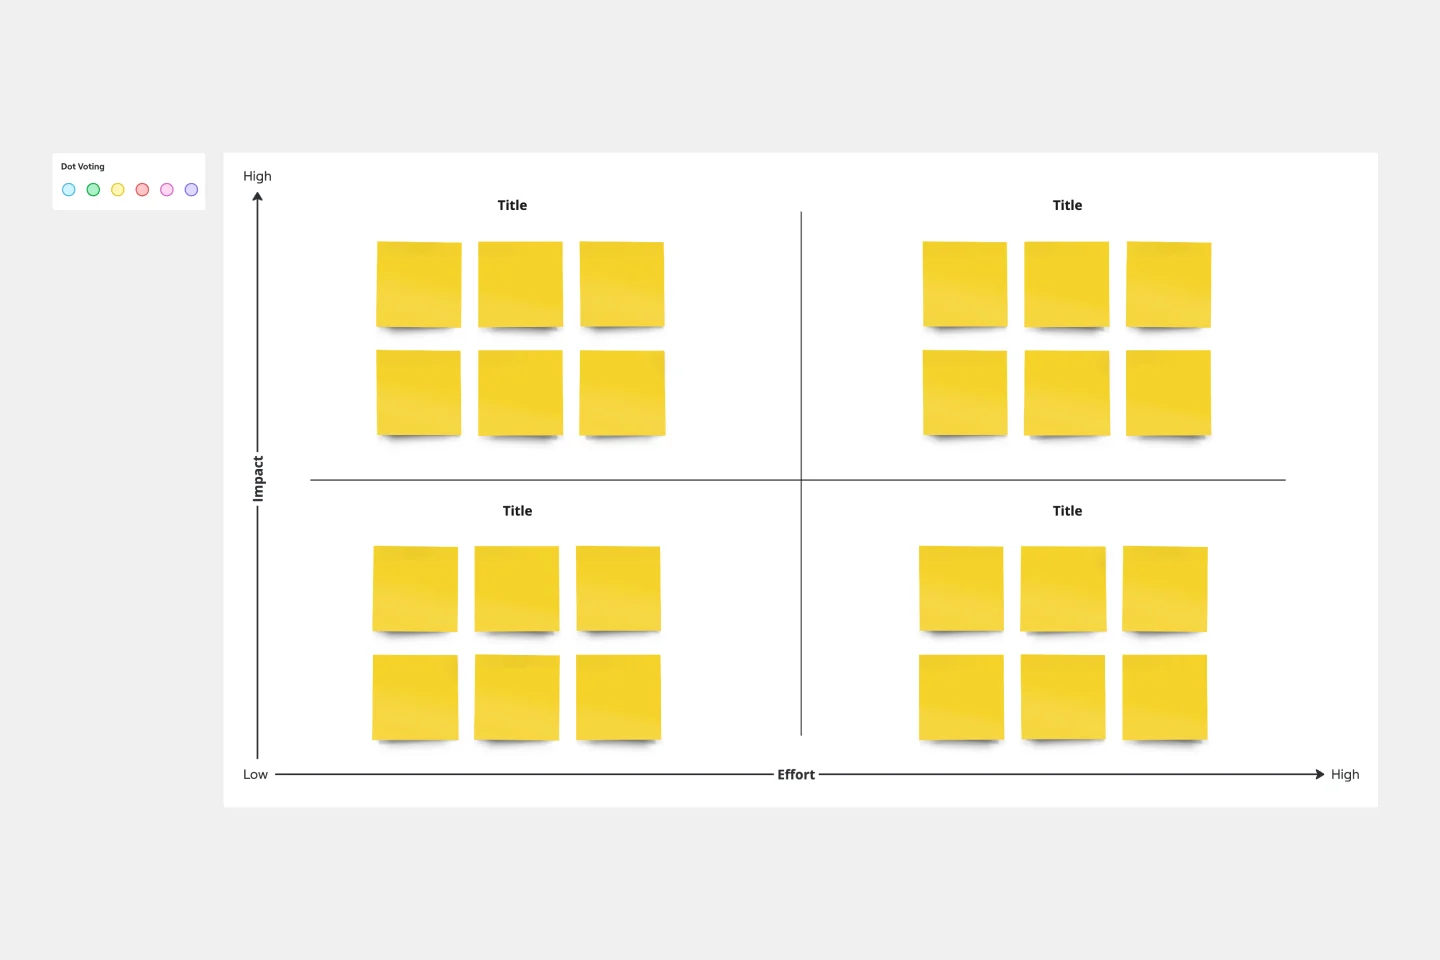
Action Priority Matrix Template
You and your teammates probably have more ideas than resources, which can make it difficult to prioritize tasks. Use an Action Priority Matrix to help choose the order in which you will work on your tasks, allowing you to save time and money and avoid getting bogged down in unnecessary work. An Action Priority Matrix is a simple diagram that allows you to score tasks based on their impact and the effort needed to complete them. You use your scores to plot each task in one of four quadrants: quick wins, major projects, fill-ins, and thankless tasks.
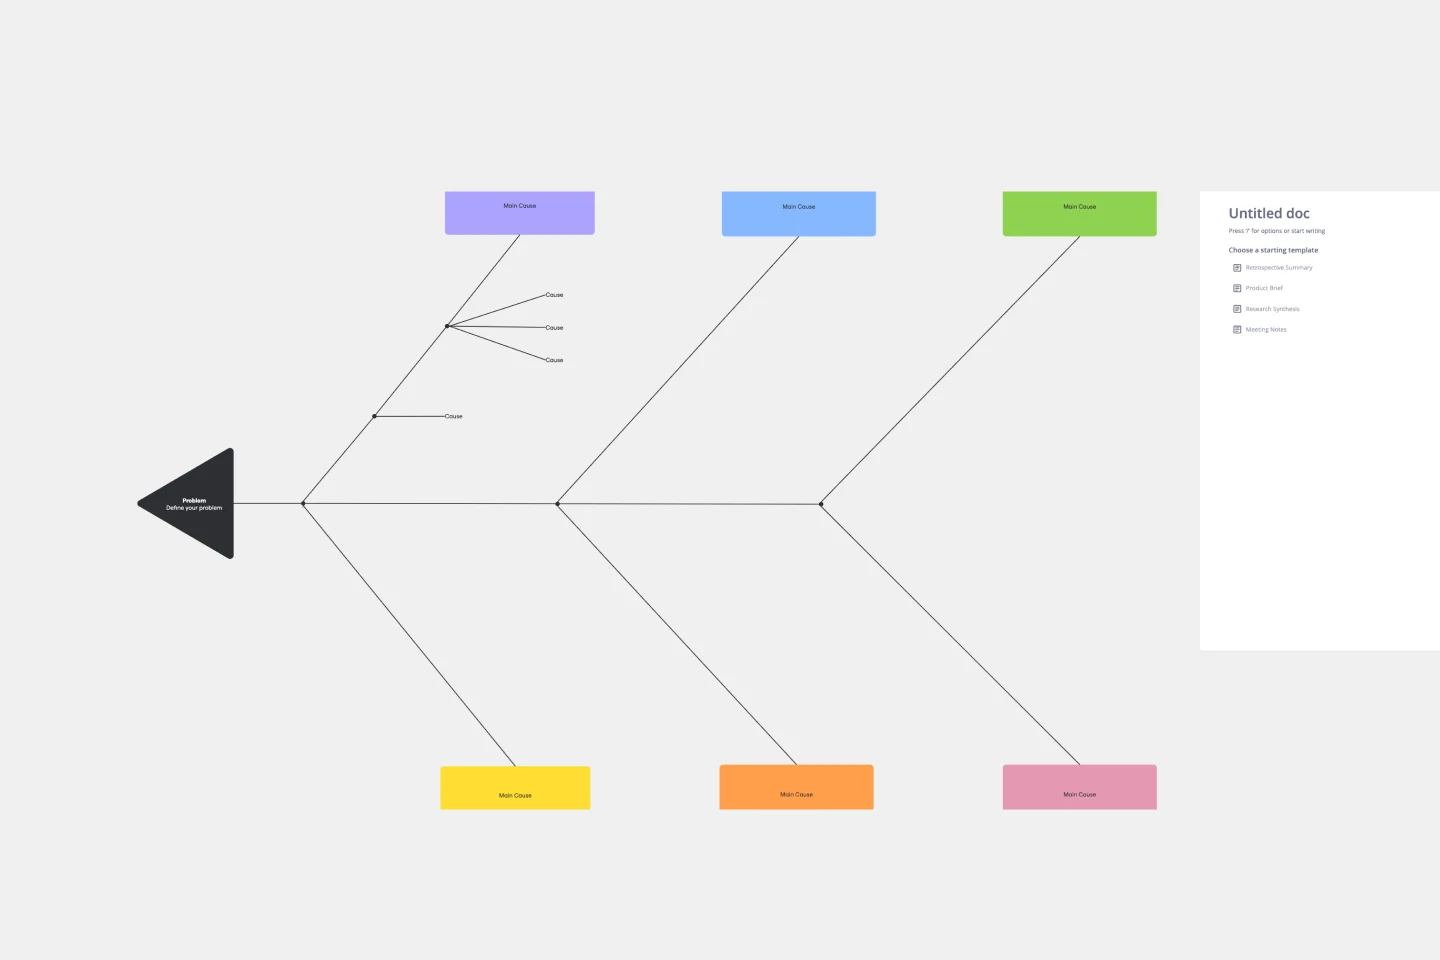
Cause and Effect Diagram Template
The Cause and Effect Diagram Template is a useful tool for analyzing complex relationships, identifying root causes of problems, and improving organizational processes. It can be customized to fit user's unique needs and provides a structured framework for analysis. Teams can use real-time collaborative analysis on the Miro platform to drive continuous improvement initiatives.
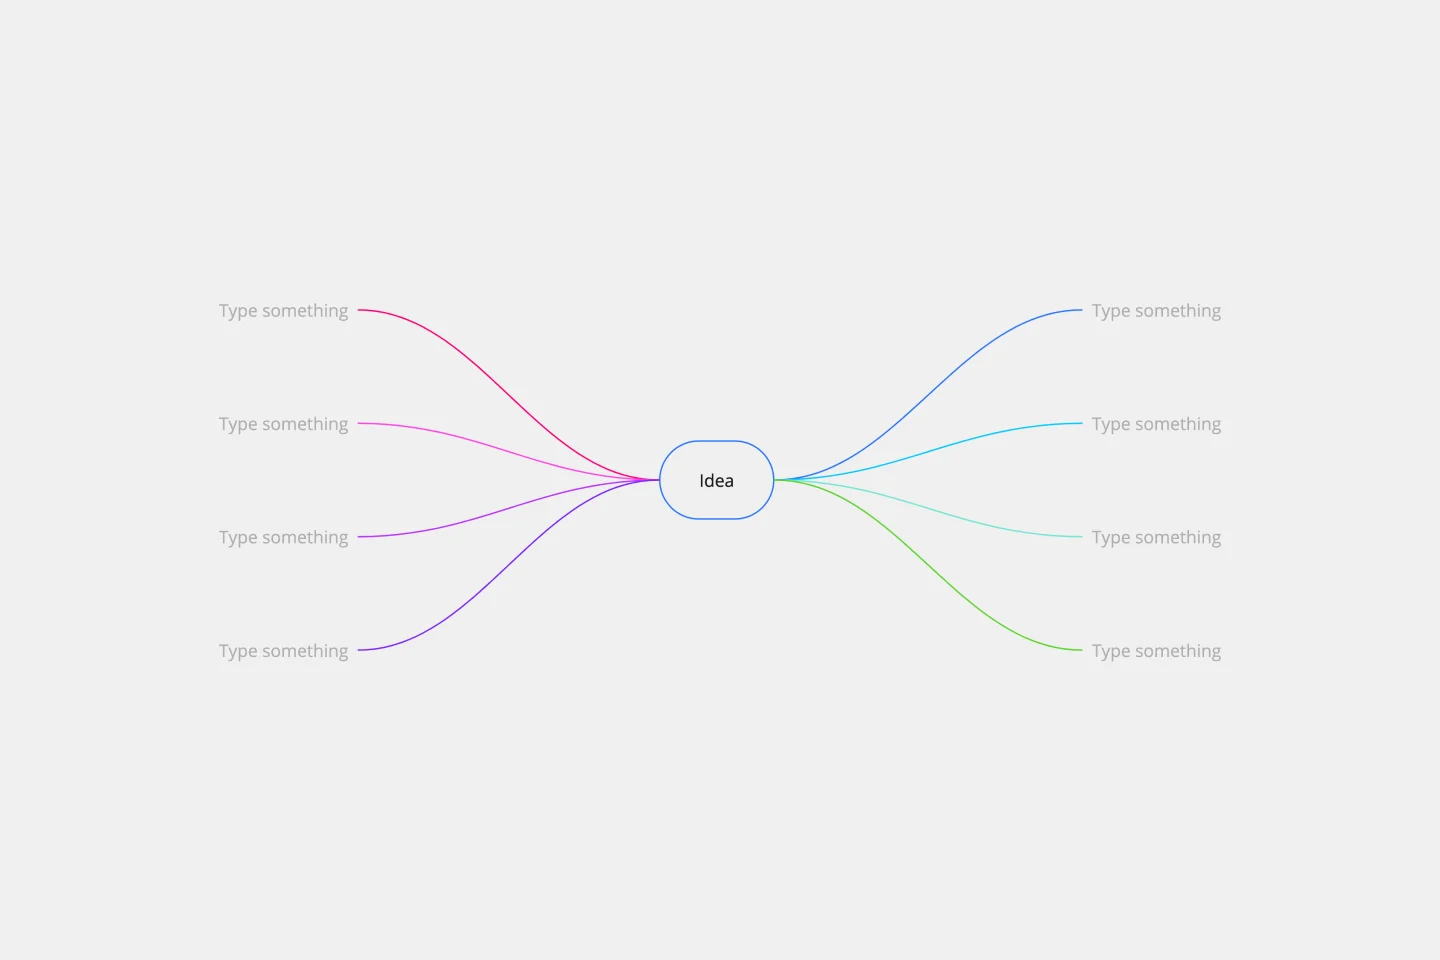
Random Words Template
Random word brainstorming is a simple, creative technique using random words to generate new ideas and creative solutions to your problems. Using random word prompts allows you to step beyond traditional boundaries and address challenges from a different direction. Random word brainstorming allows your team to unlock their creativity to solve business problems, create new inventions, improve existing ideas, or just think about problems in a new way.

4-Circle Venn Diagram Template
The 4-Circle Venn Diagram Template has an easy, interactive, and dynamic way to visualize complex relationships between data sets. Empower your team's collaboration and communication with this powerful tool.

Workflow Diagram Template
The Workflow Diagram Template maps out and represents processes or systems using standardized symbols and shapes. By delineating the various steps or stages in a process, it ensures that tasks flow seamlessly from initiation to completion. One of the standout benefits of using this template is its clarity. By translating processes into a visual format, all participants can gain a comprehensive understanding at a glance, eliminating confusion and ensuring everyone is on the same page. This clarity not only promotes efficient task execution but also fosters collaboration among team members.
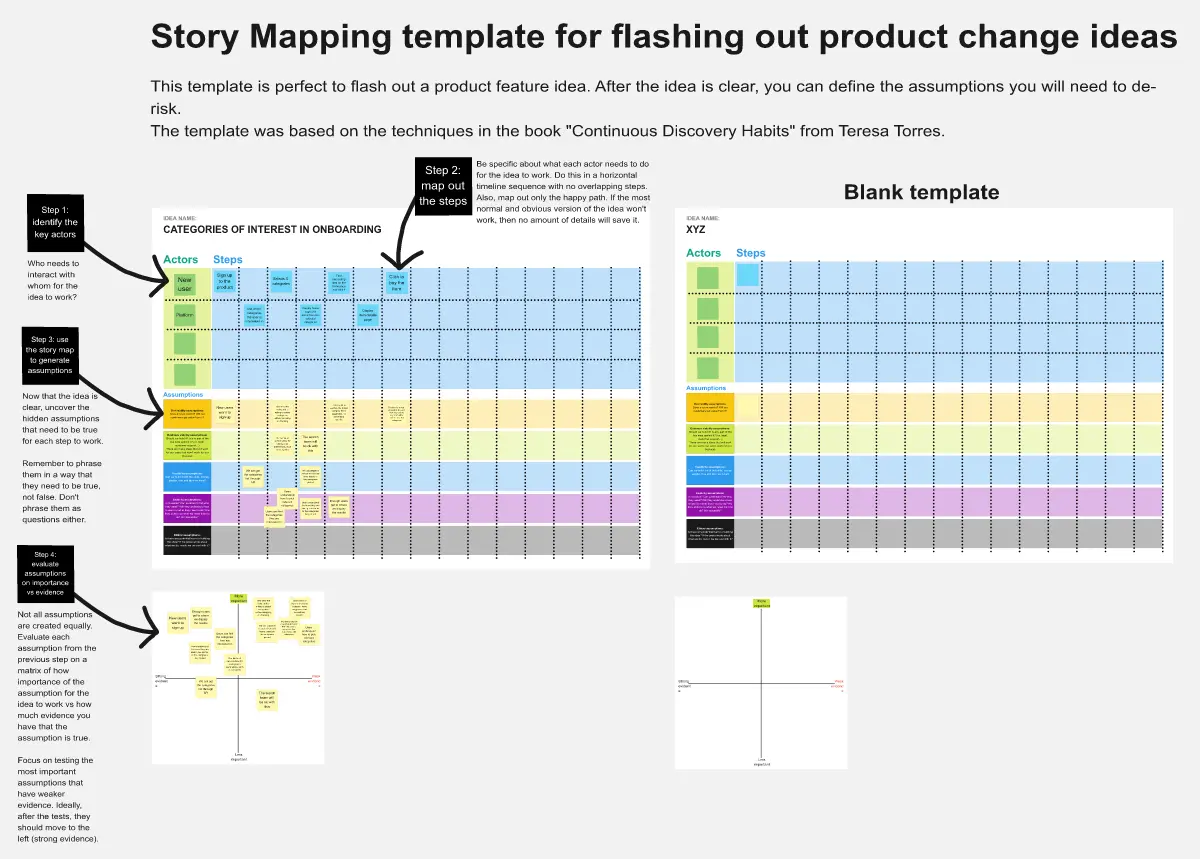
Story Mapping
This template is perfect for product teams to flash out a feature idea.
Strategy Map Template
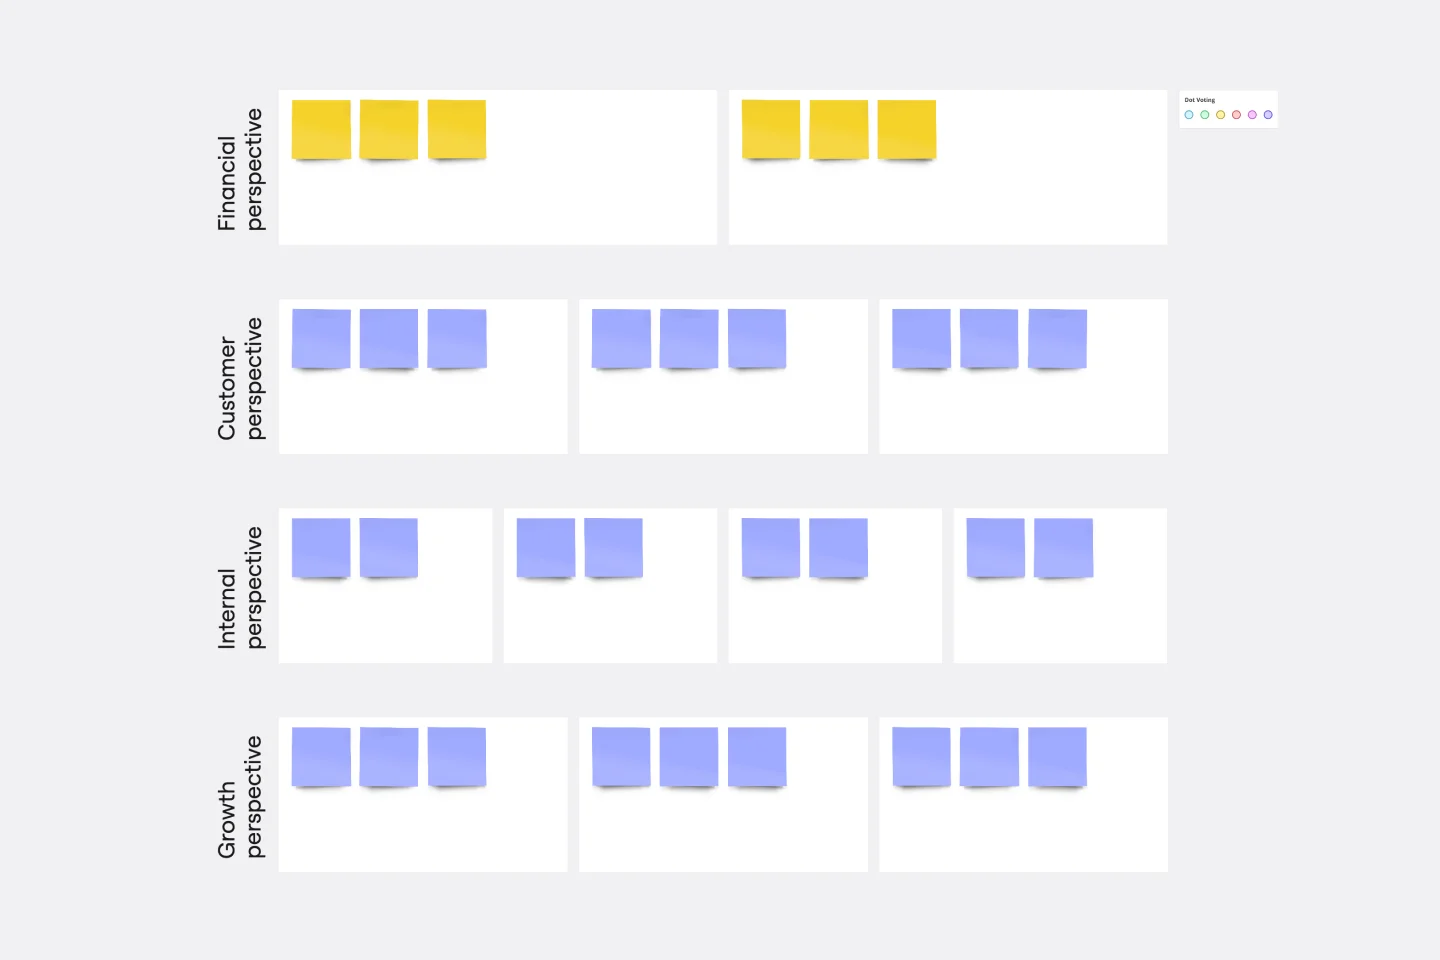
How do your individual or team goals relate to an organization’s overall strategy? A Strategy Map is a stylized picture of your organization’s strategy and objectives. It’s powerful because it provides a clear visual guide to how these various elements work together. Strategy Maps can help align various different team goals with the overall strategy and mission. With the Strategy Map in place, teams can create set actionable, relevant KPIs. Strategy mapping is often considered part of the balanced scorecard (BSC) methodology, which is a strategic planning tool for setting overall team goals.
Miro's mapping and diagramming templates collection is designed to streamline the process of creating visual representations of complex information. Whether you're mapping out a customer journey, designing a flowchart, or creating a mind map, Miro offers a wide range of templates to suit your needs. These templates are crafted to help you start quickly and collaborate effectively with your team, ensuring that everyone is on the same page from the get-go.
Using Miro's mapping and diagramming templates comes with numerous benefits:
Ease of use: Start diagramming from scratch or choose from a variety of pre-made templates. The intuitive tools and frameworks make it easy to create professional diagrams without any prior experience.
Collaboration: Share your diagrams with teammates and collaborate in real time. Discuss, refine, and iterate directly on the board, making the process seamless and efficient.
Versatility: The templates cater to various needs, from customer journey maps to technical diagrams, ensuring that you have the right tool for any project.
Efficiency: Save time with ready-to-use templates that can be customized to fit your specific requirements. This allows you to focus more on the content rather than the design.
Export and presentation: Once your diagram is ready, easily export it in various formats for presentations or further use.
Choose a template: Browse through the collection or use the search bar to find a specific template that fits your needs. Click on the template to preview it.
Customize the template: Modify the template to suit your project. Add or remove elements, change colors, and insert text to make it your own.
Collaborate with your team: Share the board with your team members. Use Miro's collaboration features to work together in real time, leaving comments and suggestions directly on the board.
Finish and export: Once your diagram is complete, use the export options to save it in your preferred format. You can also present it directly from Miro using the presentation.
Use advanced features: Take advantage of Miro's advanced diagramming features such as smart diagramming tools, which include workflows for methodologies like Business Process Modeling Notation (BPMN), Unified Modeling Language (UML), Data Flow Diagrams (DFD), and Entity Relationship Diagrams (ERD). These tools can help you create more sophisticated and detailed diagrams.
Incorporate integrations: Enhance your diagrams by integrating Miro with other services. Explore the Miro Marketplace to find apps that can enrich your diagramming experience, such as importing diagrams from other tools or exporting your Miro diagrams to different formats.
Leverage shape libraries: Use the extensive shape libraries available in Miro. These libraries are organized into logical categories, making it easy to find the right shapes for your diagrams. You can also switch types of shapes and customize them to fit your needs.
Embed and share: Once your diagram is complete, you can embed it directly into your company's documentation or share it with stakeholders. Miro's sharing options make it easy to collaborate and get feedback from your team.
Miro's mapping and diagramming templates are designed to help teams visualize complex information, streamline workflows, and enhance collaboration. By using these templates, teams can save time, improve efficiency, and create professional diagrams that facilitate better understanding and decision-making. With Miro, your team can thrive by turning ideas into actionable plans and achieving your goals together.