About the Workflow Diagram Template
When seeking clarity in processes, visual assets often come to the rescue. Enter the workflow diagram template. This tool is designed to streamline operations, elucidate roles, and illuminate the path from task initiation to completion. It's a bridge between mere ideas and actual, tangible results, ensuring seamless progress for projects of all scales.
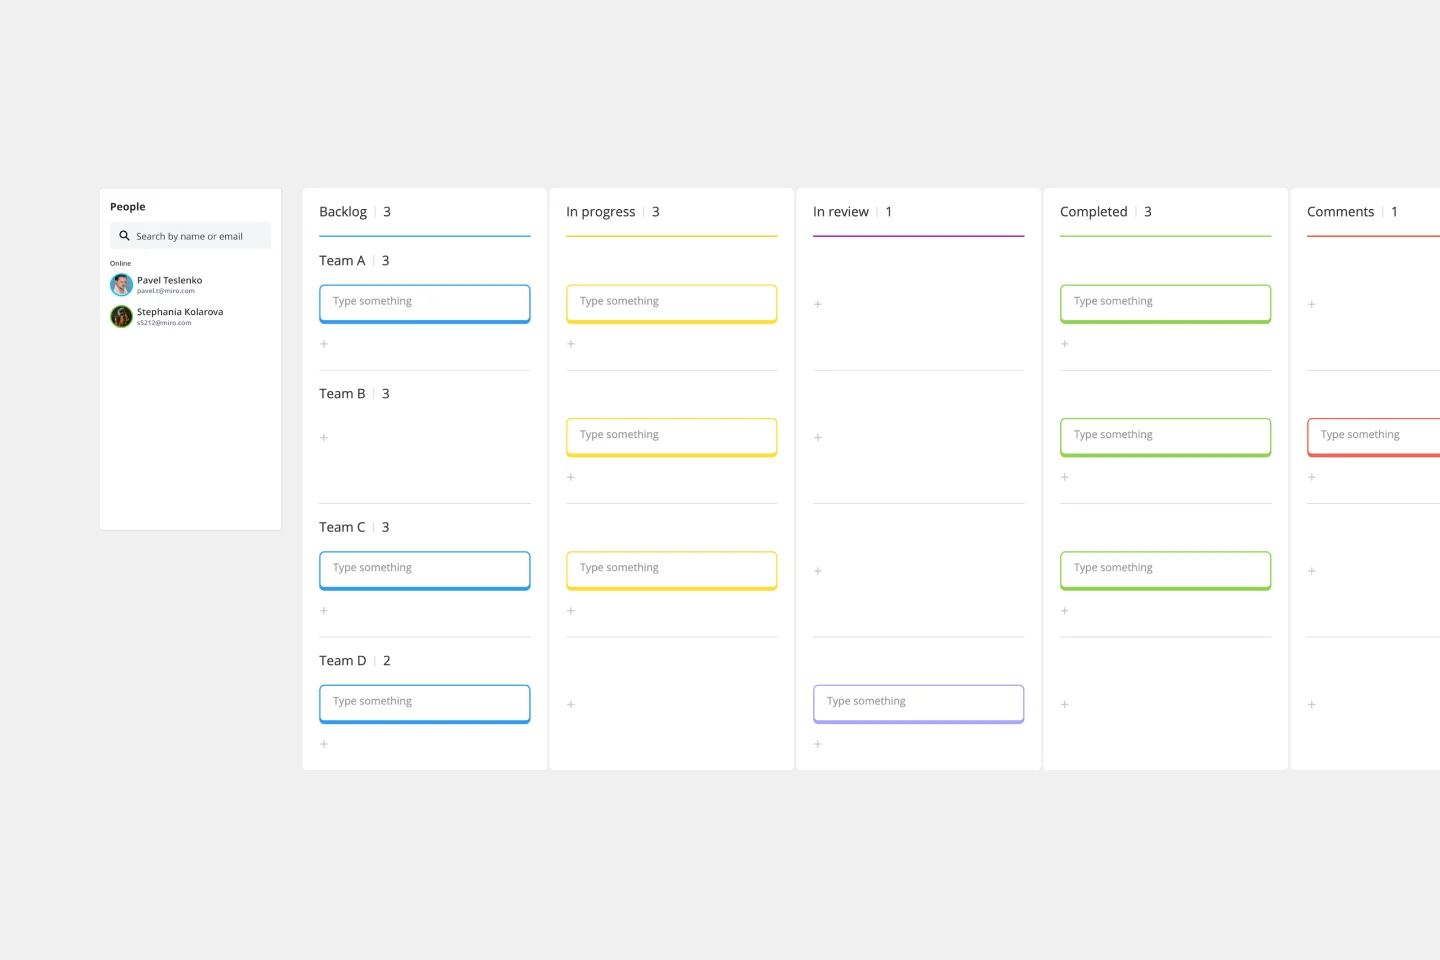
Using standardized symbols and shapes, the workflow diagram template depicts a process's various steps or stages and the flow of tasks between them. This is crucial for understanding, analyzing, and optimizing processes to enhance efficiency and ensure clarity among all team members.
How to use the workflow diagram template?
1. Add the template
Select the template in the Templates Library.
2. Customize it
Tailor the template to your needs effortlessly. Add, remove, or rearrange stages and steps by clicking on the shapes and connection lines. Edit color, font, and shape size using the context menu bar above the shape.
3. Expand your workflow diagram
As your process grows or changes, click on the shapes to expand or adapt your diagram.
4. Embed artifacts
Enhance your workflow diagram by adding any required artifacts. Be it documents, images, links, or notes – integrate them by uploading via a link or with the drag and drop feature.
Why should you use a workflow diagram template?
Increase clarity and understanding: By visually representing tasks and the flow between them, everyone gets a clearer picture of what needs to be done and how.
Optimize processes: Visualizing a process can help identify redundancies, bottlenecks, and inefficiencies. Once identified, steps can be rearranged, removed, or streamlined as needed.
Promote consistency: A standardized process ensures that tasks are executed consistently, resulting in predictable outcomes.
Increase collaboration: By laying out the entire process, team members can see where their tasks fit into the bigger picture, fostering collaboration and unity.
Use as a training tool: For newcomers or those unfamiliar with the process, a visual workflow can act as a guide, helping them learn and understand their roles and responsibilities faster.
Using process mapping software can be a game changer when you need to connect teams, optimize business processes, and scale your organization. Also, discover more workflow diagram examples to propel your projects futher.
Workflow diagram template FAQs
Is the template suitable for complex processes?
The template can be expanded and customized to cater to simple and complex processes. The automated diagram feature ensures that complexity doesn't interfere with clarity.
Can multiple team members work on the template simultaneously?
The platform supports real time collaboration, allowing multiple team members to edit, comment, and view the diagram simultaneously.
Can I integrate the workflow diagram with other tools?
Yes! The platform offers seamless integration capabilities, allowing you to link your workflow diagram with other tools and platforms you might be using, making it a central hub for all your process-related needs.