7 likes
384 uses
The Likert scale is a rating system you can use to measure complex, subjective data such as how people feel about your product, service, or experience. This template makes it easy to conduct user interviews and gather feedback.
With the Likert scale template, users can pick out a possible response to a statement or question that’s either expressed in words or numbers.
Examples of responses include a range such as “strongly agree,” “neutral,” “agree,” “disagree” or “strongly disagree,” or “strongly satisfied” to “strongly dissatisfied.”
You can also use numbers, such as 1 = “strongly agree,” 2 = “agree,” and so on.
The Likert scale is either a five (or seven) point scale of response options that asks your customer or interview subject to agree or disagree with a statement.
The scale assumes that the intensity of someone’s attitude or opinion is linear, ranging from strongly agree to strongly disagree, and assumes that attitudes can be measured.
For example, each of the five (or seven) responses would either be counted in terms of how often a sentiment was expressed or have a numerical value that would be used to measure the attitude being explored.
Likert data can be a reliable source to point to how people think and feel, as long as you’re aware of the when-in-doubt-just-agree tendency.
To reduce the impact of this bias, researchers can...
Phrase questions as statements: presenting facts for customers to align with (or reject) can offer insight into different pieces of your business. Accordingly, the score averages give you a general measure of satisfaction that you can track over time and try to improve.
Include and evaluate both positive and negative statements, in pairs, for consistency: instead of measuring one-off sentiments, see if your customers are reliably in agreement, disagreement, or neutral in more than one instance.
Researchers across disciplines, from UX to marketing to customer experience, can use a Likert scale to measure statements of agreement.
Depending on your product, service, or experience, the scale can also be used to measure:
Agreement: Strongly agree → Strongly disagree
Frequency: Often → Never
Quality: Very good → Very bad
Likelihood: Definitely → Never
Importance: Very important → Unimportant
To get a more accurate measurement of everyone’s responses, it’s worth asking people to agree or disagree with multiple statements. You can then combine or average a person’s responses.
Get started by selecting the Likert scale template, then take the following steps to make one of your own:
Decide what you’d like to measure. This is the foundation for your research. Ensure that what you’re measuring can be scaled on the strength of opinions, attitudes, feelings, or experiences. Customers should see two clear extremes (positive and negative) and a neutral midpoint.
Create or edit the indicator statements or questions. The scale works best when you’re trying to find customer insights that can’t be understood with just one answer. An example statement could be, “The number of items on the takeaway menu overwhelms me.” Every statement (or each question) is trying to dig into what your customer actually feels.
Decide on Likert response scales. At a minimum, you can aim for a 5-point scale. At maximum, a 7-point scale. Any less or any more can compromise readability. Choose simple, clear language with different categories, such as “Agree - Disagree,” “Helpful - Not Helpful,” “Always - Never.” You can add or delete sticky notes (which can act as points and categories) accordingly.
Pre-test with your team. Share the Miro board with your team to test any unclear questions, awkwardly worded statements, or duplicate categories. Ask your team if every element on the scale can help you gather actionable feedback. If not, revise or delete that element.
Test (and re-test) as needed. Invite participants onto your board and ask them to respond to each statement or question. Data collection should be a process that you keep fine-tuning over time. Start with a small sample group of participants representing a larger group you’re trying to learn about. Refine – or expand – your point scale and category language as you get user feedback and calculate results.
Organize and import Likert Scale survey results visually from other sources. Import survey results as needed on your Miro board, to share and review with your team.

Miro
The AI Innovation Workspace
Miro brings teams and AI together to plan, co-create, and build the next big thing, faster. Miro empowers 100M+ product managers, designers, engineers, and more, to flow from early discovery through final delivery on a shared, AI-first canvas. By embedding AI where teamwork happens, Miro breaks down silos, improves alignment, and accelerates innovation. With the canvas as the prompt, Miro's collaborative AI workflows keep teams in the flow of work, scale shifts in ways of working, and drive organization-wide transformation.
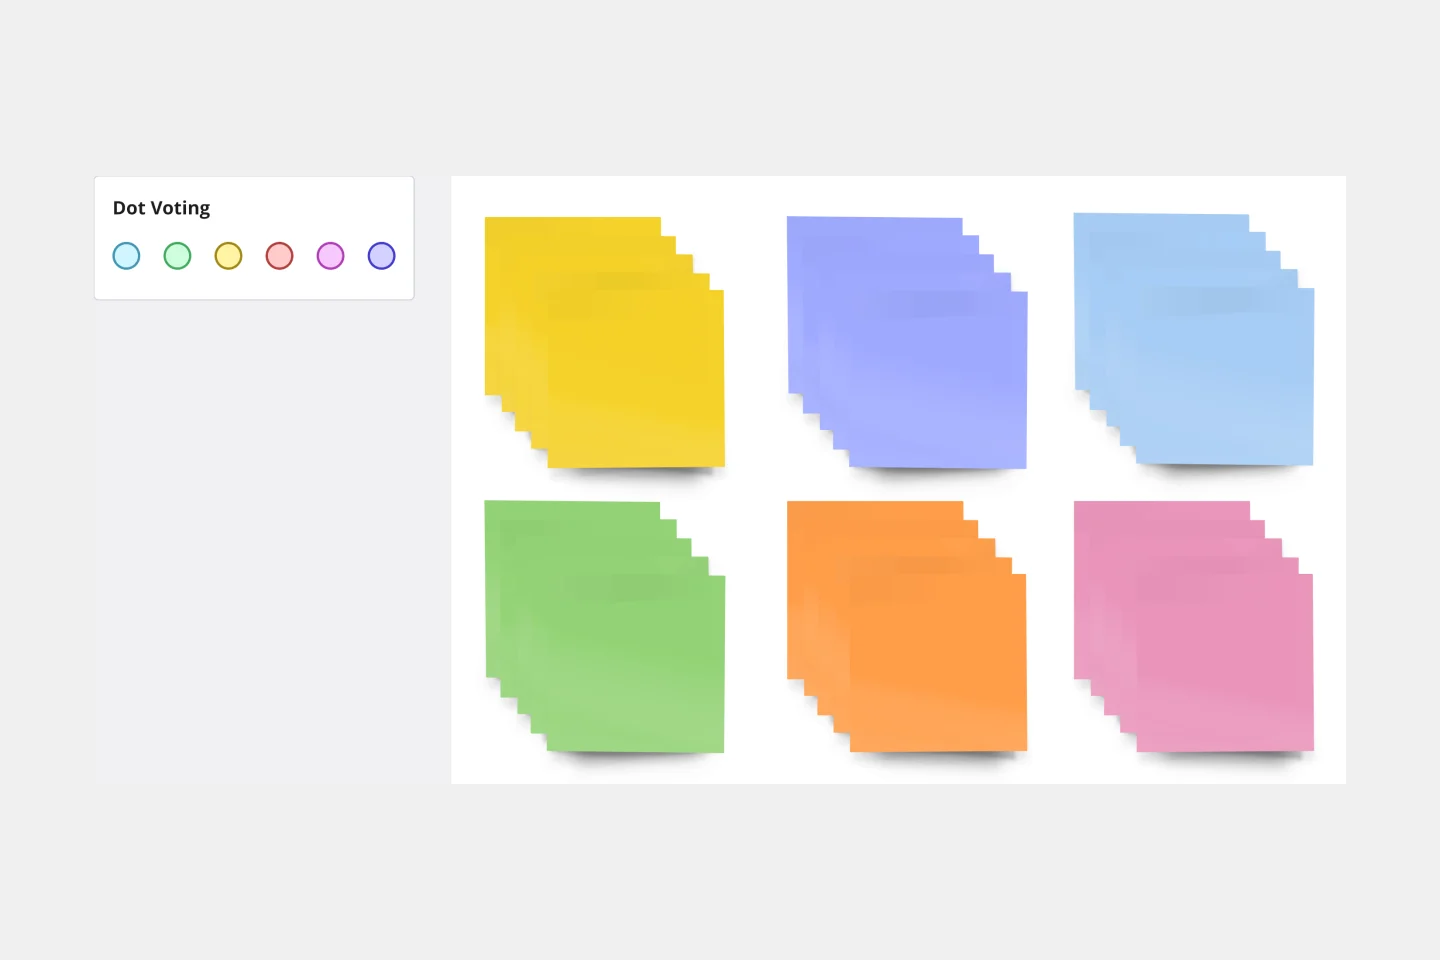
Sticky Note Packs Template
Use Miro’s Stickies Packs template to facilitate your brainstorming and group sessions. Use them to organize your ideas, collaborate as a team, and encourage participation from everyone involved.
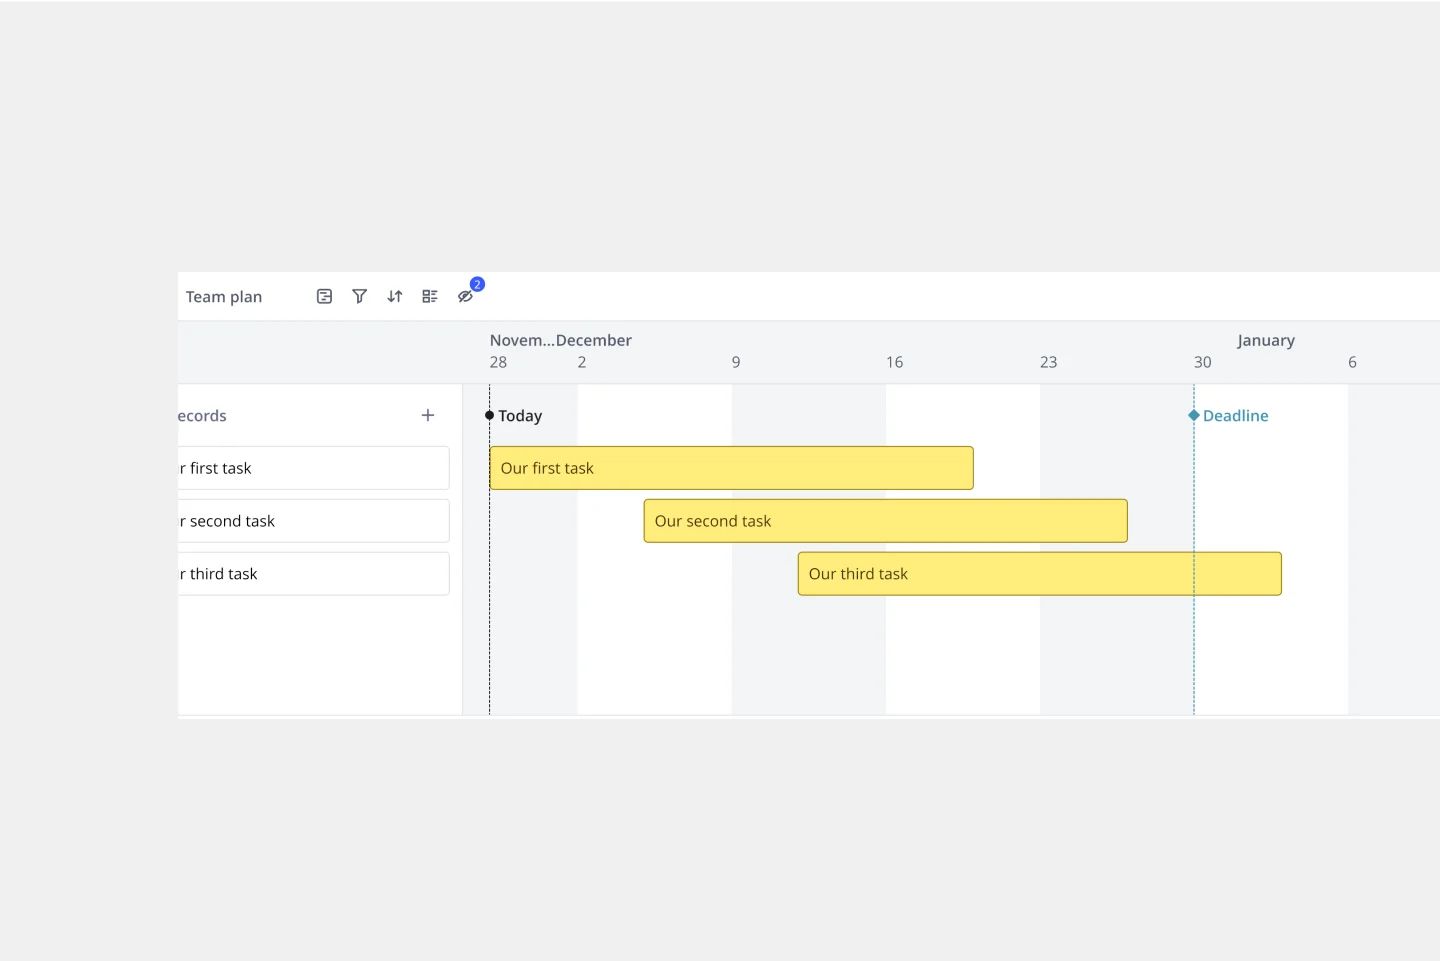
Timeline Template
A timeline displays a chronological order of important dates, and scheduled events. Timelines help product managers, project managers, and team members tell visual stories about progress and obstacles. Timelines enable teams to see at a glance what happened before, what progress is happening now, and what needs tackling in the future. Projects or products with specific purpose or deliverables should be based on a timeline to be successful. Use the timeline as a shared reference for start dates, end dates, and milestones.
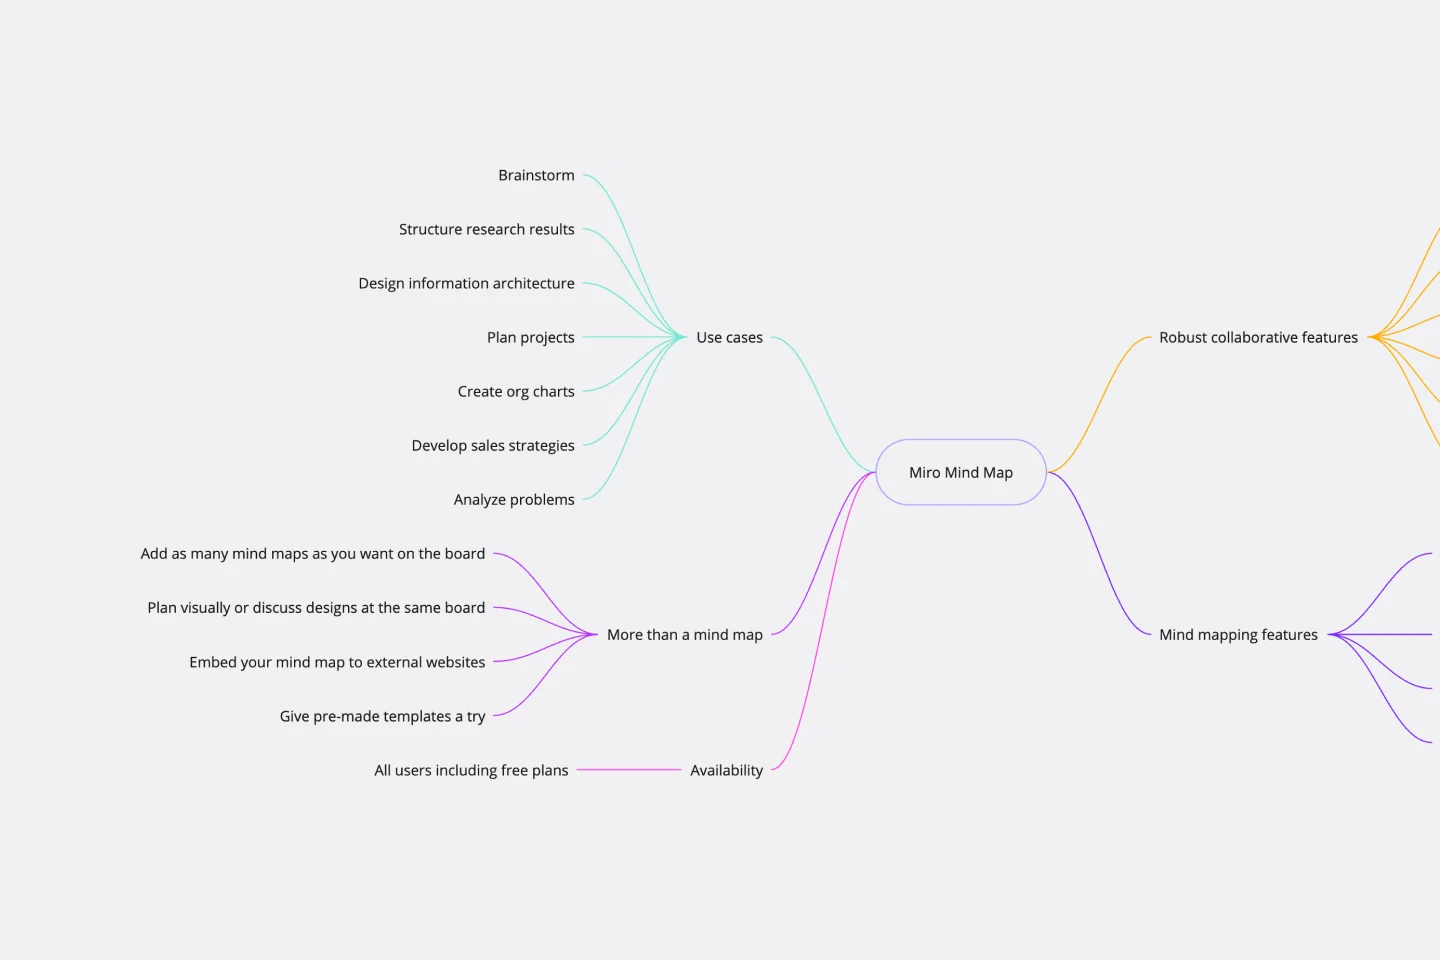
Mind Map Template
We see you, visual learners. You grasp concepts and understand data easier when they're presented in well-organized, memorable graphics. Mind mapping is perfect for you. This powerful brainstorming tool presents concepts or ideas as a tree — with the central subject as the trunk and your many ideas and subtopics as the branches. This template is a fast, effective way for you to start mind mapping, which can help you and your team become more creative, remember more, and solve problems more effectively.
Sticky Note Packs Template
Use Miro’s Stickies Packs template to facilitate your brainstorming and group sessions. Use them to organize your ideas, collaborate as a team, and encourage participation from everyone involved.
Timeline Template
A timeline displays a chronological order of important dates, and scheduled events. Timelines help product managers, project managers, and team members tell visual stories about progress and obstacles. Timelines enable teams to see at a glance what happened before, what progress is happening now, and what needs tackling in the future. Projects or products with specific purpose or deliverables should be based on a timeline to be successful. Use the timeline as a shared reference for start dates, end dates, and milestones.
Mind Map Template
We see you, visual learners. You grasp concepts and understand data easier when they're presented in well-organized, memorable graphics. Mind mapping is perfect for you. This powerful brainstorming tool presents concepts or ideas as a tree — with the central subject as the trunk and your many ideas and subtopics as the branches. This template is a fast, effective way for you to start mind mapping, which can help you and your team become more creative, remember more, and solve problems more effectively.