What is a Likert scale, and how do you use one?
Summary
In this guide, you will learn:
- What a Likert scale is: a rating scale for opinions, attitudes, or behaviors (typically 5 or 7 options, from strong agreement to disagreement)
- Benefits: captures nuanced customer feedback in surveys and research
- How to use: choosing response options and clear anchors
- How to design: ensuring clarity and appropriate length for better response rates
- How to analyze: quantifying responses to measure attitude intensity
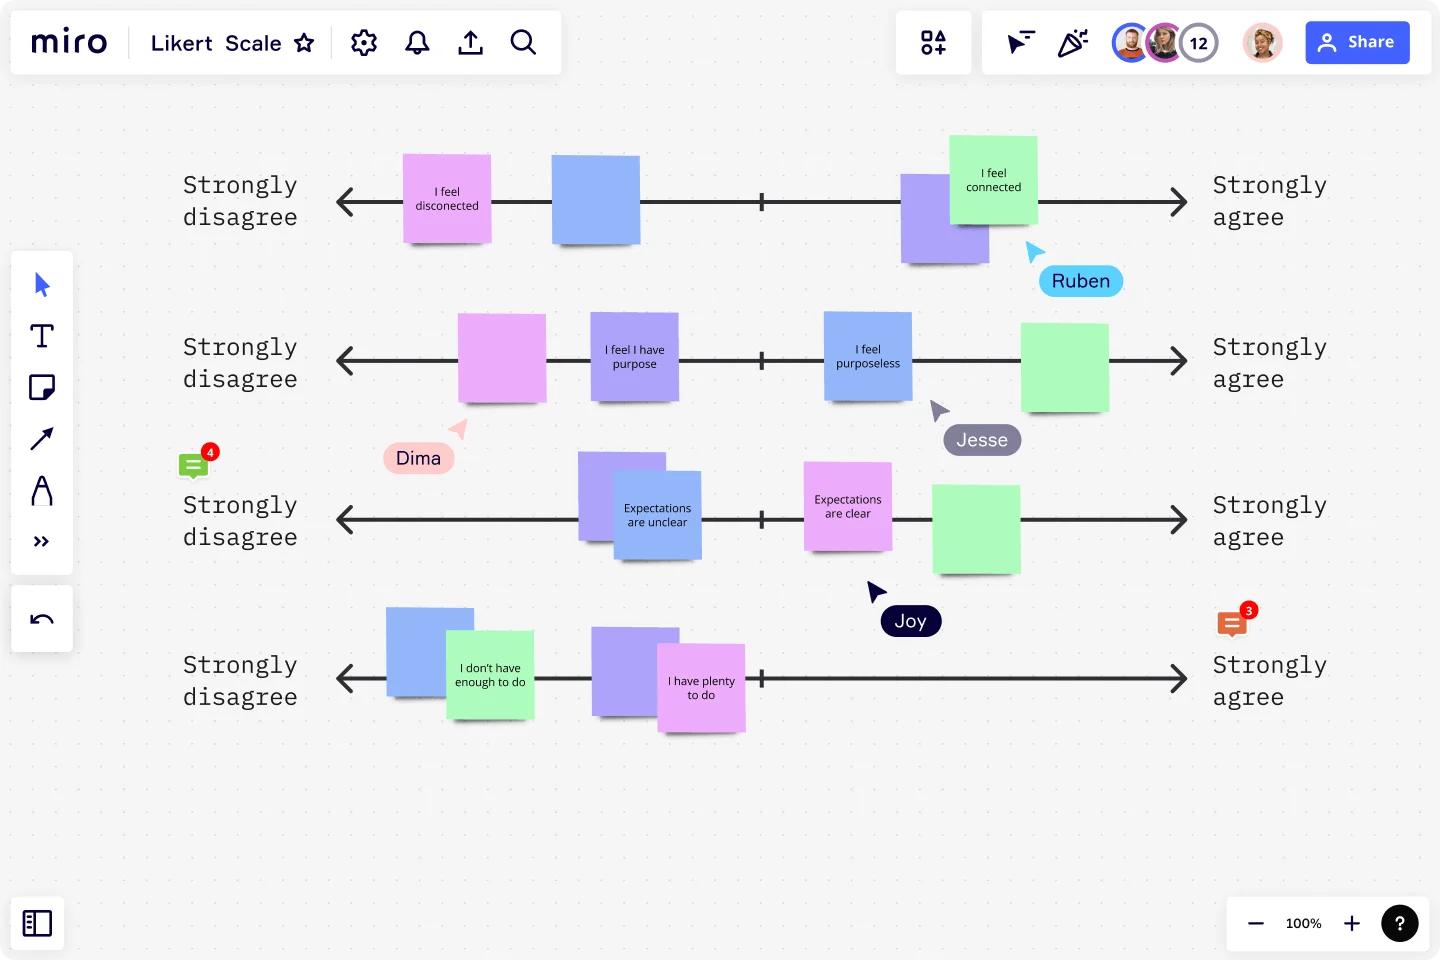
- Miro’s Likert Scale Template: helps create, track, and analyze surveys for customer insights
Collaborative AI Workflows
Join thousands of teams using Miro to build the right thing, faster.
What is a Likert scale?
A Likert scale is a type of psychometric scale commonly used in research that employs questionnaires. It is named after its inventor, Rensis Likert, who developed the scale as a means of measuring attitudes. The data obtained from Likert scales can be used descriptively or analytically, depending on the nature of the research.
The scale asks respondents to rate their levels of agreement or disagreement with a series of statements or questions.
For example, a Likert-type question might be:
"On a scale of 1 to 5, how strongly do you agree with the statement: I enjoy using your product/service?"
A respondent can then select a number between 1 and 5 that reflects their level of agreement with the statement. 1 usually indicates strong disagreement, while 5 indicates strong agreement. The scale typically ranges from 1 to 5 (sometimes 1 to 7), but it can be more or less.
The results of a Likert scale survey measure attitudes, opinions, beliefs, and behaviors. All of this information helps you better understand what your customers want, what you're doing well, and how to make improvements.
What are the benefits of using a Likert scale?
Let’s take a look at some of the benefits of using a Likert scale to gather customer feedback.
Simple to use and administer
Likert scales are easy to design, simple to run, and respondents can answer them quickly. This simplicity makes them an excellent method for quickly collecting customer feedback.
Easy to identify trends
Likert scales produce consistent results over time. This makes it easier for researchers to identify trends in customer feedback. For example, you can easily spot a trend if multiple respondents answer a question with the same response. Then, you can use this information to make informed business decisions.
Measures a variety of key customer areas
Likert scales measure a variety of areas in customer feedback, including attitudes, beliefs, opinions, and behaviors. Using a Likert scale gives you a broad overview of all these areas. It also means they’re a useful tool in different types of work, including marketing, psychology, sociology, and political science.
When to use a Likert scale
Likert scales are widely used to measure attitudes and opinions with a greater degree of nuance than a simple ‘yes/no’ question.
Let’s outline some situations where this is applicable.
To assess customer opinions and attitudes
The Likert scale helps measure people's opinions and attitudes toward a product, service, or idea. For example, you might use a Likert scale to measure customer satisfaction with your product or service. Feedback can also be anonymous, meaning customers may feel more confident providing honest answers.
To evaluate your position in the marketplace
The Likert scale can help you evaluate your position in the marketplace. For example, you can ask customers how they value your product or service in relation to your top competitors. As a result, you can better understand where you sit in the market and how to change your position (if you want to).
To identify key customer trends
The Likert scale identifies trends in people's attitudes and perceptions over time. For example, you can use a Likert scale to measure changes in attitudes toward a product feature. That way, you have a clear idea of what your customers are thinking, what they like about your product, and how you can improve the product to change customer attitudes for the better.
How to use a Likert scale
Now that we know what a Likert scale is, let’s walk through the steps you’ll follow to use a Likert scale of your own.
Determine the research question or objective
Start by identifying the research question or objective that you want to address. For example, do you want to find out what customers think of your new product? Or do you want to understand your brand perception better?
Whatever it is, be clear about this before you start drafting statements and questions for the scale. That way, you can create a Likert scale that answers your question and helps you achieve your objective.
Consider using Miro's Objectives and Key Results (OKRs) Templates to define your objective. With this template, you can clearly map your objectives and provide clarity for the rest of your team.
Develop your statements and questions
Now that you know the purpose behind the scale, you can write statements and questions for customers to rank. Here’s an example
“On a scale of 1 to 7, how strongly do you agree with the following statements:
- Your product meets all my needs.
- I’d recommend your product to family and friends.
- Your product is within my budget.”
The statements will then have a numerical scale next to them from 1 to 7, which will also show respondents what each number means. For example, 1 would be “strongly disagree,” while 7 would be “strongly agree.”
Here are a couple of best practices to think about when writing these statements:
- Be clear and concise. Your questions and statements should be as clear and concise as possible. If they’re not, respondents may misunderstand or misinterpret the information. This can skew your results and impact the decisions you make in the future. To avoid this situation, use simple language and short sentences.
- Relate it back to the purpose. Every question you ask should relate to the reason you're running the survey in the first place. If they don't, it'll be harder for you to achieve the objective. For example, if your goal is to find out how to improve your product's features, but you're asking questions about how much it costs, you probably won't get the information you need.
Outline the response options
After finalizing your statements and questions, it’s time to choose the response options for the Likert scale.
This means outlining how many options respondents will have to agree or disagree with your statements and what the numbers represent. For example, you might use a 5-point Likert scale with “very satisfied” and “very dissatisfied” as the endpoints.
You can change how many options respondents can choose from and what they stand for based on the information you’re looking for. Ultimately, you need to choose a structure that works for you, making it easier to analyze your results.
Administer the Likert scale
The last step is sharing the Likert scale with participants.
Exactly how you do this depends on what type of survey you run and the platform you use. Whether you distribute your survey via email, a social media post, or a banner on your website — make sure it’s clear exactly what the survey is about and how long it’ll take.
Studies show that the ideal survey length is around 10 minutes, so keep this in mind when letting respondents know how long the survey is.
How to analyze Likert scale data
When the survey wraps up, you’ll have some valuable customer data on your hands. Here’s how to work through the information and use your findings to improve your business.
Analyze data at an ordinal level
The first step is to decide whether to analyze the data at an ordinal or interval level. If you opt for an ordinal scale, remember that the distances between categories aren’t technically equal.
For example, let’s say you’re using the following scale:
1 = strongly agree, 2 = agree, 3 = neutral option, 4 = disagree, 5 = strongly disagree
On this scale, you can’t say that 4 is more negative than 1, 2, or 3. However, you can’t say that 4 is twice as negative as 2.
To analyze these scale responses effectively, you can use descriptive statistics.
Descriptive statistics are a way of summarizing data sets — mean, median, and mode are some examples. These descriptors help you understand the commonalities and variabilities of the responses without comparing like-for-like.
Review data at an interval level
If you choose an interval scale, you’re assuming that the distance between categories is equal. This means you can review the data slightly differently by using inferential statistics.
Inferential statistics allow you to make assumptions based on a data set. Examples include chi-square tests, t-tests, and ANOVA (which stands for analysis of variance). These tests help you test a hypothesis to determine whether the differences in responses are a trend or simply down to chance.
For example, the chi-square test compares the expected frequencies of categories with the actual frequencies. It then determines if the association is justified or not.
Visualize trends with graphs and chart
After collecting all your data and choosing which method of data analysis to use, the final step is to interpret the results and draw conclusions. This can involve comparing the results to previous surveys, identifying trends, and using the data to inform your business decisions.
To make it easier to analyze your survey results, consider using graphs and charts to visualize the data. That way, you can spot trends that’ll inform your business decisions.
Think about a bar chart or a histogram as an example. These charts can show the frequency of responses for each category on the scale, making it easier to see commonalities. Then, you can use this information to make smart business decisions.
Use Miro to track and analyze your Likert scale results
The Likert scale is a useful tool for creating simple surveys that help you better understand customer needs, wants, and desires.
If you’re thinking about using the Likert scale in your next survey, use our free Likert Scale Template to get started on the right foot. It'll help you decide what you'd like to measure and what responses the customers can give, and you can run a pre-test with your team to ensure it's clear and effective.
Author: Miro Team
Last update: October 22, 2025