About the Action Priority Matrix Template
An action priority matrix is a grid that enables you to prioritize tasks to best use your time, skills, efforts, and talent.
Members of cross-functional teams rarely have time to finish every request made or project started. Mindfully choosing what to invest time and effort in, you can move forward on high-value tasks and leave behind those that don’t make a noticeable impact or contribution.
What is an action priority matrix?
An action priority matrix helps you prioritize tasks based on their impact and the effort required to complete them.
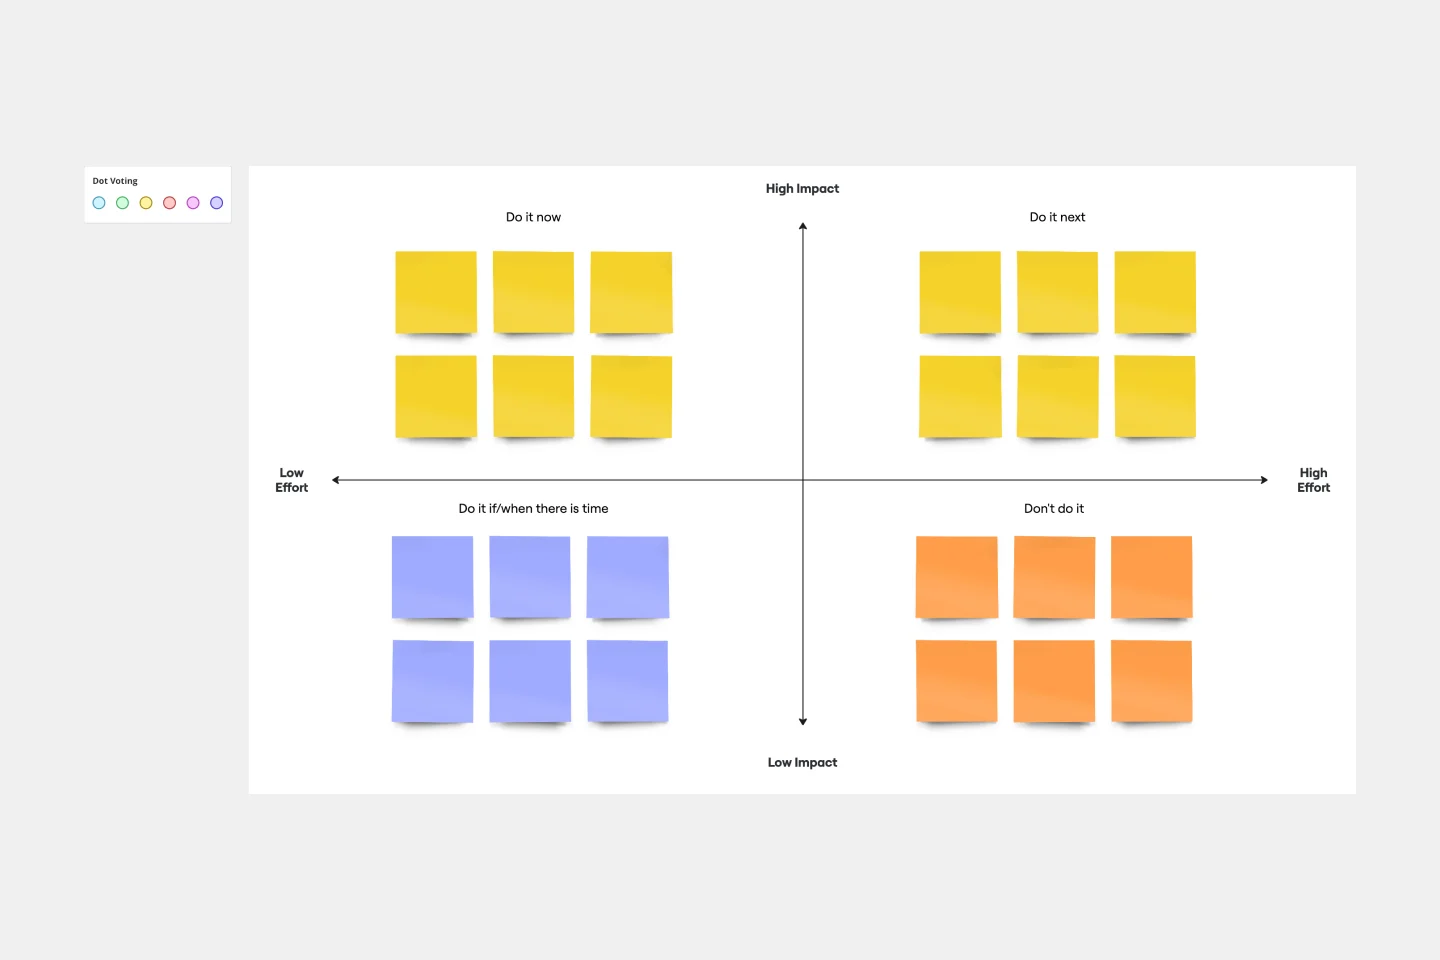
This matrix usually has four quadrants:
Quick wins (high impact, low effort): Focus on these – the projects that give you a broad return on investment of little time or effort.
Major projects (high impact, high effort): Bigger tasks that offer potentially high returns on investment but are more time-consuming (and can overshadow any quick wins).
Fill-ins (low impact, low effort): Delegate these tasks, or focus on them only if you have spare time.
Thankless tasks (low impact, high effort): Best to avoid – time- and energy-consuming tasks that are best ignored to focus instead on quick wins.
You can score each task on the grid from 0 (low impact, high effort) to 10 (maximum impact, maximum effort). This system can help you more precisely plot the grid, and make it easier to determine your priorities.
When to use an action priority matrix
Product teams (and anyone collaborating with product managers) can use the action priority matrix to:
Measure impact (such as sales, profitability, morale, customer perception) against effort (such as time, costs, legal obstacles, organizational complexity)
Help teams or individual contributors move forward by prioritizing a large group of tasks or ideas
Encourage teams or individual contributors to make decisions based on their expertise and experience rather than external factors
Figure out a reasonable impact-to-effort ratio for potential ideas and solutions
As a time management tool, action priority matrixes enable you to visualize how to focus your energy on what will benefit your team and individual contributions.
Create your own action priority matrix
Making your own action priority matrix is easy. Miro is the perfect tool to create and share it. Get started by selecting the Action Priority Matrix Template, then take the following steps to make one of your own.
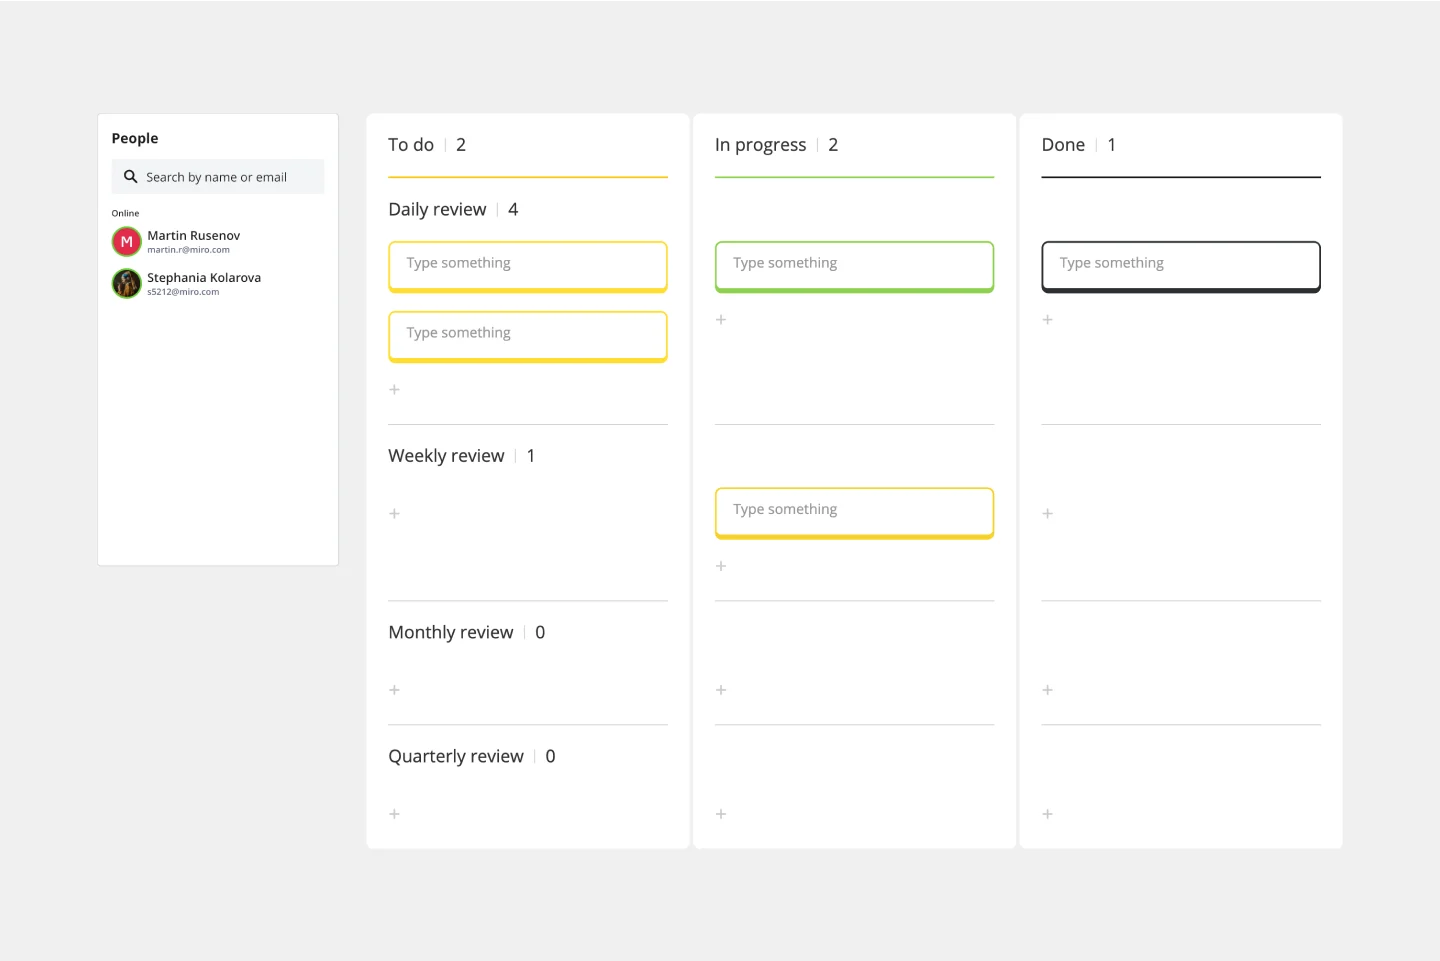
1. Ask your team to generate new ideas or tasks on sticky notes. Team members can use color-coded sticky notes and to record their ideas for high- and low-priority tasks.
2. Pick a group facilitator to sort through the ideas. The facilitator (for instance, a lead or manager) can review each task and reassign it to a relevant quadrant. If multiple ideas sound similar, combine them instead into one succinct sticky note.
3. Ask your colleagues what would help them accomplish each task. Do they need extra time, support, or other resources to bring an idea to life? Get additional input from team members to see if a major project or fill-in task could use a boost to make it easier to complete.
4. Plot the ideas on the chart as a group. As a group, rearrange your sticky note ideas based on feasibility and importance. Keep an eye on what tasks or ideas end up being high- or low-priority. You can also score each task on a scale of 1 to 10, ranging from low effort or importance to maximum effort and importance.
5. Assign tasks to group members accordingly – and follow up to keep the momentum going. You can use to assign relevant tasks by tagging individual team members. You can also use to tag project members or others a specific board or project has been shared with. Revisit the board anytime priorities change, to realign your team.