Phylogenetic Tree Template
Organize complex data and make it more understandable to everyone with the phylogenetic tree template.
Trusted by 65M+ users and leading companies
About the Phylogenetic Tree Template
The phylogenetic tree template is an innovative tool for visualizing the evolutionary relationships between species. It is a visual representation of the history of the evolution of life on Earth, and it helps scientists and researchers to identify the relationships between different organisms and their ancestors. This template is a great way to organize complex data and make it more understandable to everyone.
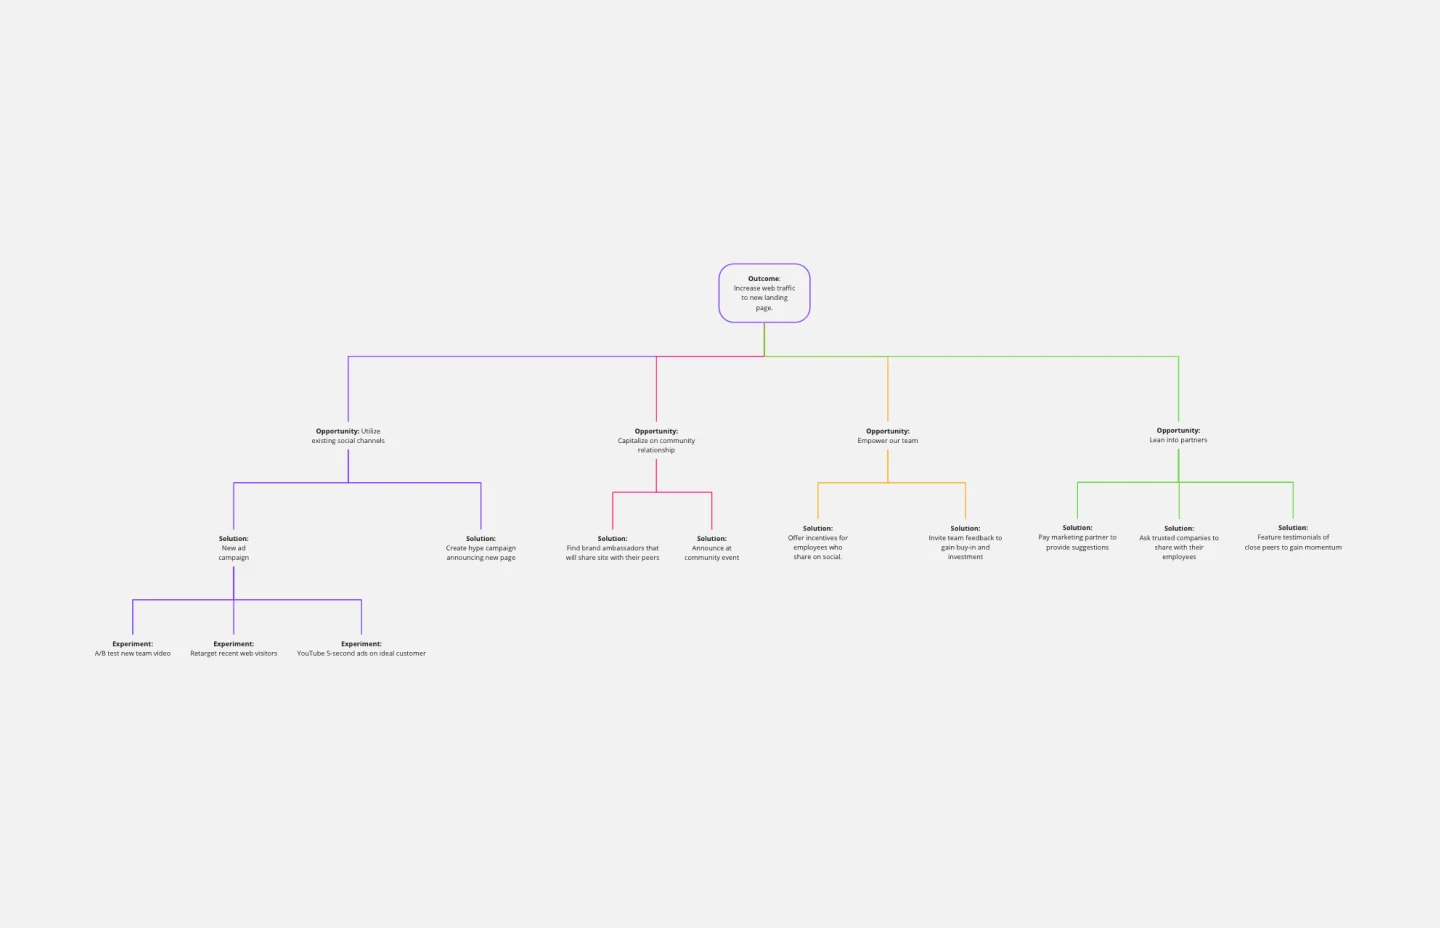
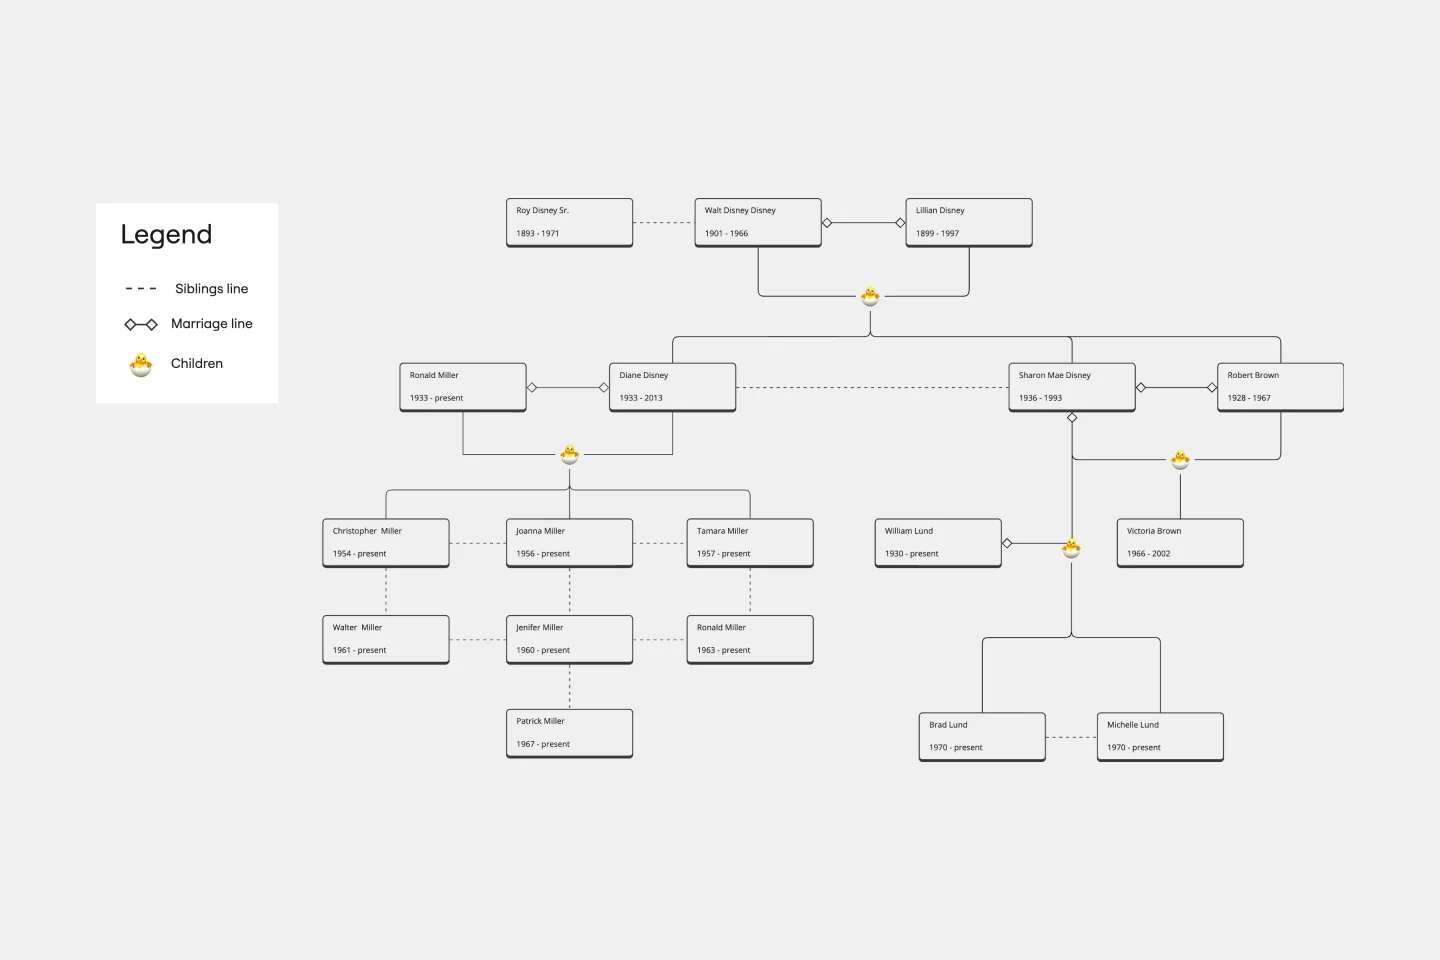
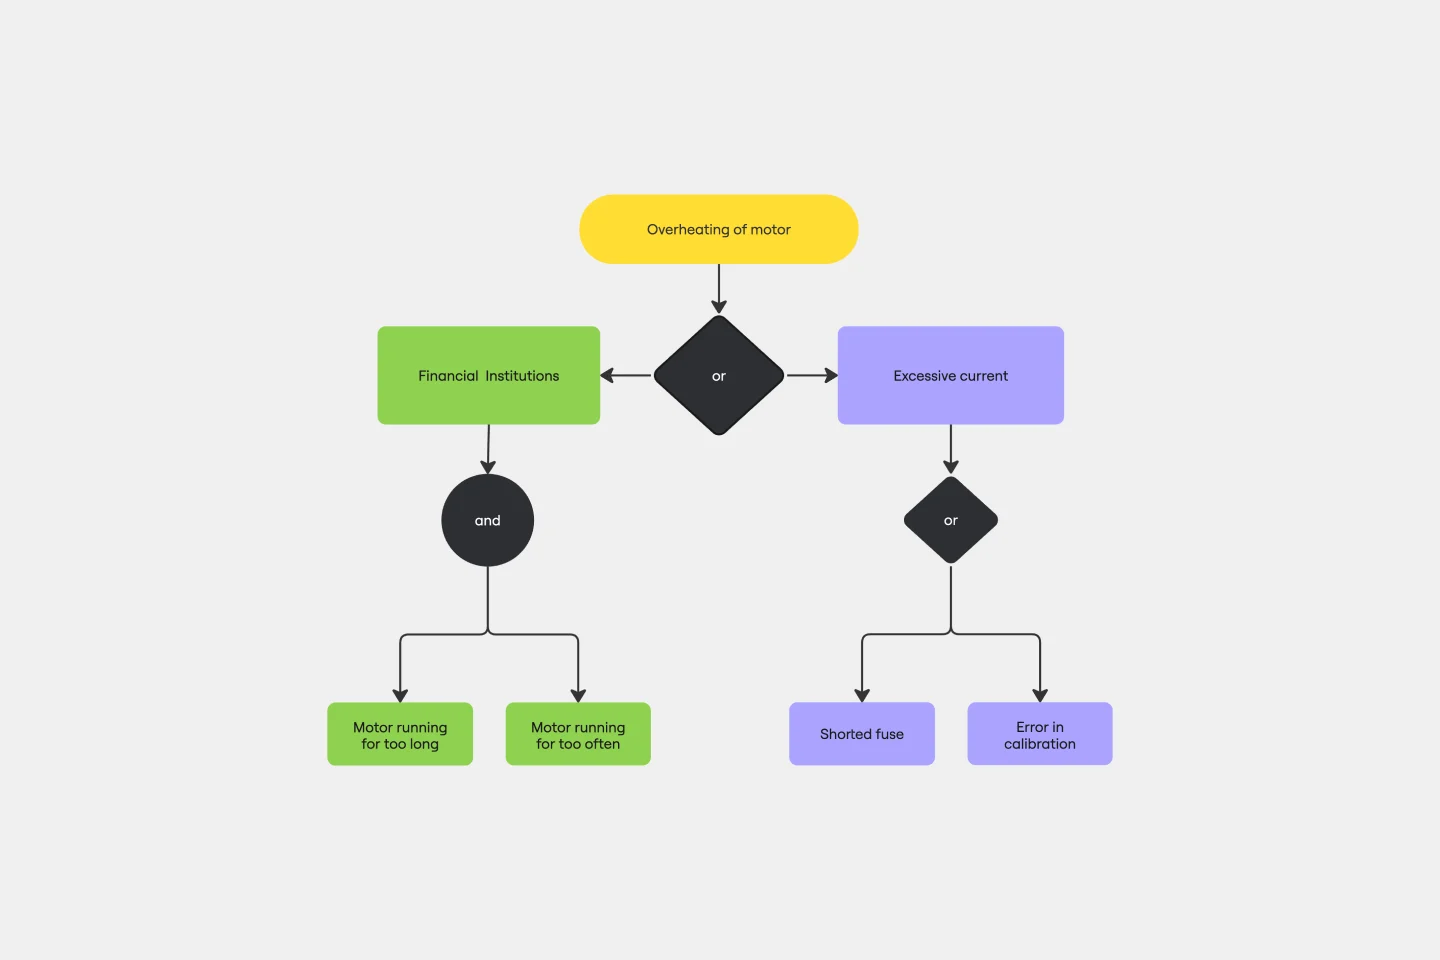
In Miro, the phylogenetic tree template is designed to be simple and easy to use, consisting of different areas representing various aspects of organisms' evolutionary history. These areas include different branches, connector lines, and nodes.
How to use the phylogenetic tree template in Miro
Using the phylogenetic tree template in Miro is very easy. Here are the steps:
Start by adding your data to the template, anything from taxonomic names to DNA sequences.
Use the automated diagramming features to expand the template with more branches and connector lines.
Add any artifact to the Miro board to give more context to your data.
Why should you use the phylogenetic tree?
The phylogenetic tree template offers many benefits to researchers and scientists in biology. Here are some of its key advantages:
Visualizes complex data clearly and concisely, making it easier to comprehend.
It provides an efficient way to organize data and information, enabling easy access and analysis.
It helps identify the relationships between different organisms and their ancestors, leading to important discoveries and insights.
Useful for teaching and learning, providing a visual representation of complex topics and concepts.
Allows for collaboration between researchers and scientists, facilitating the sharing and analysis of data and leading to breakthroughs in the field of biology.
Overall, the phylogenetic tree template is a highly effective tool that has proven invaluable in studying evolutionary biology. Explore all features of Miro's phylogenetic tree maker and start diagramming right now.
Can I personalize the template according to my requirements?
Yes, the template is fully customizable, and you can easily change it with just a few clicks.
Can I expand the template with more branches and connector lines to accommodate my data?
Yes, you can increase the template size with automated diagramming features that allow you to add more branches and connector lines.
Can I add artifacts to the Miro board to provide more context?
Yes, you can add any artifacts to the Miro board to give more context to your data. Simply drag and drop files onto your board.
Get started with this template right now.
Fishbone Diagram Template
Works best for:
Operations, Diagrams, Workflows
What is the best way to solve any problem your team faces? Go straight to the root. That means identifying the root causes of the problem, and fishbone diagrams are designed to help you do it best. Also known as the Ishikawa Diagram (named after Japanese quality control expert Kaoru Ishikawa), fishbone diagrams allow teams to visualize all possible causes of a problem, to explore and understand how they fit together holistically. Teams can also use fishbone diagrams as a starting point for thinking about what the root cause of a future problem might be.
Double Bubble Map Template
Works best for:
Diagramming, Mapping, Brainstorming
Double Bubble Map Template serves as a powerful tool to facilitate teamwork and streamline idea exploration. This adaptable template empowers teams to brainstorm, analyze, and compare concepts with ease, making it an invaluable asset for enhancing creativity and fostering clarity among team members.
Kubernetes Architecture Diagram Template
Works best for:
Software Development, Diagrams
Use the Kubernetes Architecture Diagram template to manage your containerized applications better and bring your apps’ deployment, management, and scalability to the next level. This template helps you lower the downtime in production and allows you to have a more agile app production. Improve the deployment of your apps by visualizing every step of the process with the Kubernetes Architecture template. Try it out, and see if it works for you and your team.
BPMN Template
Works best for:
Mapping, Diagrams, Business Management
The BPMN template helps you track and get an overview of your business processes. It’s a great way to identify any bottlenecks and make your operations more efficient. The BPMN methodology became a universal language when managing business processes, and multiple industries use it as a management tool. Project managers, business analysts, and IT administrators use the BPMN process flow diagram to manage projects, visually communicate the process flows, and keep track of process constraints. Try it for yourself and see improvements in your organization’s agility.
Google Cloud Architecture Diagram Template
Works best for:
Software Development, Diagrams
Use the Google Cloud Architecture Diagram template to clearly visualize the deployment of your application and allow you and your team to optimize processes. The GCP template gives you a great overview of your application architecture, and it helps you to iterate quickly and better manage your application development, deployment, and documentation. Try it out and see if it works for you.
Use Case Diagram Template
Works best for:
Marketing, Market Research, Diagrams
A use case diagram is a visual tool that helps you analyze the relationships between personas and use cases. Use case diagrams typically depict the expected behavior of the system: what will happen and when. A use case diagram is helpful because it allows you to design a system from the perspective of the end user. It’s a valuable tool for communicating your desired system behavior in the language of the user, by specifying all externally visible system behavior.