1 likes
380 uses
Map four overlapping sets with 4-circle Venn diagram templates from Miro. Spot intersections find common ground and analyze data side by side.
8 templates
4-Circle Venn Diagram Template
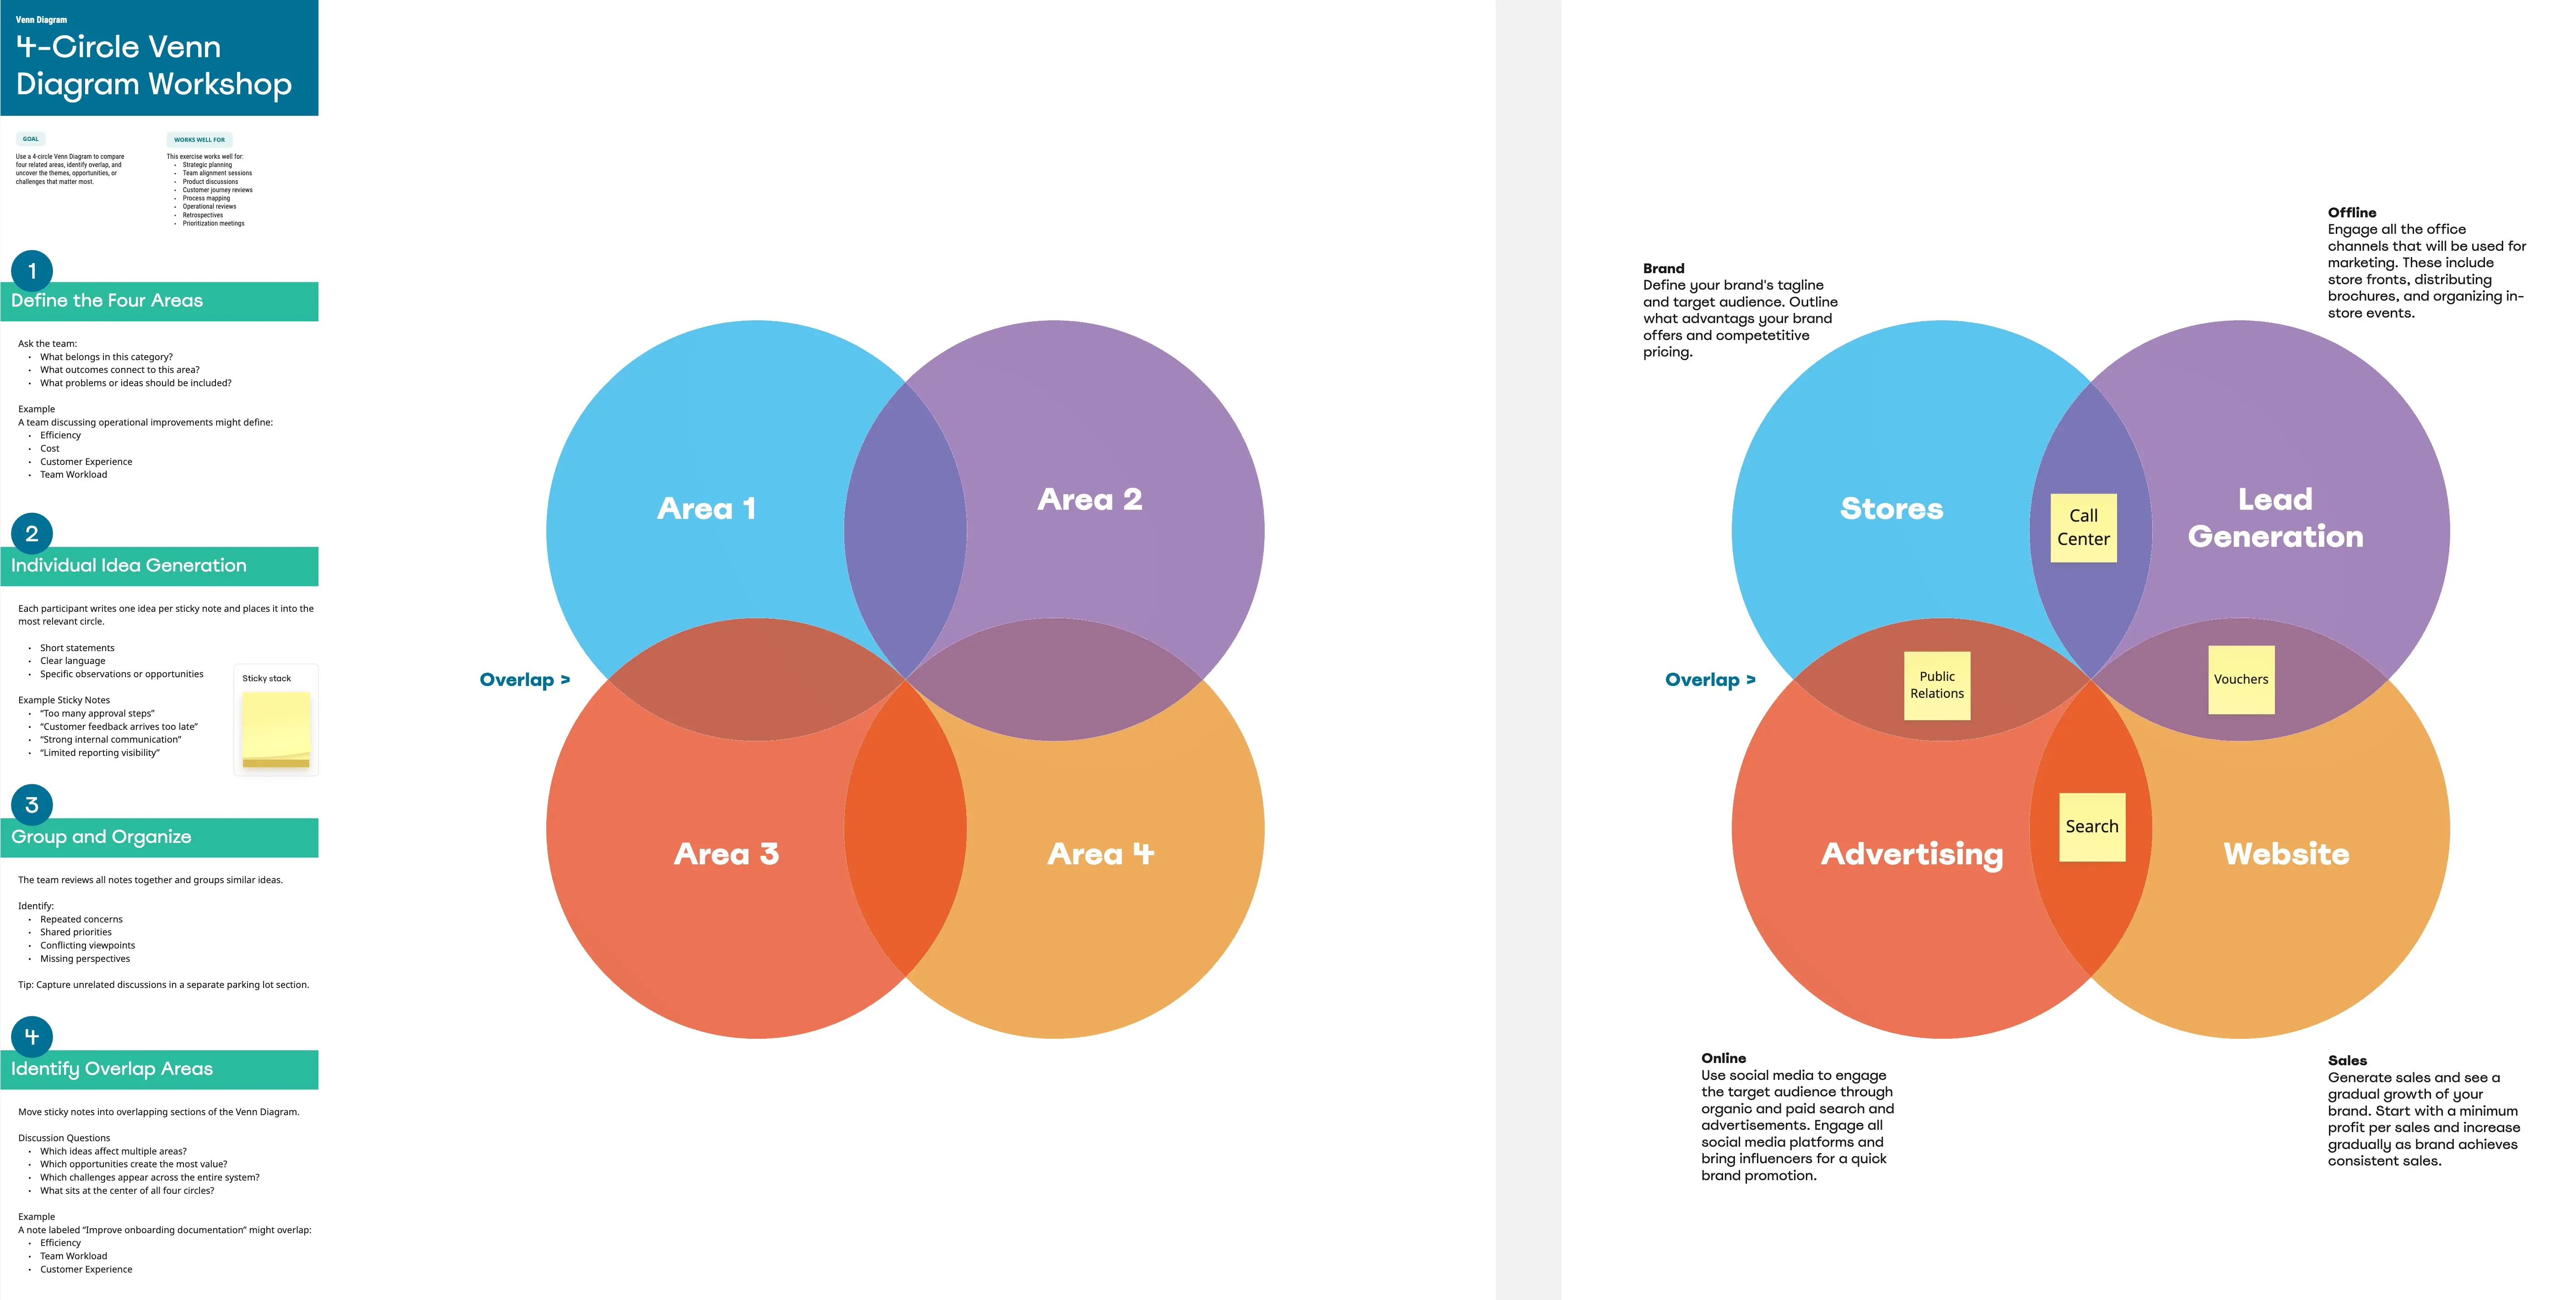
The 4-Circle Venn Diagram Template has an easy, interactive, and dynamic way to visualize complex relationships between data sets. Empower your team's collaboration and communication with this powerful tool.
Four-Circle Venn Diagram
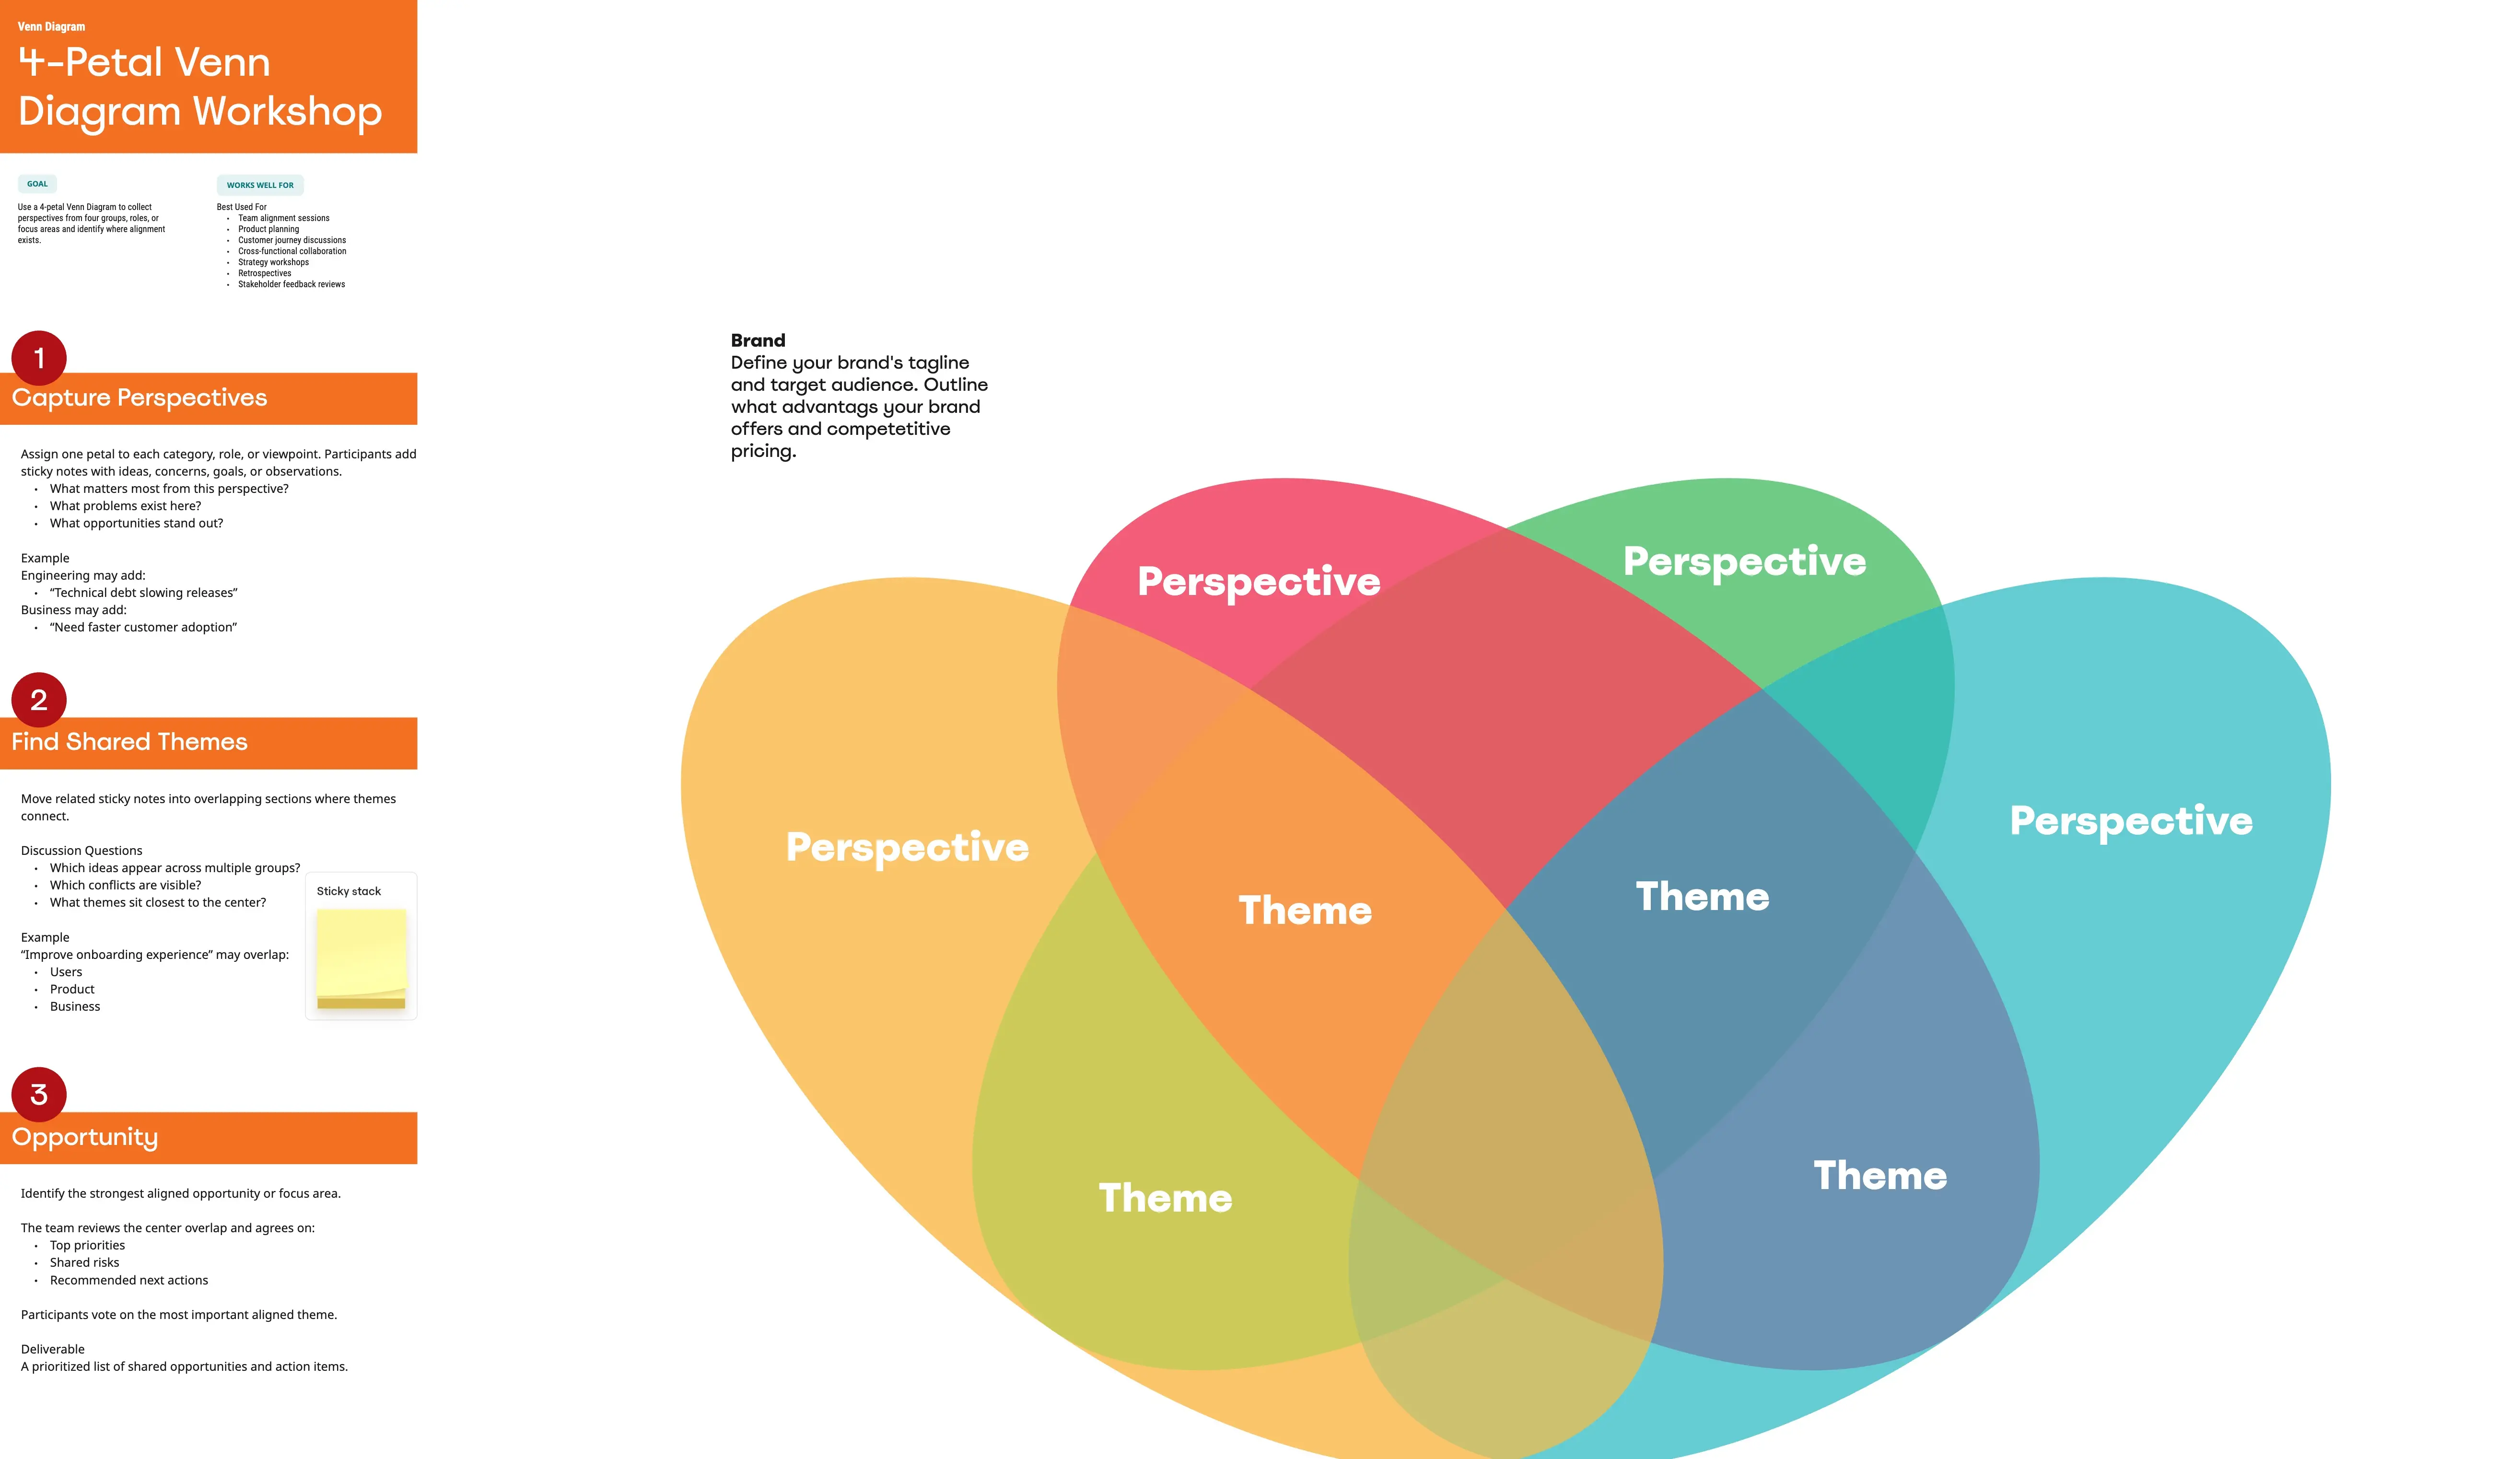
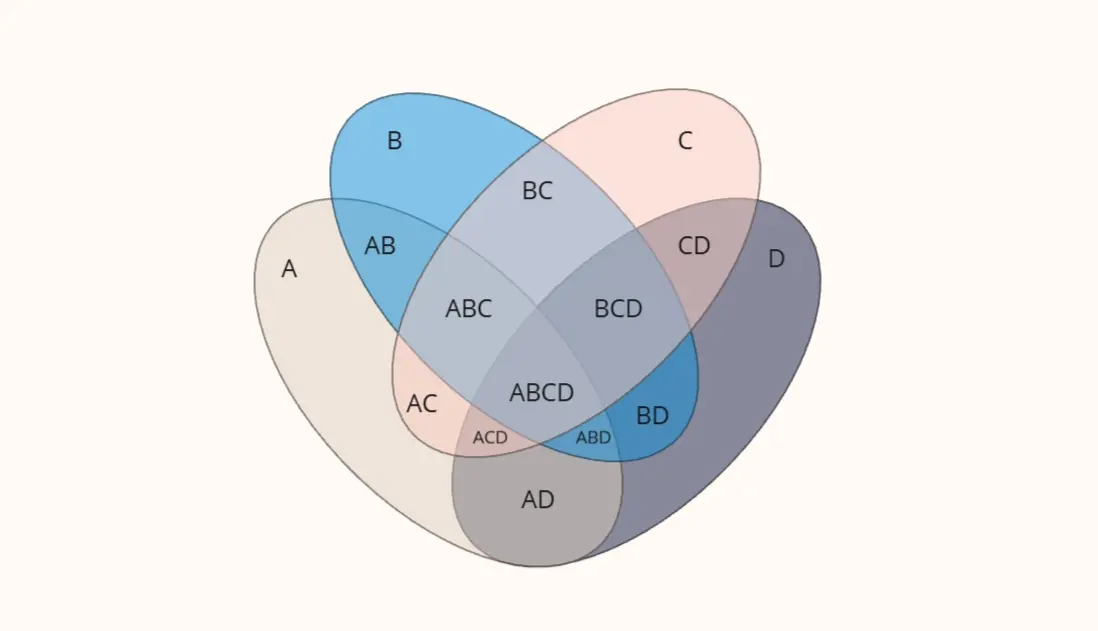
The Four Circle Venn Diagram template offers a robust tool for detailed data comparison involving four sets. Use it to identify common and unique attributes across multiple categories. This template is perfect for complex analysis in research, strategic planning, and education. It helps visualize relationships clearly, making it easier to draw insights and communicate findings. Ideal for professionals and educators needing advanced comparative tools.

Four-Circle Venn Diagram
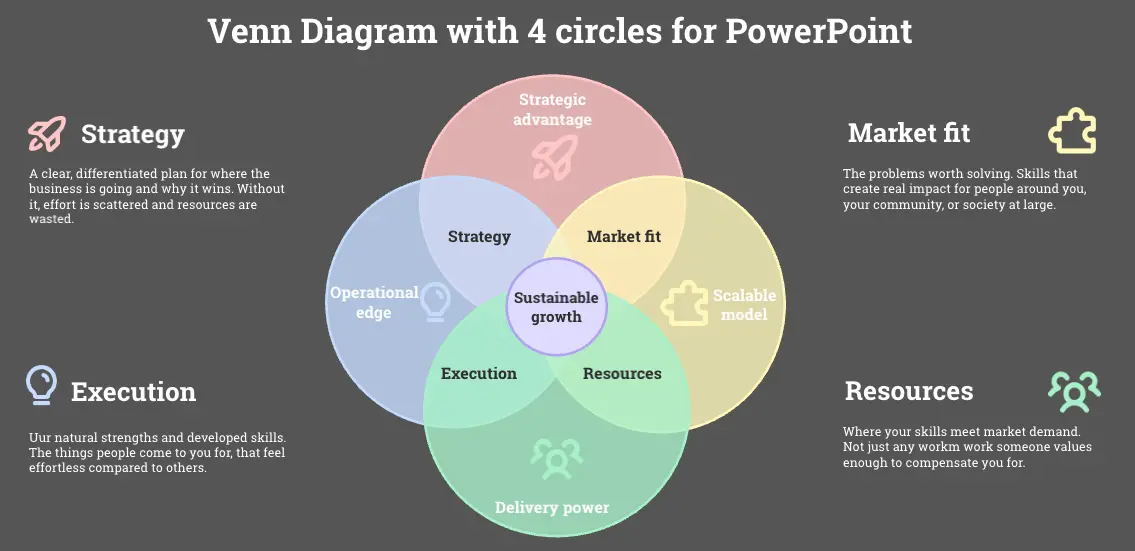
The Four Circle Venn Diagram template is designed for comparing four sets of data. Use this tool to identify commonalities and differences across multiple categories. This template is ideal for complex data analysis, strategic planning, and academic research. It helps you visually organize information, making it easier to understand and communicate insights. Perfect for educators, researchers, and professionals in need of detailed comparison tools.
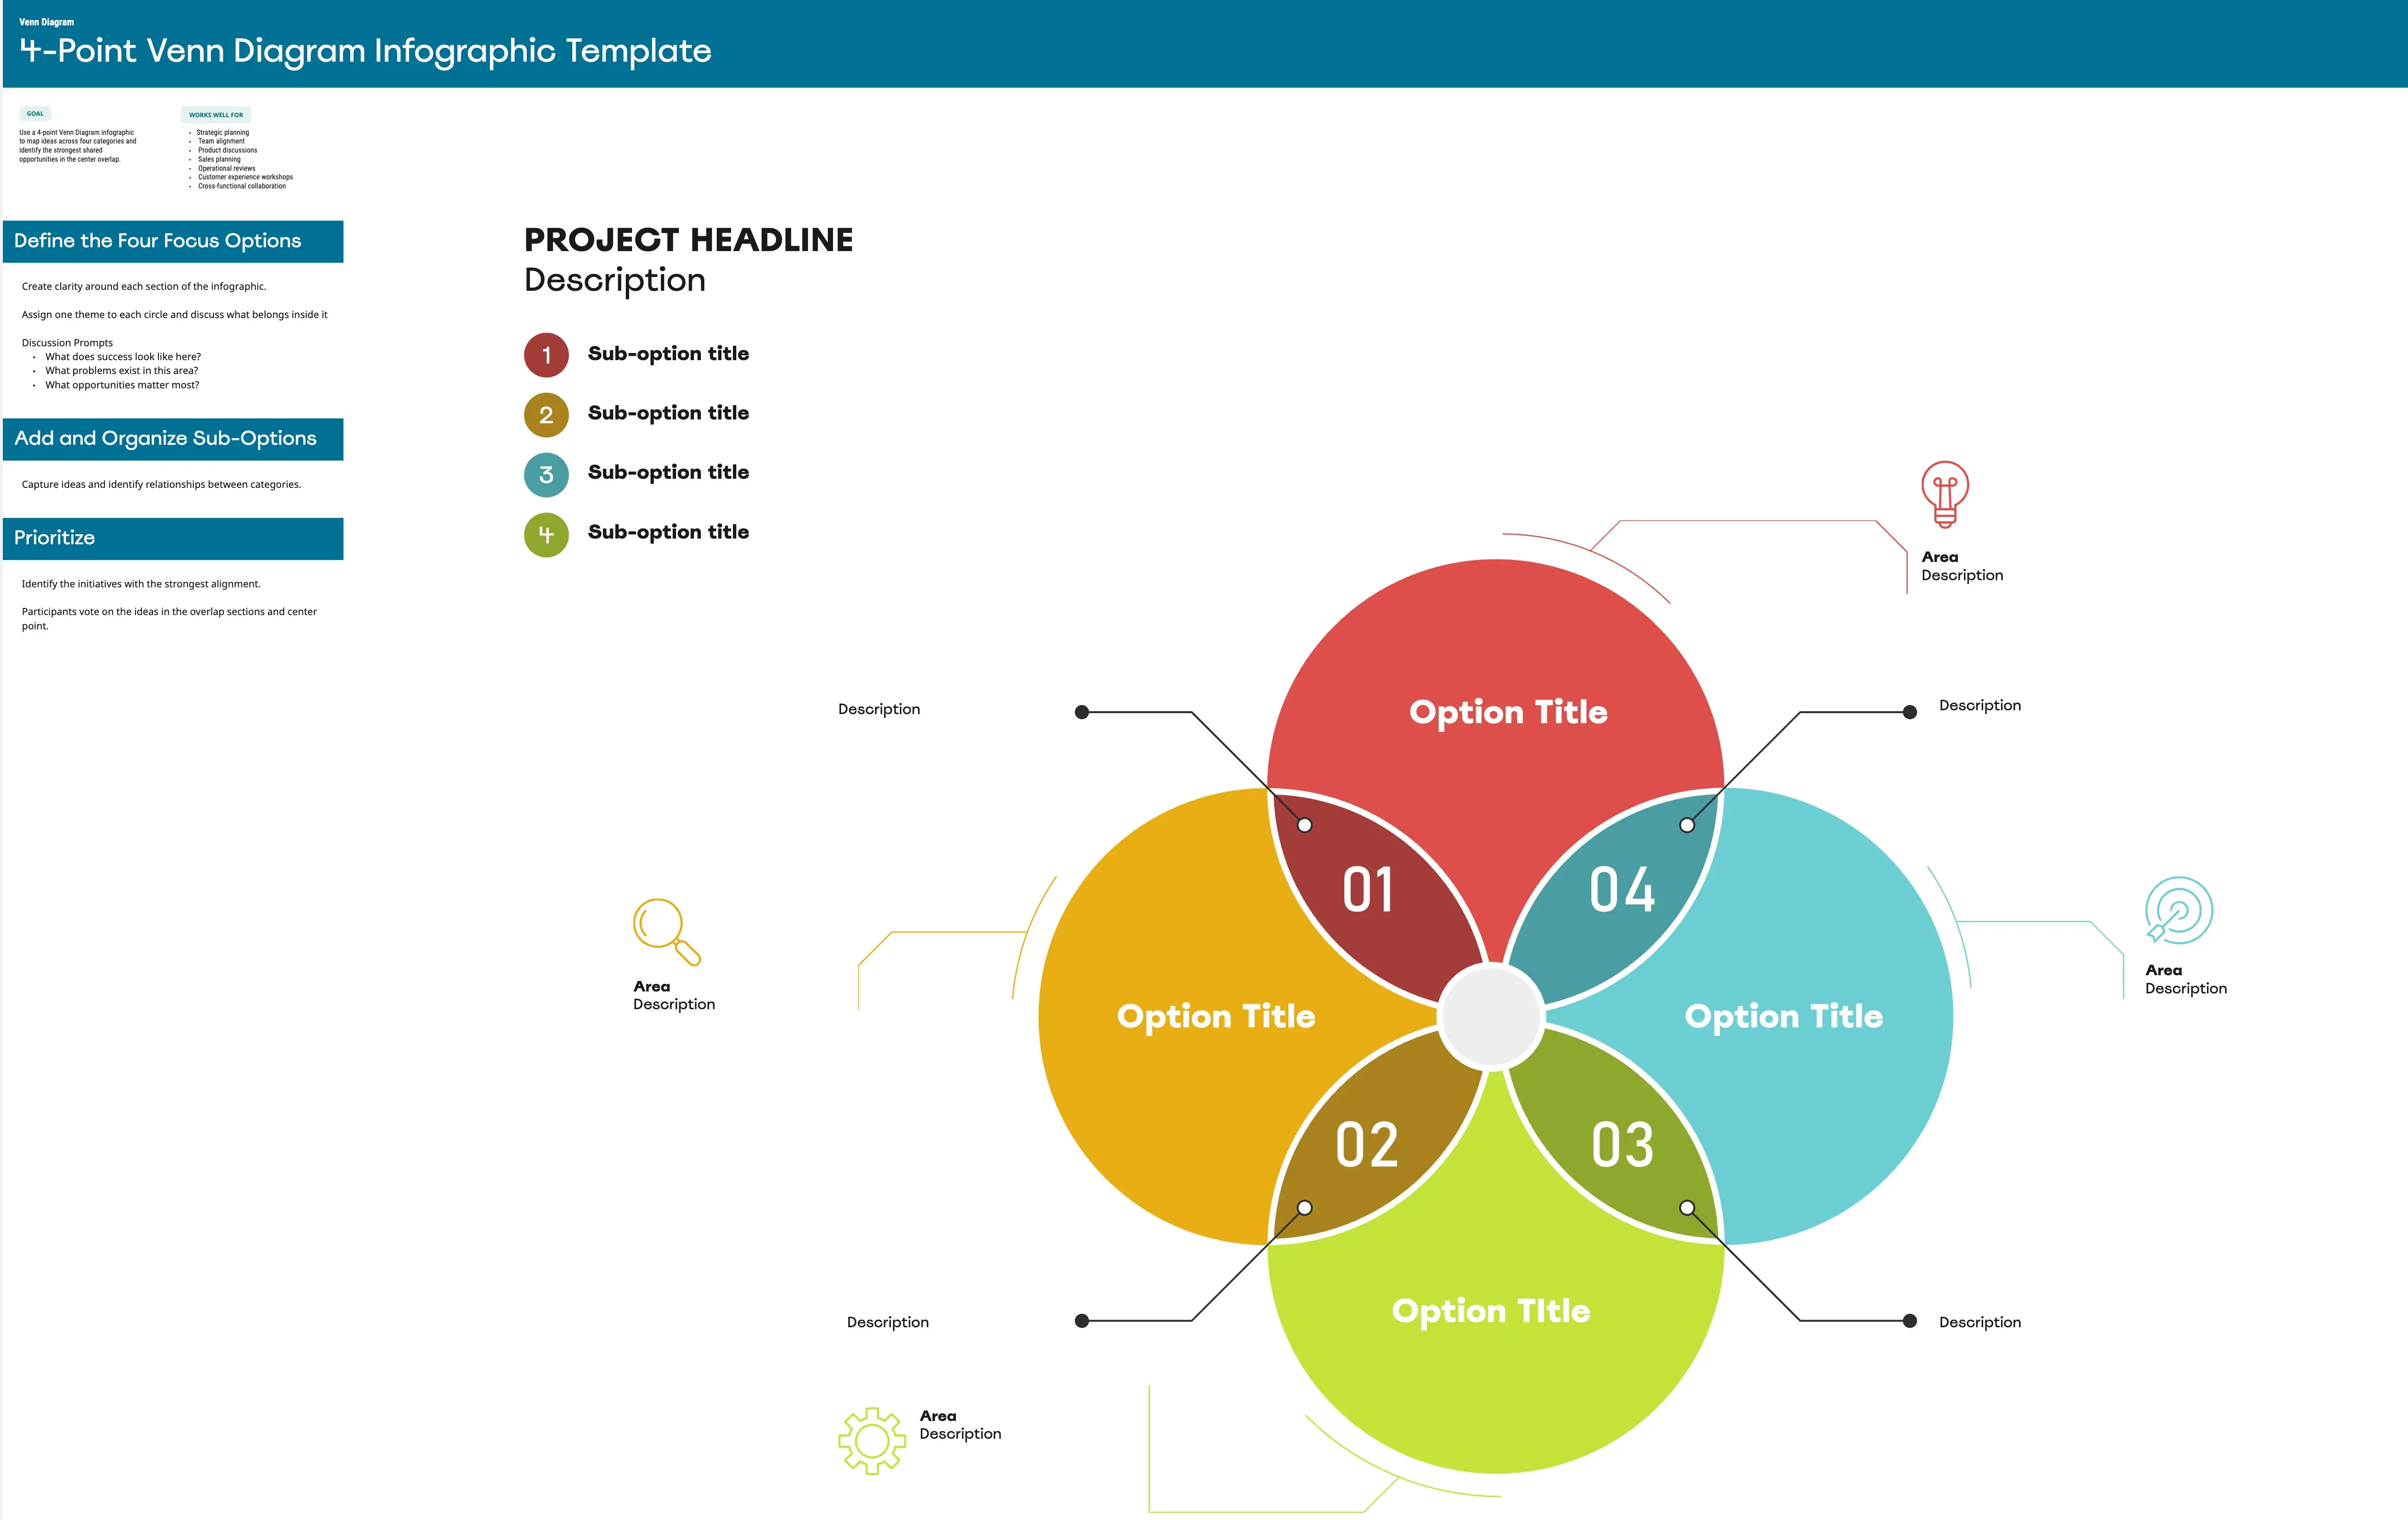
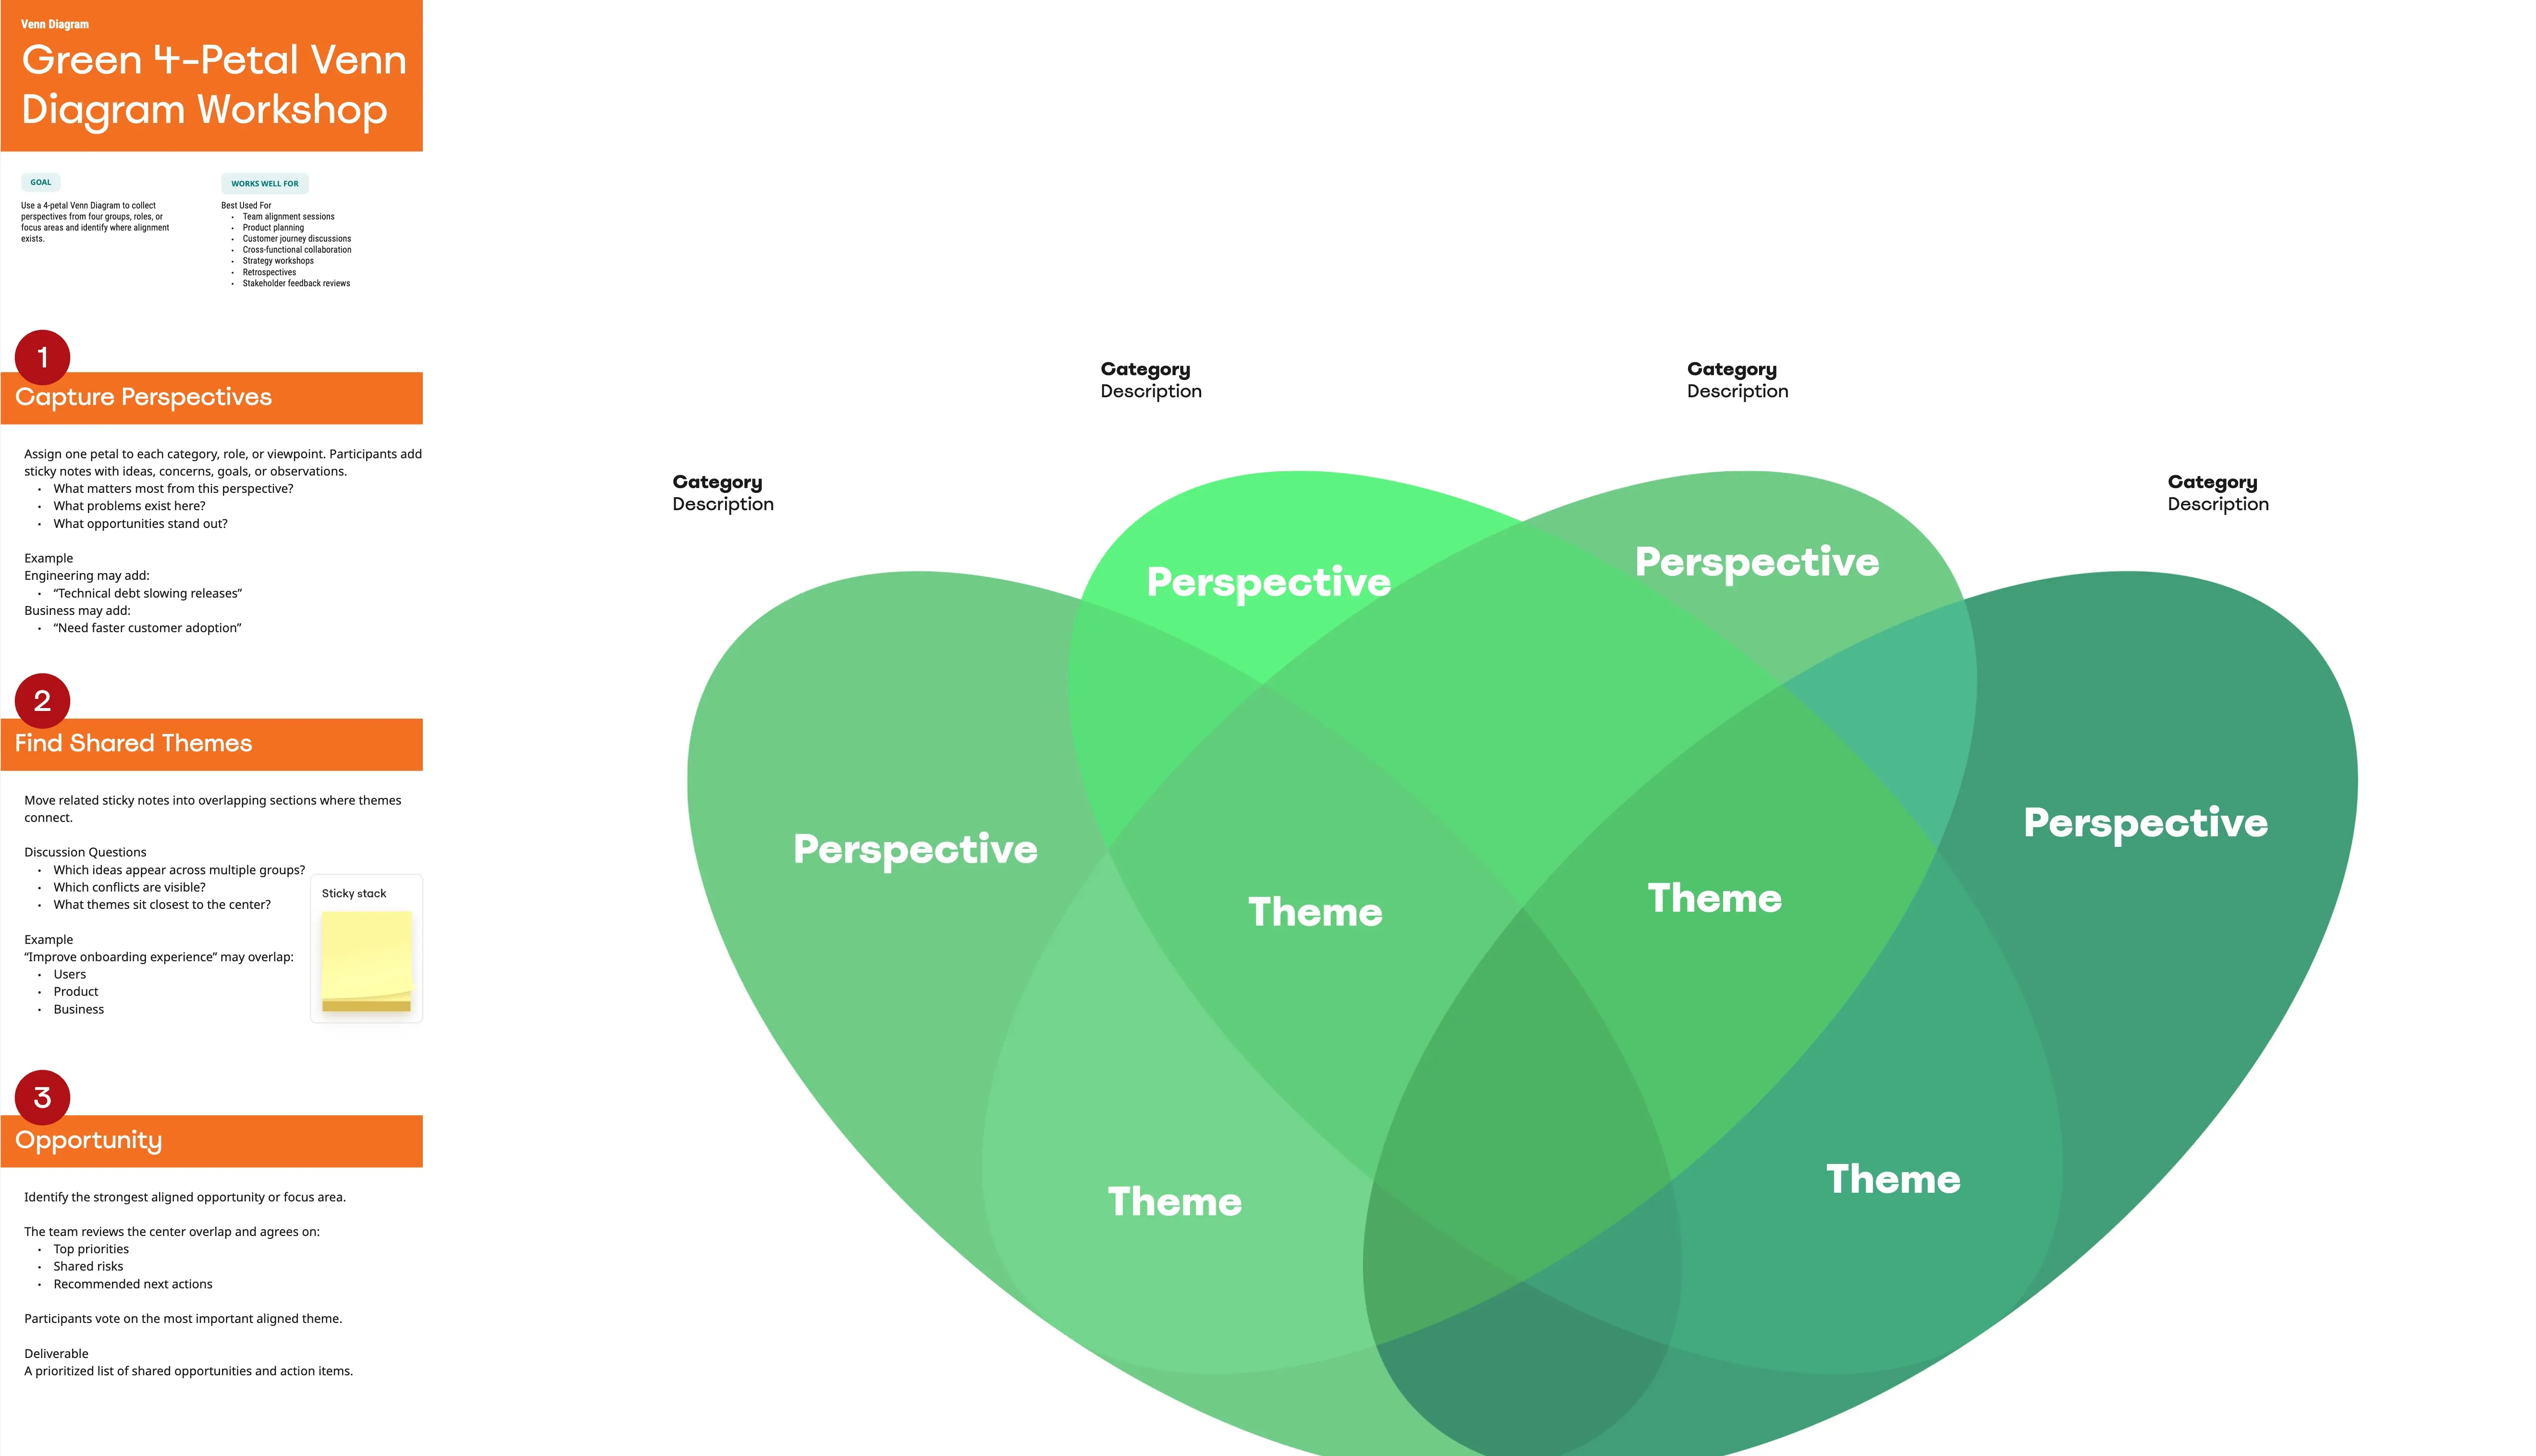
The 4-Circle Venn Diagram Template is a powerful visual tool to help you effectively map out and explore different aspects of your concepts, ideas, or problems. Simplify complex information, create clear intersections, and foster better understanding by creating a 4-Circle Venn diagram. Whether you are brainstorming, analyzing data, or seeking overlaps between multiple elements, our 4-Circle Venn Diagram Template has got you covered.
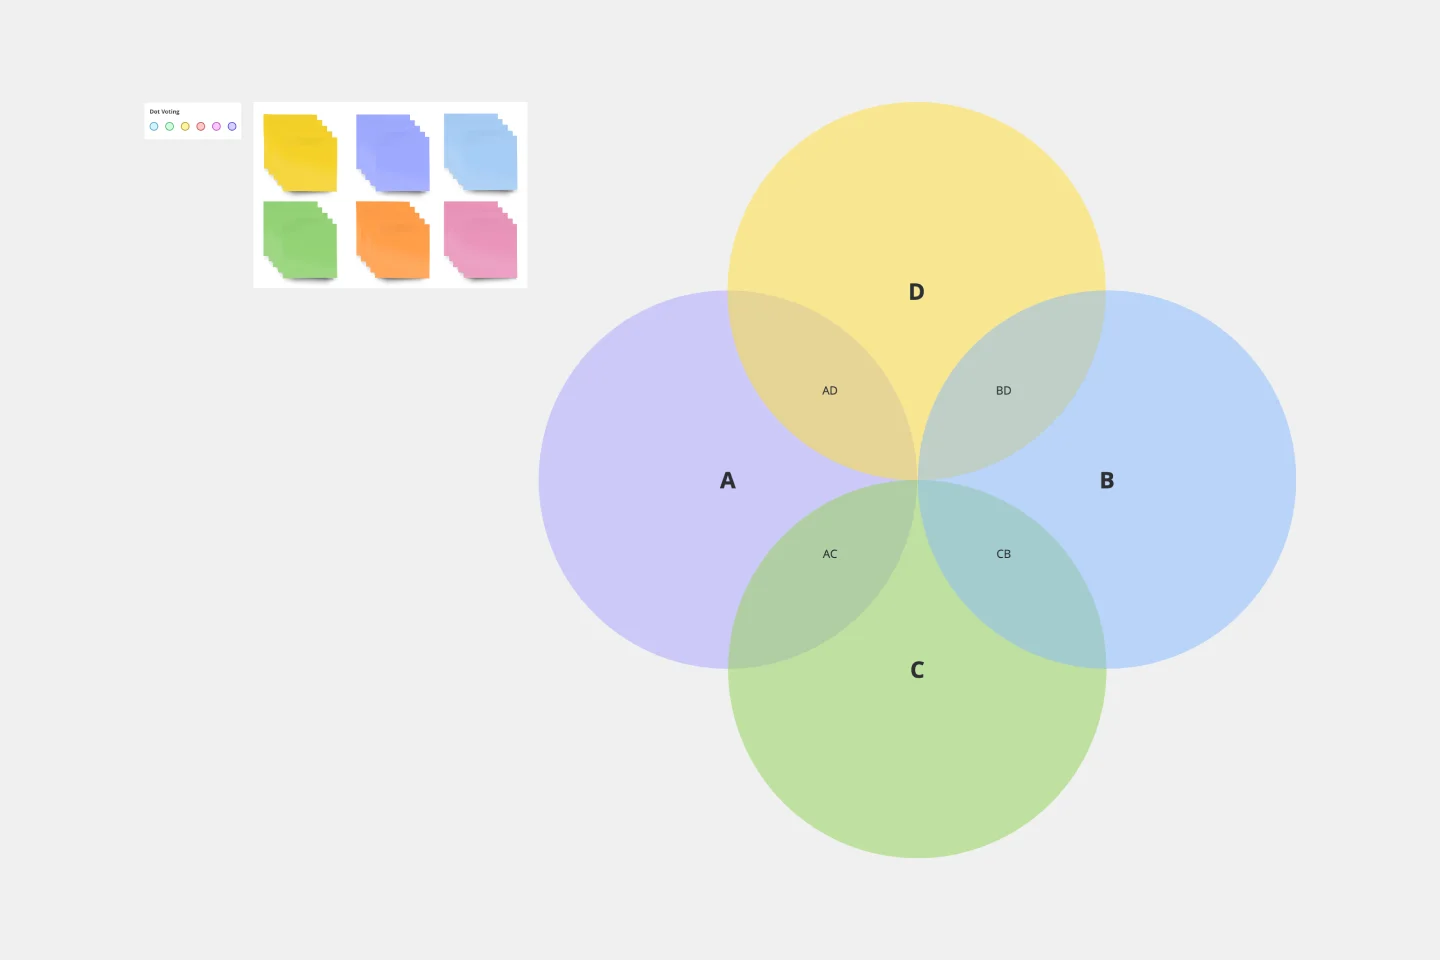
A 4-Circle Venn Diagram Template is a visual representation showcasing the relationships between four different data sets. Each circle in the diagram represents a unique set, and the areas where they intersect signify commonalities. This dynamic tool allows for easy comparison and contrast of information, making it a powerful aid in decision-making processes, problem-solving, data visualization, and more.
Step 1: Select the 4-Circle Venn Diagram Template. It will automatically load on your board.
Step 2: Customize your Venn diagram by clicking on each circle to edit the text. Input your specific sets of data into each circle.
Step 3: To show intersections and commonalities between your data sets, drag and adjust your circles so that they overlap in the necessary areas.
Step 4:Invite team members to collaborate by sharing the board with them. They can join in real-time to add comments, feedback, and ideas directly onto the Venn diagram.
Remember, with Miro, all changes are automatically saved, so you can return and change your diagram anytime. Enjoy creating a visual representation of your data that's both clear and engaging.
Miro is the perfect Venn diagram maker with a range of available templates and the ability to customize everything, from the number of circles to labeling and colors. Create professional Venn diagrams that will help you explain complex topics with confidence.
Can I customize the 4 Circle Venn Diagram Template in Miro?
Absolutely! Miro's templates are fully customizable. You can change your circles' colors, sizes, fonts, and arrangement. This allows for a truly tailored and personalized visualization experience.
Can multiple team members work on the Venn diagram simultaneously?
Yes, Miro's platform supports real-time collaboration. This means multiple team members can work on the Venn diagram simultaneously, making it perfect for brainstorming sessions or collaborative meetings.
Can I save and share my 4 Circle Venn Diagram?
Yes, you can easily save your work on your Miro board. To share it with others, simply use the share button to generate a link, or export your diagram as an image or PDF.
How can I use the 4 Circle Venn Diagram in a presentation?
Miro's 4 Circle Venn Diagram Template can easily be integrated into presentations. Use the frame tool to create a slide with your Venn Diagram, then present directly from Miro or export your frame as an image to insert into a presentation deck.