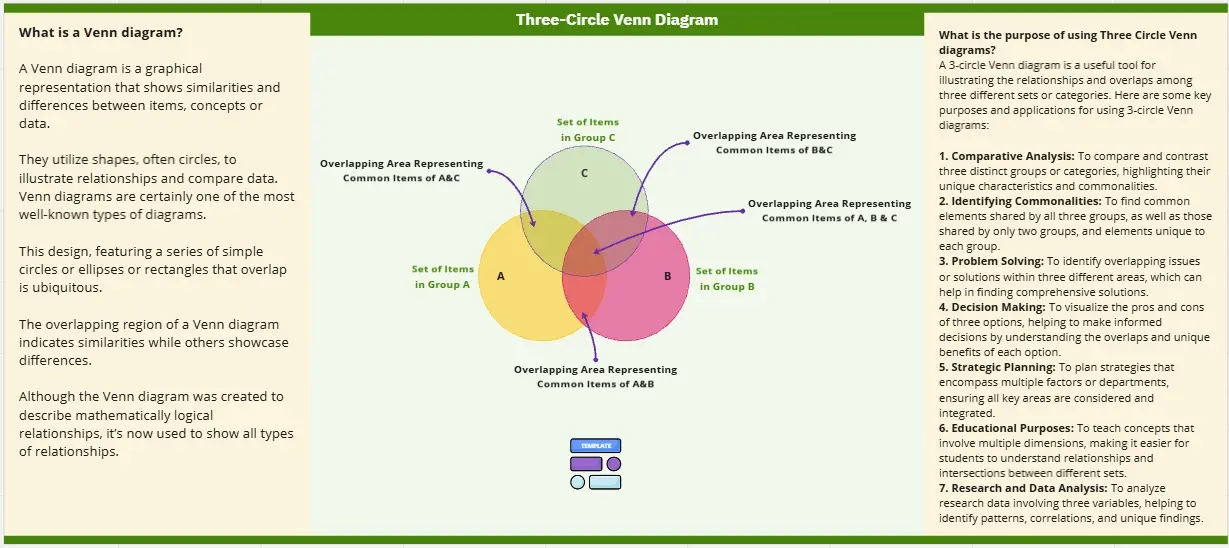
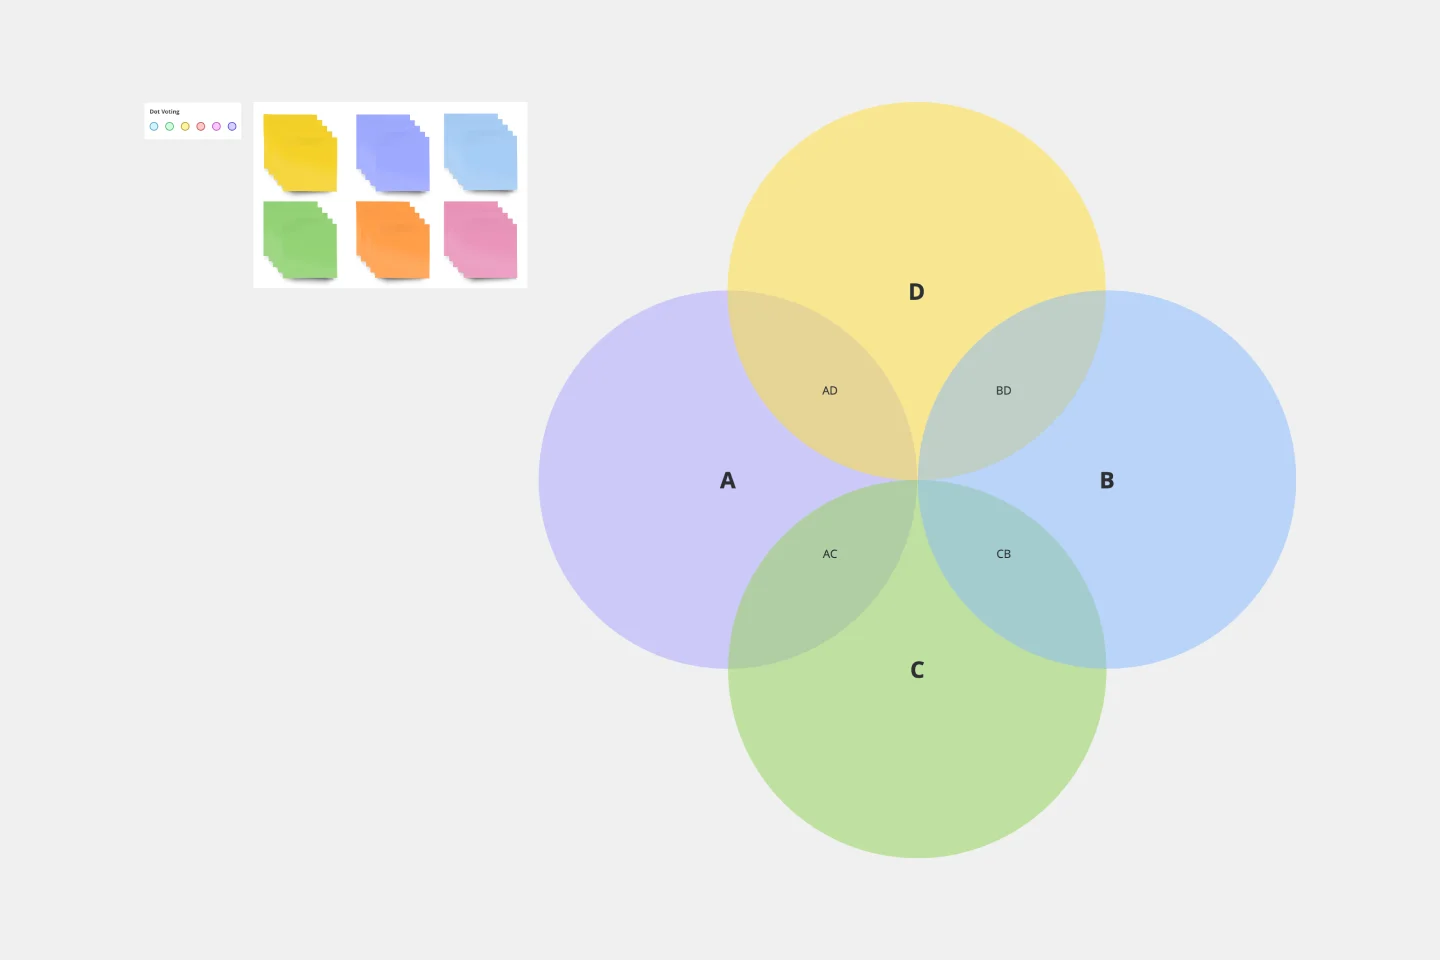
A blue 4-circle Venn diagram is a strategic visualization tool that maps relationships, overlaps and intersections across four distinct concepts, stakeholder groups or business domains. Designed for managers and consultants who need to identify convergence points, this template transforms complex multi-variable analysis into clear visual insights that drive alignment and decision-making.
What Problem Does This Blue 4-Circle Venn Diagram Solve?
Managers and consultants face the challenge of analyzing how multiple factors intersect—whether comparing stakeholder needs, evaluating strategic options or finding common ground across departments. This blue 4-circle Venn diagram template solves that problem by:
Revealing hidden overlaps between customer segments, product features, team capabilities and market opportunities
Identifying sweet spots where four variables align for maximum impact
Simplifying stakeholder presentations with clean, professional blue styling
Accelerating workshop discussions by giving teams a shared visual language
How to Use the Blue 4-Circle Venn Diagram Template
Label each circle with your four key concepts (markets, personas, priorities, capabilities)
Add items to individual circles representing unique attributes
Drag overlapping elements into intersection zones
Highlight the central overlap—your strategic "sweet spot"
Use the blue color scheme to maintain visual consistency in client deliverables
Blue 4-Circle Venn Diagram FAQs
When should consultants use a 4-circle Venn diagram? Use this template for stakeholder mapping, competitive positioning, capability assessments or any analysis requiring four-way comparison.
Can I customize the blue 4-circle Venn diagram? Yes—adjust circle sizes, modify the blue palette or add annotations to match your brand guidelines.