Simple PERT Chart Template
Brief
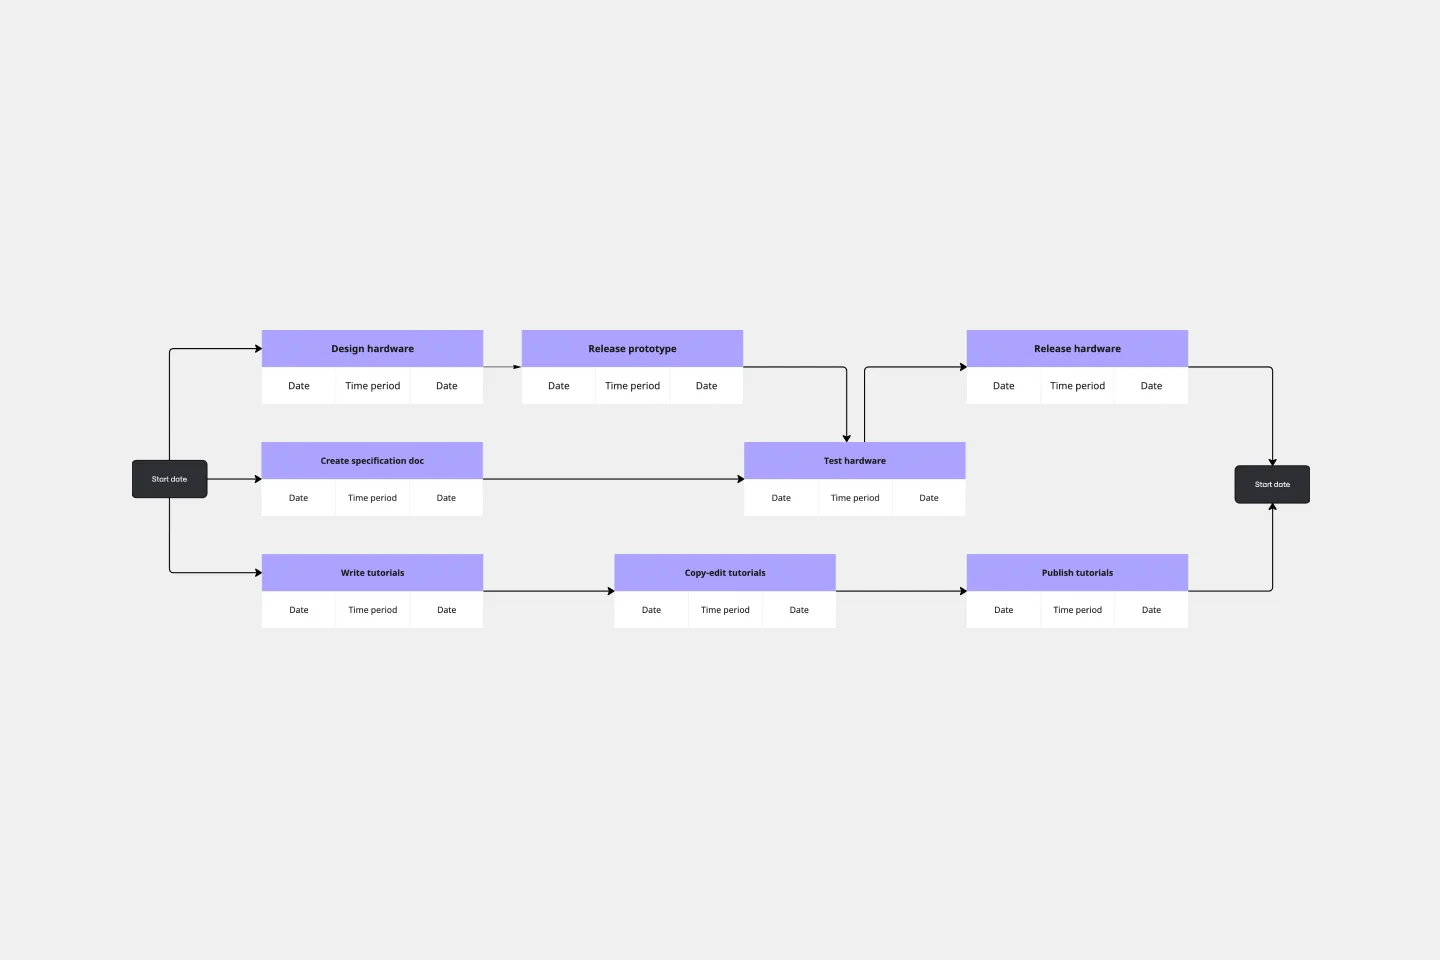
A PERT (Program Evaluation and Review Technique) Chart is a visual project management tool that maps out tasks, milestones, and dependencies in a network diagram format. This template provides a pre-structured framework with 8 numbered event nodes connected by arrows representing task flows and time durations, helping you plan complex projects and identify the critical path to completion.
Who Can Use It
Project Managers managing multi-phase initiatives with interdependent tasks
Team Leads coordinating cross-functional workflows and deliverables
Operations Managers planning process improvements or operational rollouts
Event Planners organizing complex events with multiple preparation stages
Product Managers scheduling product development and launch activities
Construction Managers sequencing building phases and resource allocation
Filling Instructions
Step 1: Define Your Milestones
Replace the numbered circles (1-8) with your actual project milestones or key events. Node 1 is your project start point, and Node 8 is your completion milestone.
Step 2: Update Task Durations
Edit the duration labels on each connecting line to reflect your estimated timeframes. Replace placeholder values (currently "2 days", "3 days", etc.) with your actual time estimates.
Step 3: Map Dependencies
Review the arrows connecting your nodes. Each arrow represents a task that must be completed to move from one milestone to the next. Adjust connections to match your project's actual dependencies.
Step 4: Add or Remove Elements
Modify the chart structure as needed by:
Adding more nodes for additional milestones
Creating new connections for additional task dependencies
Removing unnecessary paths that don't apply to your project
Step 5: Identify Parallel vs. Sequential Tasks
Look for parallel paths (tasks that can occur simultaneously) and sequential paths (tasks that must occur in order). Adjust your layout to clearly show these relationships.
Step 6: Calculate Critical Path
Once complete, trace the longest path from start to finish. This critical path determines your minimum project duration and highlights tasks that cannot be delayed without impacting the overall timeline.
Step 7: Review and Iterate
Share with stakeholders, validate assumptions, and refine durations and dependencies based on team input and resource constraints.
Cheers!
Khawaja Rizwan