PERT Diagram Template
Track project timelines, tasks, and dependencies at a single glance using a PERT diagram template.
Trusted by 65M+ users and leading companies
About the PERT Diagram Template
A PERT diagram allows you to create a visual roadmap of a project. It lets you see the interdependencies within your project tasks, and it can help you identify possible bottlenecks.
Read on to learn more about PERT diagrams and see how you can create your own using our PERT diagram template.
What is a PERT diagram?
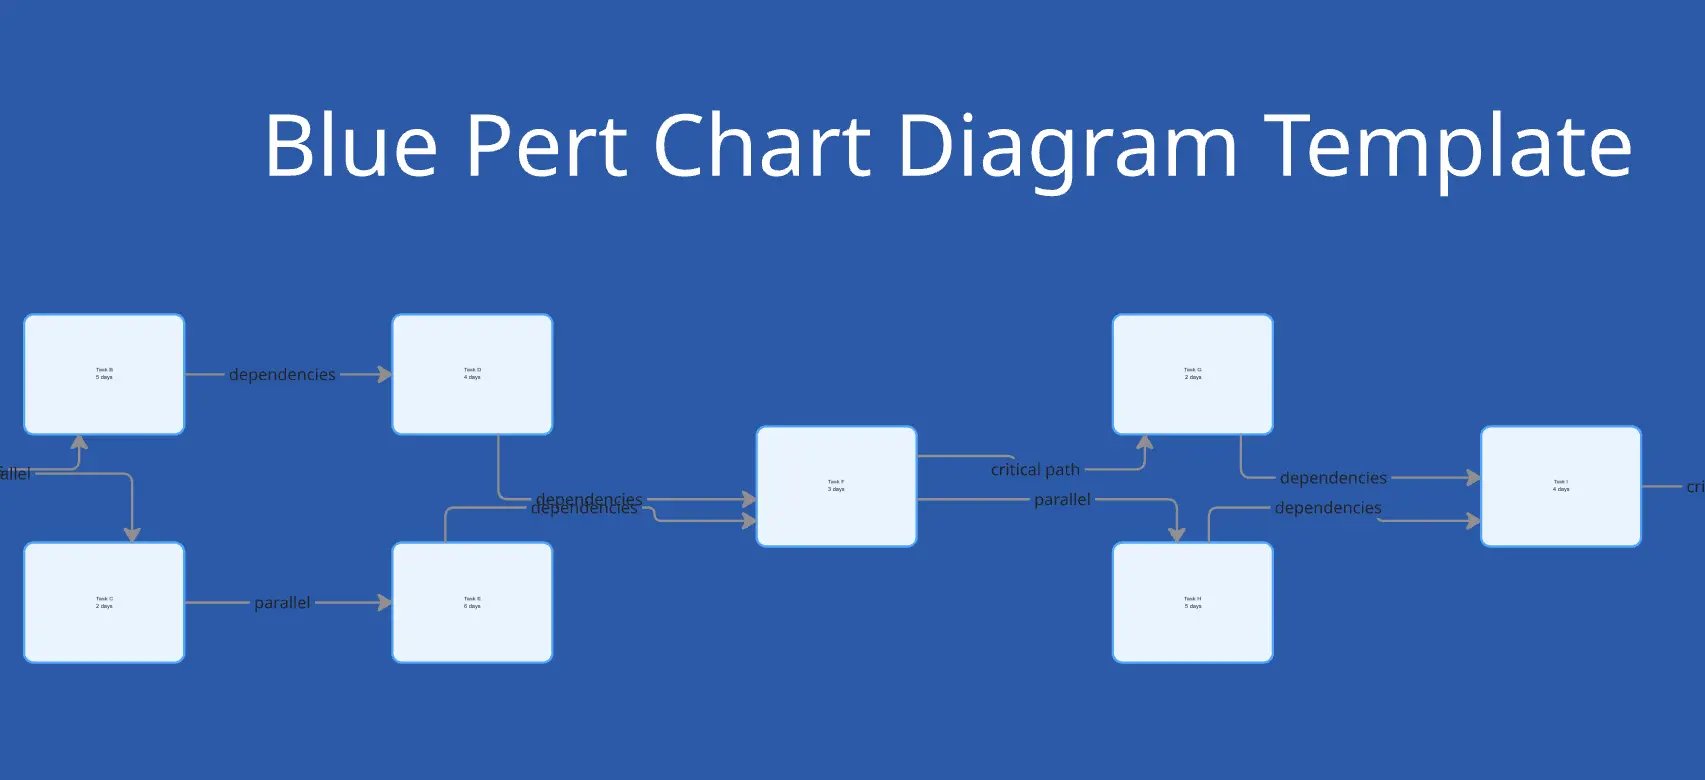
A Program Evaluation and Review Technique (PERT) diagram or chart is a project management tool used to represent a project schedule visually. It’s a network diagram that lays out the entire project timeline, including tasks and milestones.
PERT helps you predict the time required to complete a project, assign tasks to employees, and find a critical path.
In project management, a critical path is the longest sequence of essential tasks required to complete a project. PERT uses variable task durations, making it a more nuanced approach than the standard critical path method.
How to use the PERT diagram template
A PERT diagram is easy to create and share using Miro's visual workspace. After you select the PERT diagram template, follow these steps:
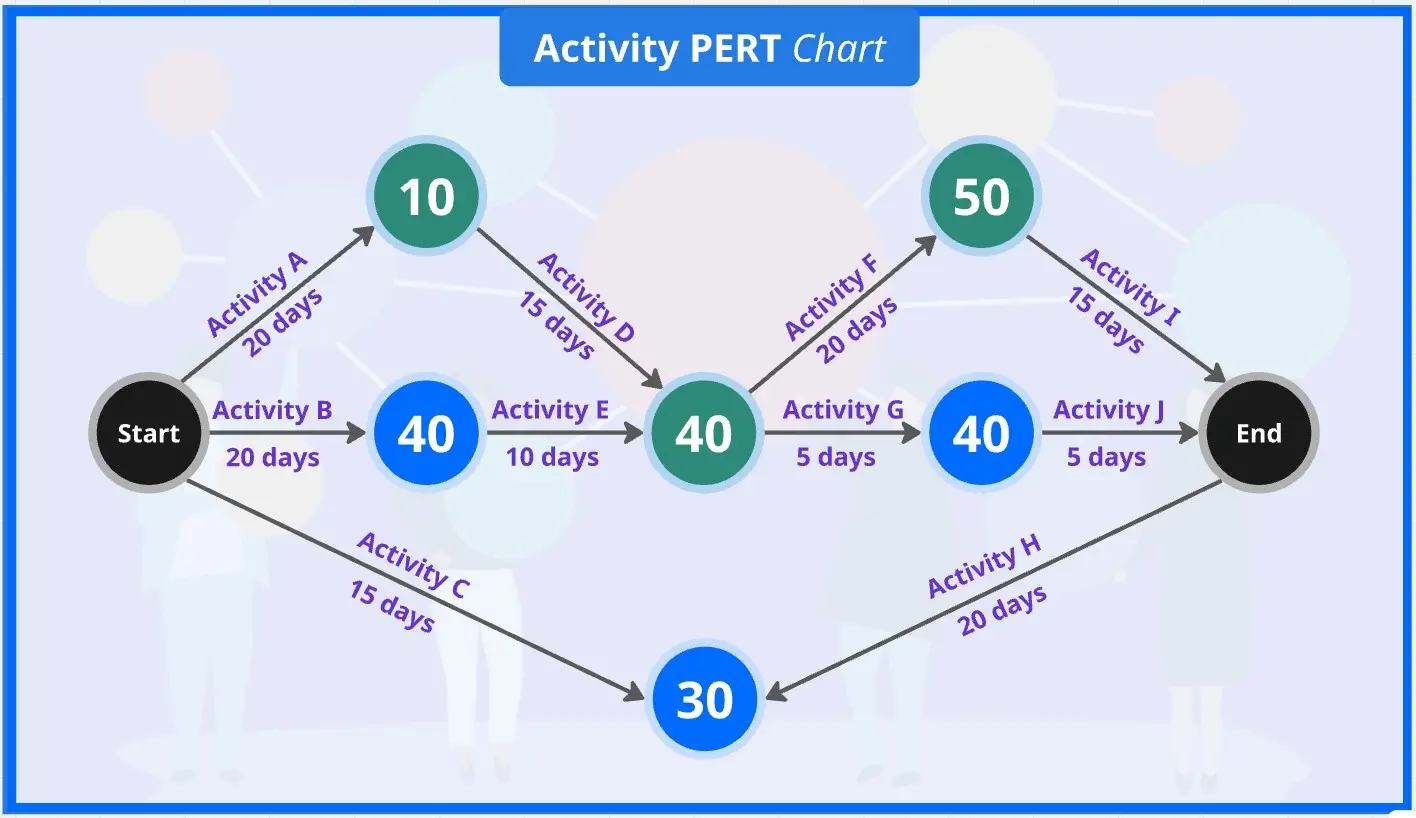
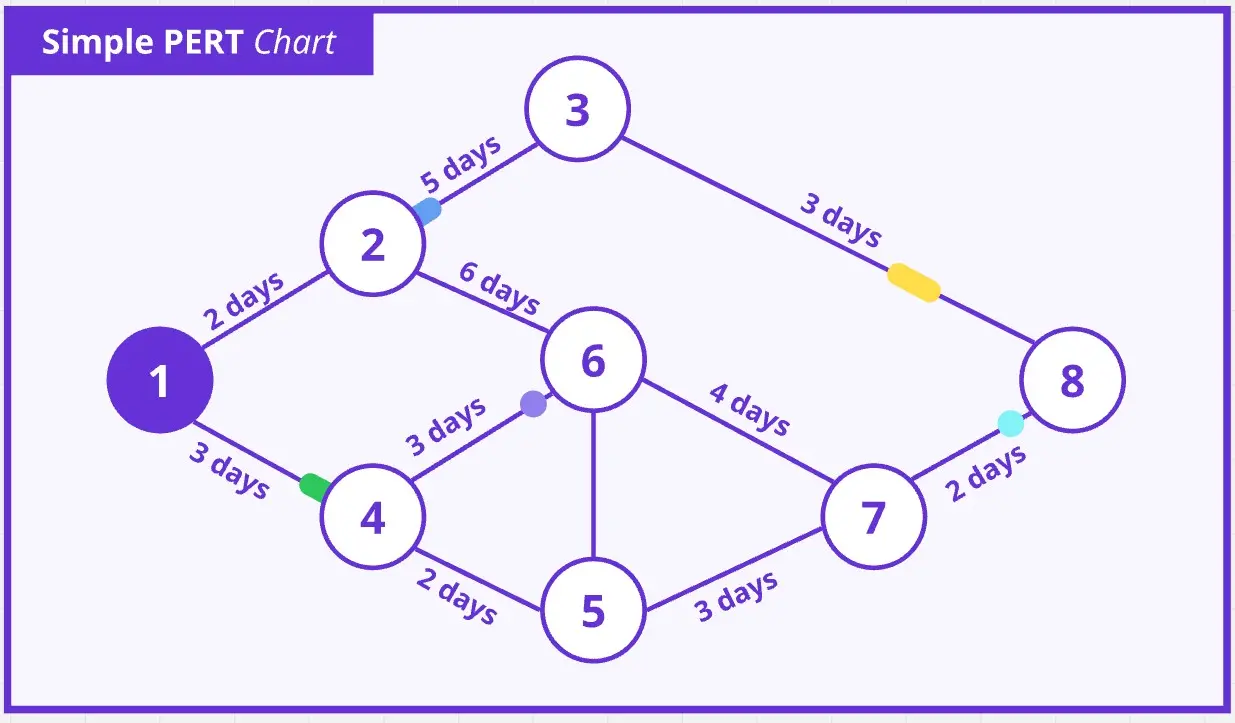
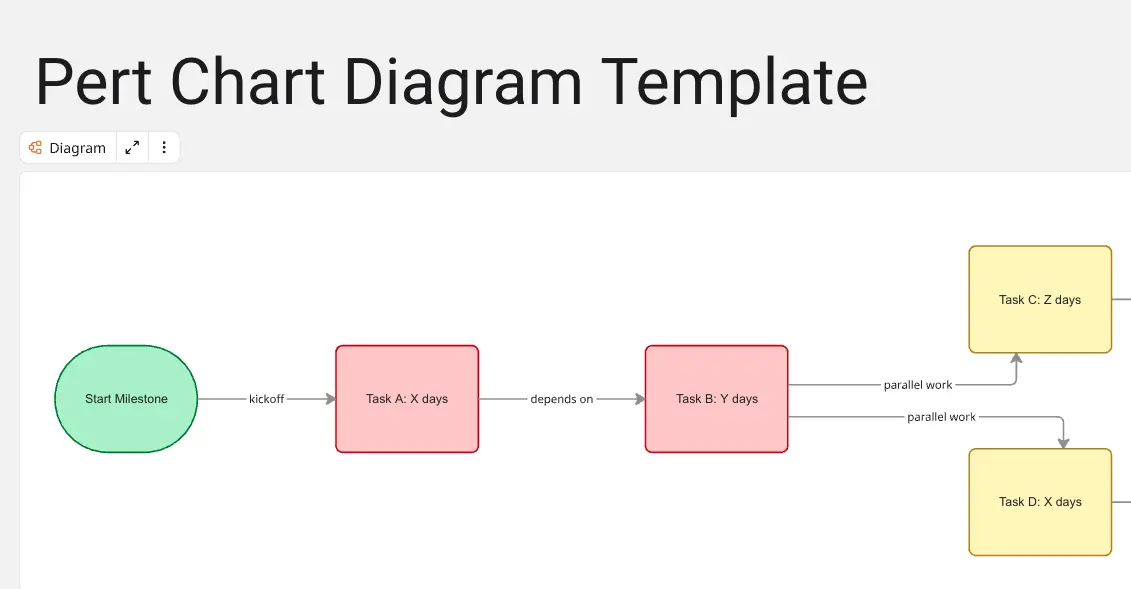
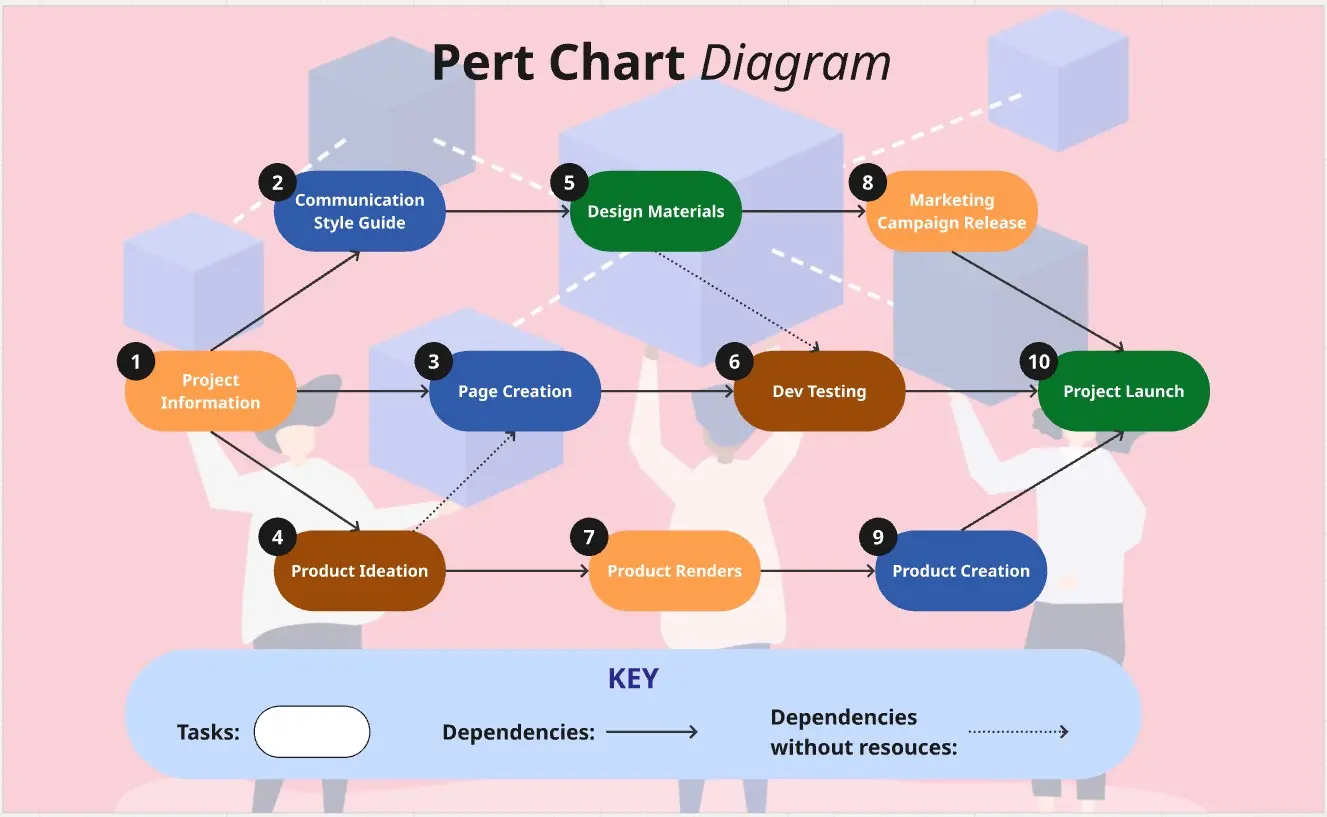
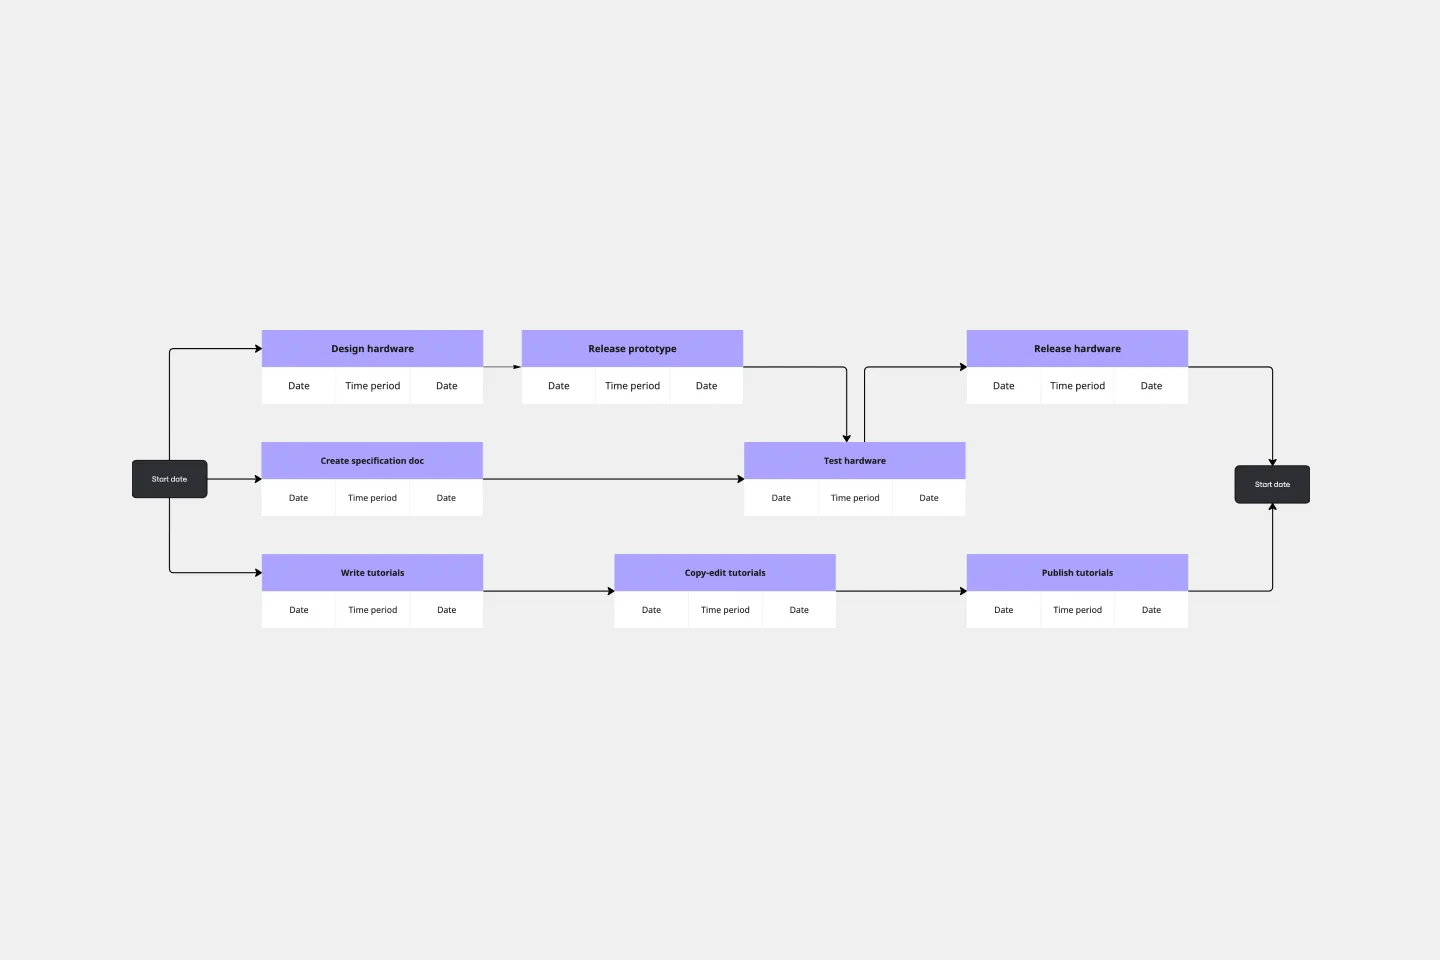
1. Identify project tasks
List all the individual tasks within the project and gather necessary information.
2. List task dependencies
See which tasks rely on a previous task’s completion before starting.
3. Define project events or milestones
You can use these to help track project progress by drawing nodes shaped like a rectangle or circle to indicate them.
4. Use arrows or vectors to connect different nodes
Arrows represent tasks. Arrows from one task to another represent a dependent task. Add expected time frames for each phase on the vectors.
5. Use divergent arrows for concurrent tasks
You can also use dotted lines to show dependencies that don’t need resources.
6. Identify a critical path
And use different colored node outlines or a specific arrow color to visualize it.
7. Share your diagram
Once you’ve finished your PERT chart, you can share it with your team and key stakeholders. Using Miro, it’s easy to update the diagram based on their feedback.
How does a PERT diagram work?
A PERT diagram consists of two main elements — nodes and vectors. Nodes are circles or rectangles that represent project milestones and major events. Vectors are lines that represent tasks. The direction of the vectors shows the sequence of task or event completion.
You can add numbers on vectors to indicate the order events must be completed in. Most project managers also list the time needed to go from one node to another on the vector.
In PERT, you typically use three different time estimates for each task.
Optimistic time: The minimum amount of time required to accomplish a task in an ideal world.
Pessimistic time: The amount of time your team might need to finish a task if things go wrong.
Most likely time: Your best estimate of how long finishing a task will take.
When indicating time on a PERT diagram, you can either use the most likely time or create a variation with each estimate to create different potential project timelines.
Tasks that are dependent on each other must be performed in a specific order. So, if Task B is dependent on Task A, then the vector is drawn from Task A to B since A needs to be completed first.
You can have different tasks or items at the same stage that are unrelated to each other. We call these parallel tasks.
Benefits of a PERT diagram
Here’s why many project managers use a PERT diagram:
PERT charts help managers gauge the time and resources needed to complete a project.
A well-crafted PERT diagram visualizes the entire project timeline, making it a valuable tool that helps communicate goals and milestones to stakeholders.
They help break down complex projects into achievable milestones and goals.
PMs can understand and ask for assets during any production stage over the course of the entire project.
It’s a tangible project visualization that makes it easier to work together on a project. You can alleviate doubts or queries about the project plan timeline or sequence by referring to the chart.
PERT diagrams are flexible and can easily be changed to match alterations in the project plan.
PMs can identify every employee responsible for successful project completion, including team members from different departments.
When to use a PERT diagram?
A PERT chart is an excellent tool for project managers early on in the project planning process. It can help them evaluate the scope, necessary resources, and a rough timeline of a project.
Determine the critical path and get started quickly
The primary use case of a PERT diagram is determining a project’s critical path. When you lay out your entire project timeline visually, it’s easier to see which sequence of tasks can move you toward project completion the fastest. That’s one of the unique advantages of a PERT chart compared to other methods.
Evaluate necessary resources before starting the project
A visual timeline helps project managers understand what is needed in each project stage. They can plan out how many employees they need, resources, software, and other requirements. It also helps project stakeholders understand their role in the process.
Estimate the timeline
Every client wants to know when their project will be completed. While a PERT diagram might not lead you to a specific completion time, it uses task duration ranges, dependencies, and more. By using the various data points, you can estimate the overall project duration.
Example of a good PERT diagram
Let’s use product development and launch campaigns as a PERT chart example to help you understand how they work.
For this project, there are ten critical events:
Start date
Design hardware
Create specifications doc
Write tutorials
Release prototype
Test hardware
Release hardware
Copy-edit tutorials
Publish tutorials
End date
Nodes will represent these events in the chart. You will then use arrows to connect one node to another and number these arrows to establish a sequence.
For example, “Start data” will be the first node. Draw an arrow from that node to “Design hardware”. This is the first project sequence that needs to be completed.
You can draw divergent arrows from the first node to define different workflows. In this example, you can draw arrows in three directions — one workflow for product design, one for specs and testing, and one for creating and publishing tutorials. The arrows will eventually lead to the final node. In this case, it is “End date”.
Once all the nodes and arrows are listed, identify and mark the critical path.
PERT chart vs. Gantt chart
PERT diagrams are often confused with Gantt charts. While both are a visual representation of a project timeline, there are key differences between the two:
Visual differences
PERT charts are made up of nodes and arrows, whereas Gantt charts are bar graphs. A Gantt chart uses horizontal bars to depict project phases. Each bar stretches from that phase’s start date to the end date.
Dependencies
PERT diagrams use arrows to show dependent tasks. Dependencies on a Gantt chart are shown in a Waterfall-like structure.
Timing
Teams usually create a PERT chart before a project kicks off to get a broad overview. PMs can then use Gantt charts or other diagrams to break down specific tasks in more detail.
Customization:
You can change the design of a PERT diagram to match different projects, but a Gantt chart always has a strict bar chart-based structure.
How do you make a PERT diagram?
Draw a PERT diagram online using a visual workspace like Miro. With our PERT chart template, diagramming capabilities, integrations, and collaboration tools, your team can easily outline your project’s workflow.
How do you read a PERT diagram?
In a PERT diagram, the nodes represent project events. Arrows represent tasks. An arrow from one node to another indicates that you must complete all tasks in the first node before the next phase can begin. You can use different types of arrows to signify types of tasks. For example, you can use dotted lines for dependent tasks that don’t share resources. Once you’ve visualized the whole project timeline, you can follow along the nodes and arrows to identify a critical path.
What is the critical path in a PERT chart?
A critical path shows the longest path of essential tasks you must complete to finish a project. For example, you can't move on to do the upholstery and interior if you haven't finished putting up the walls and roof. When one of these tasks is late, it impacts the entire project. To make up for missed deadlines on critical tasks, you should reallocate resources and staff from the low-impact tasks.
Get started with this template right now.
Infographic Template
Works best for:
Marketing, Desk Research, Documentation
As we bet you’ve experienced, data can get pretty dense and dry. But you need it to be compelling, memorable, and understandable. The solution? Infographics. These are tools that let you present information in a visually striking way and turn quantitative or qualitative data into stories that engage and resonate. Whoever you’ll be presenting to — customers, donors, or your own internal teams — our template will let you design an infographic that combines text and visuals to break down even the most complicated data.
Bull's Eye Diagram Template
Works best for:
Diagrams, Project Management, Prioritization
When you’re a growing organization, every decision can feel like it has make-or-break consequences—which can lead to decision paralysis, an inability to prioritize, inefficient meetings, and even low morale. If that sounds like you, put a Bull’s Eye Diagram to work. True to its name, a Bull’s Eye Diagram uses a model of concentric circles to help companies establish priorities, make critical decisions, or discuss how to remove or overcome obstacles.
Meeting Organizer Template
Works best for:
Meetings, Workshops, Project Planning
When it comes to ideas generated during a meeting, you want quantity AND quality. So why choose? Our meeting organizer template will maximize your meeting’s chances of yielding lots of great ideas. It will give you a simple, efficient way to design any activity (including meetings and daily planning) and make sure remote teammates know just what the meeting aims to accomplish. And you can give your meeting organizer power by connecting Miro to your favorite apps and services: Atlassian’s JIRA, Google Drive, Slack, Trello, DropBox and OneDrive.
BPMN Template
Works best for:
Mapping, Diagrams, Business Management
The BPMN template helps you track and get an overview of your business processes. It’s a great way to identify any bottlenecks and make your operations more efficient. The BPMN methodology became a universal language when managing business processes, and multiple industries use it as a management tool. Project managers, business analysts, and IT administrators use the BPMN process flow diagram to manage projects, visually communicate the process flows, and keep track of process constraints. Try it for yourself and see improvements in your organization’s agility.
Sitemap Template
Works best for:
Mapping, Software Development, Diagrams
Building a website is a complex task. Numerous stakeholders come together to create pages, write content, design elements, and build a website architecture that serves a target audience. A sitemap is an effective tool for simplifying the website design process. It allows you to take stock of the content and design elements you plan to include on your site. By visualizing your site, you can structure and build each component in a way that makes sense for your audience.
Stakeholder Analysis Template
Works best for:
Project Management, Strategic Planning, Project Planning
Managing stakeholders is integral to completing a project on time and meeting expectations, so here’s how to use a stakeholder analysis to help. A stakeholder analysis empowers you to meet expectations and complete projects on time by identifying individuals, groups, and organizations with a vested interest in a program or process. In a typical stakeholder analysis, you’ll prioritize stakeholders based on their influence on a project and seek to understand how best to interface with them throughout the course of the project.