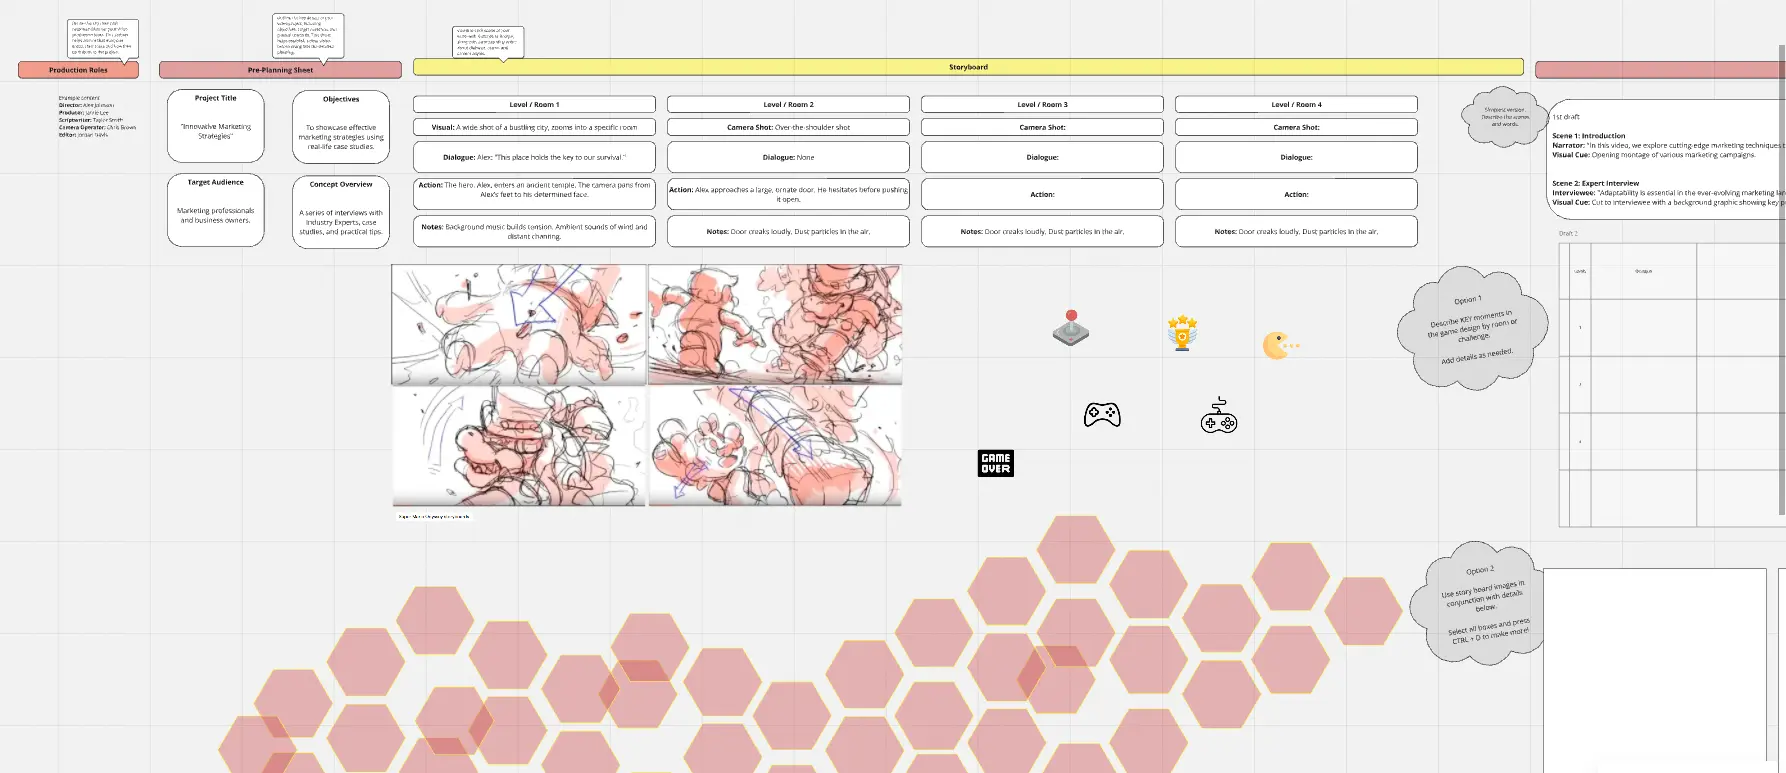
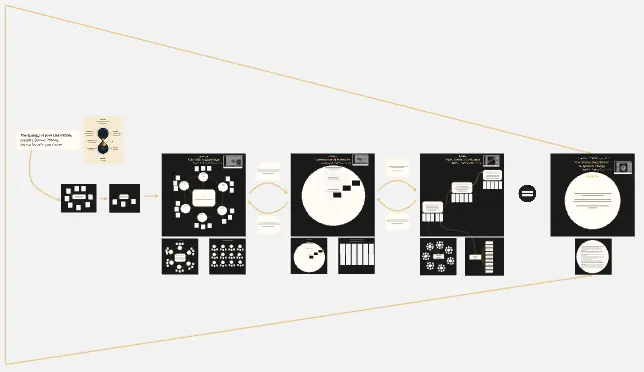
Storyboard for Game Design
The Storyboard for Game Design template is a structured tool for visualizing your game’s development from concept to execution. It includes sections for roles, storyboarding, scripting, and asset management, ensuring clarity, consistency, and alignment across the team. Ideal for game designers, this template streamlines planning, helps manage resources, and promotes a cohesive and engaging gaming experience.