2 likes
919 uses
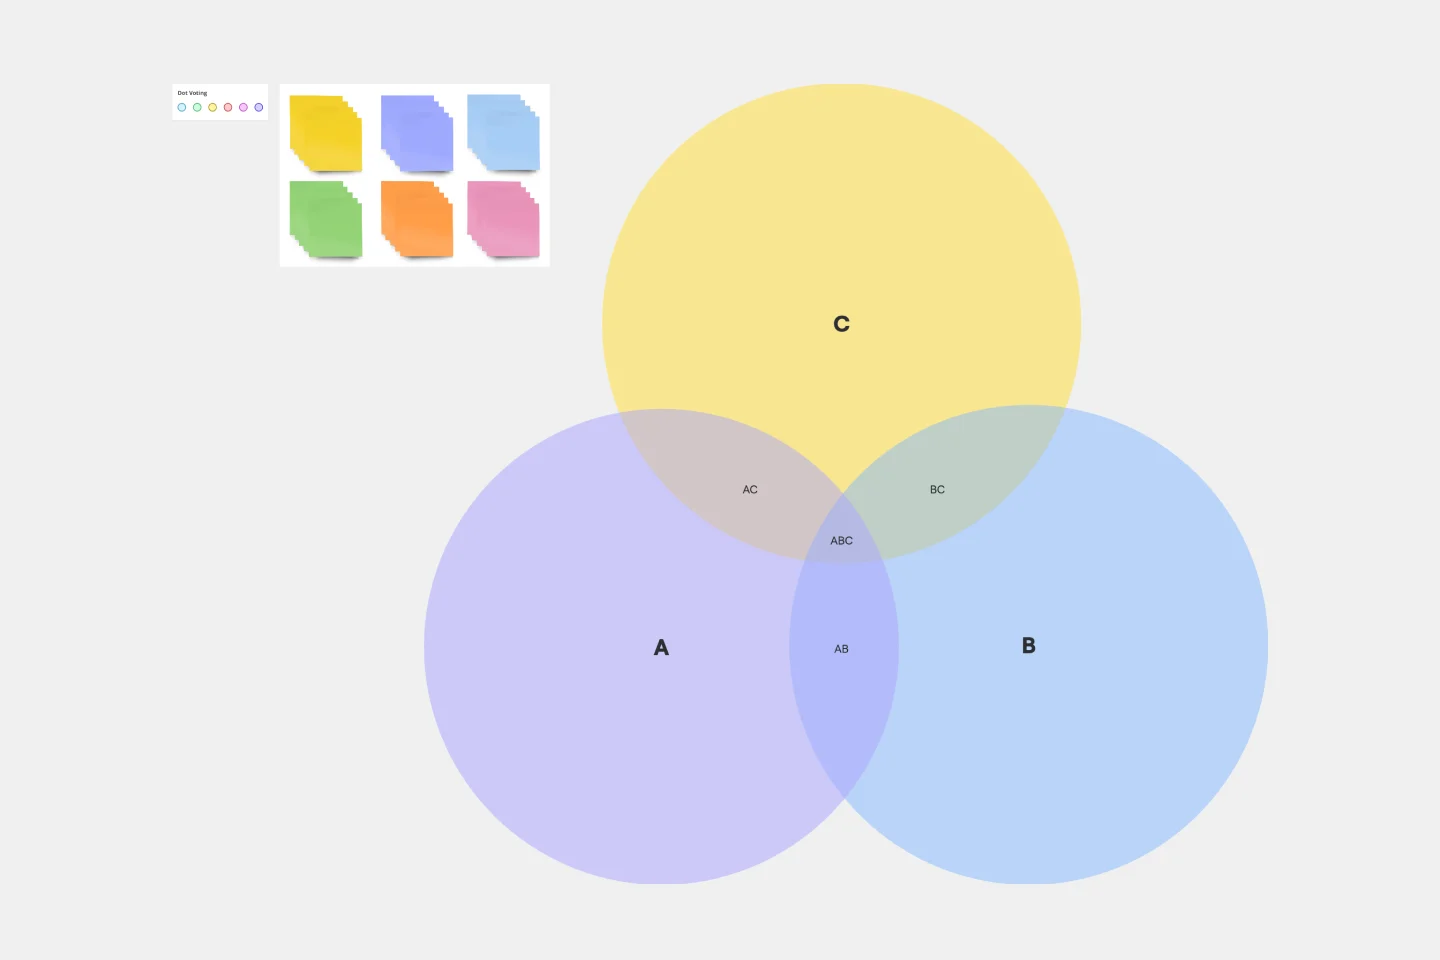
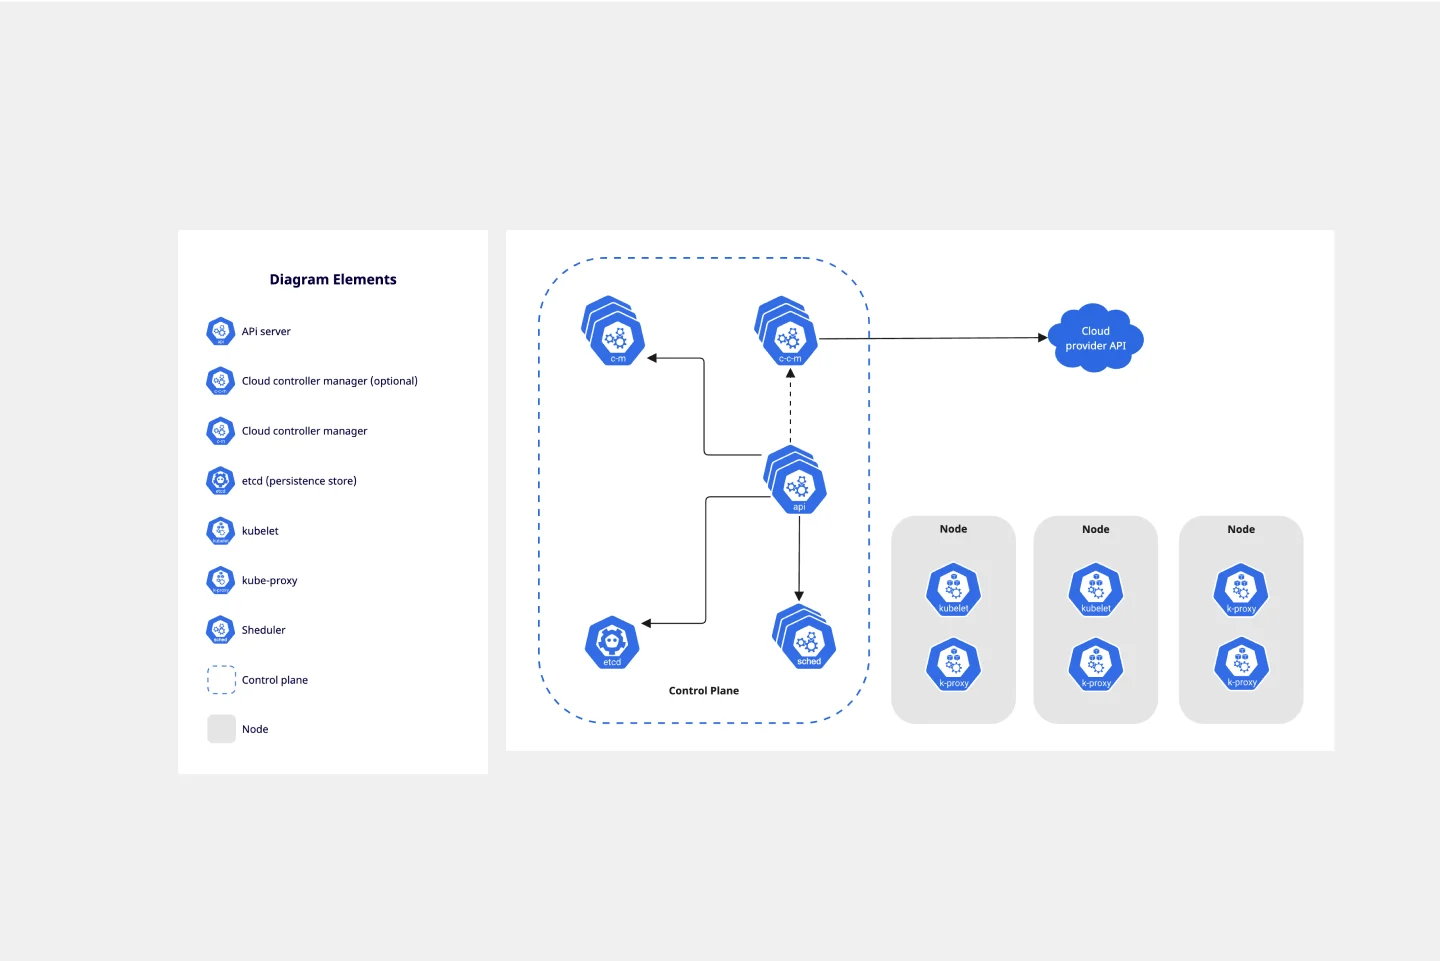
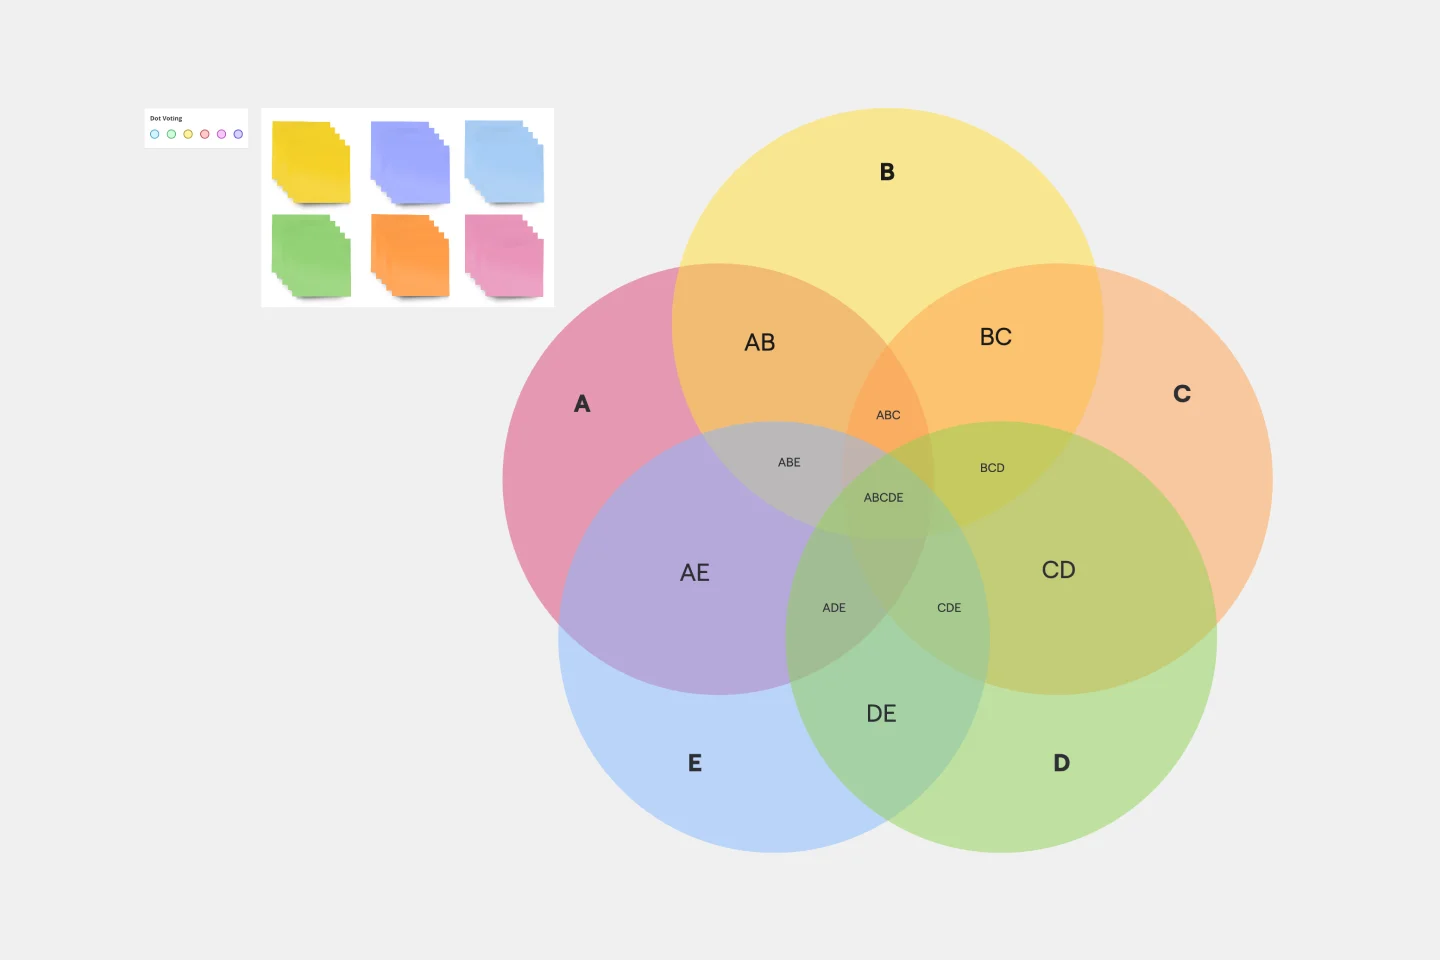
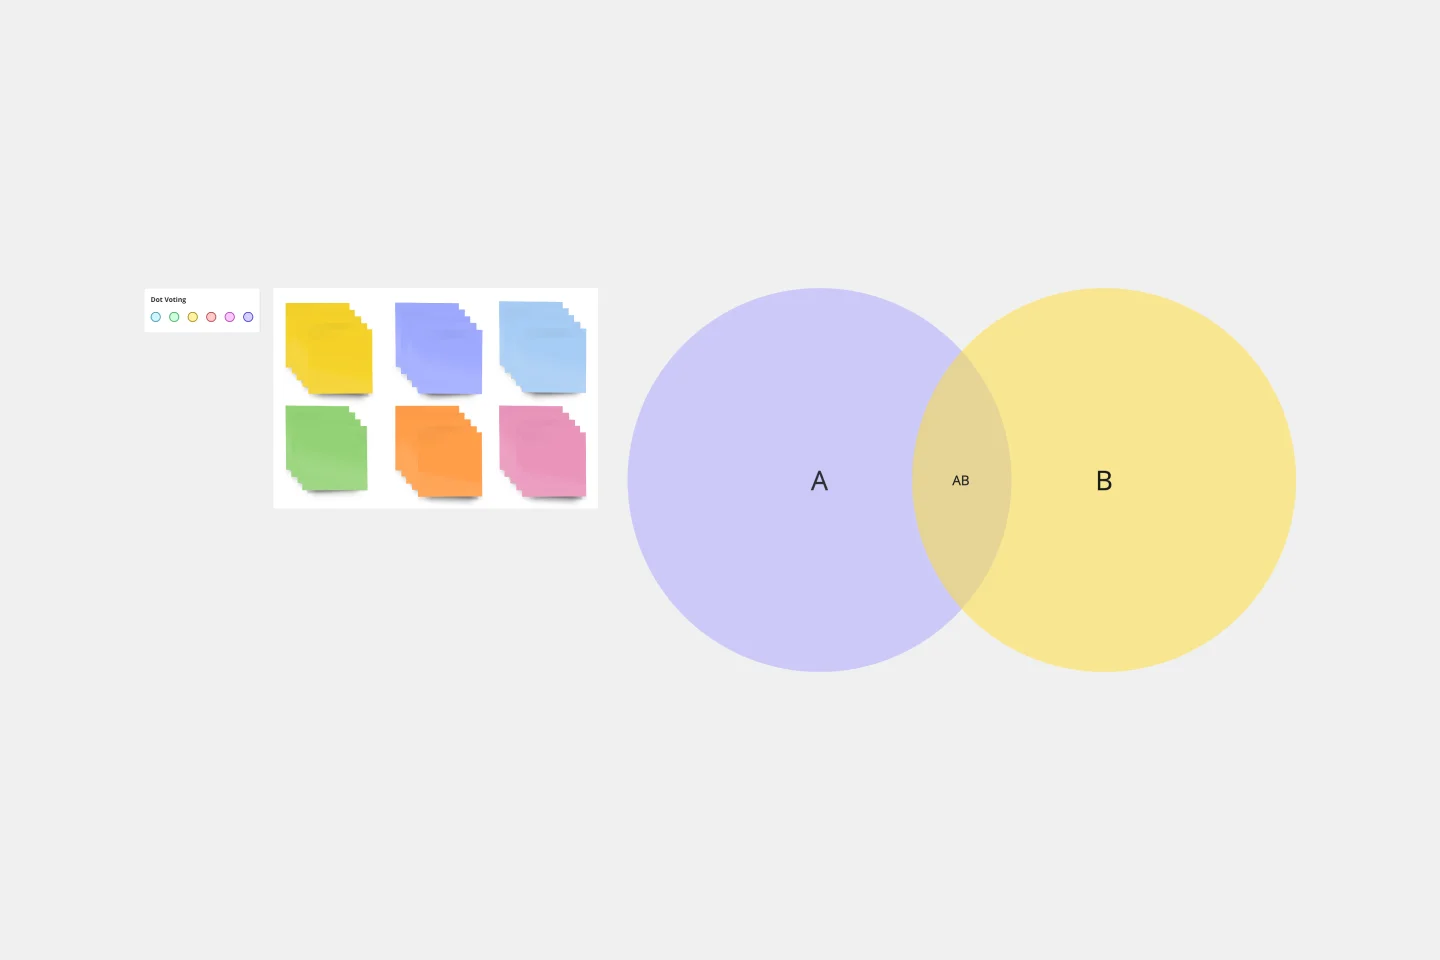
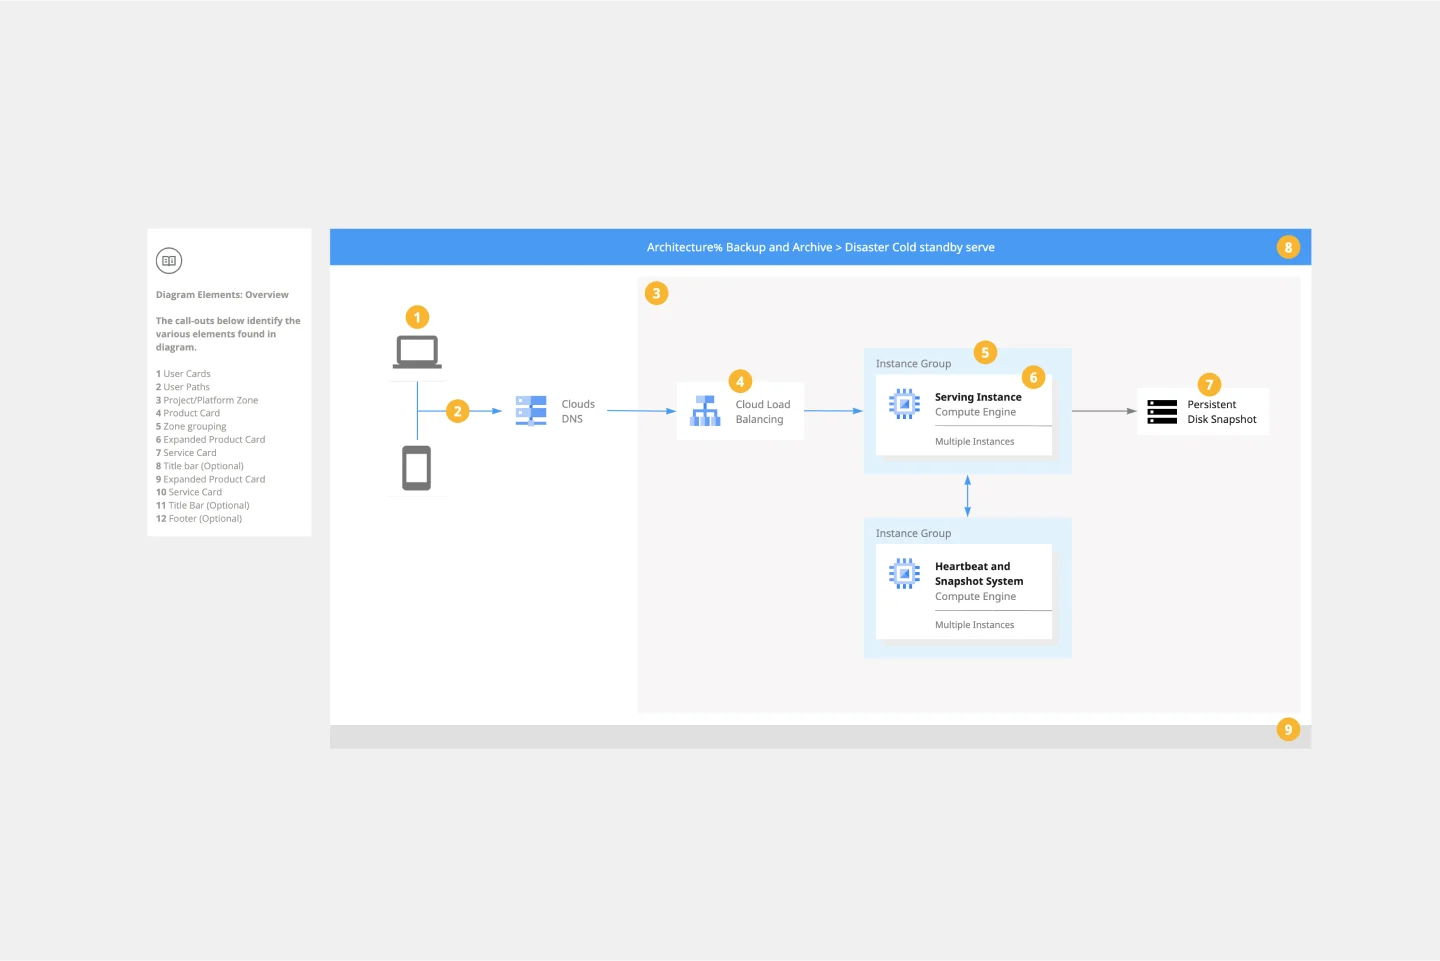
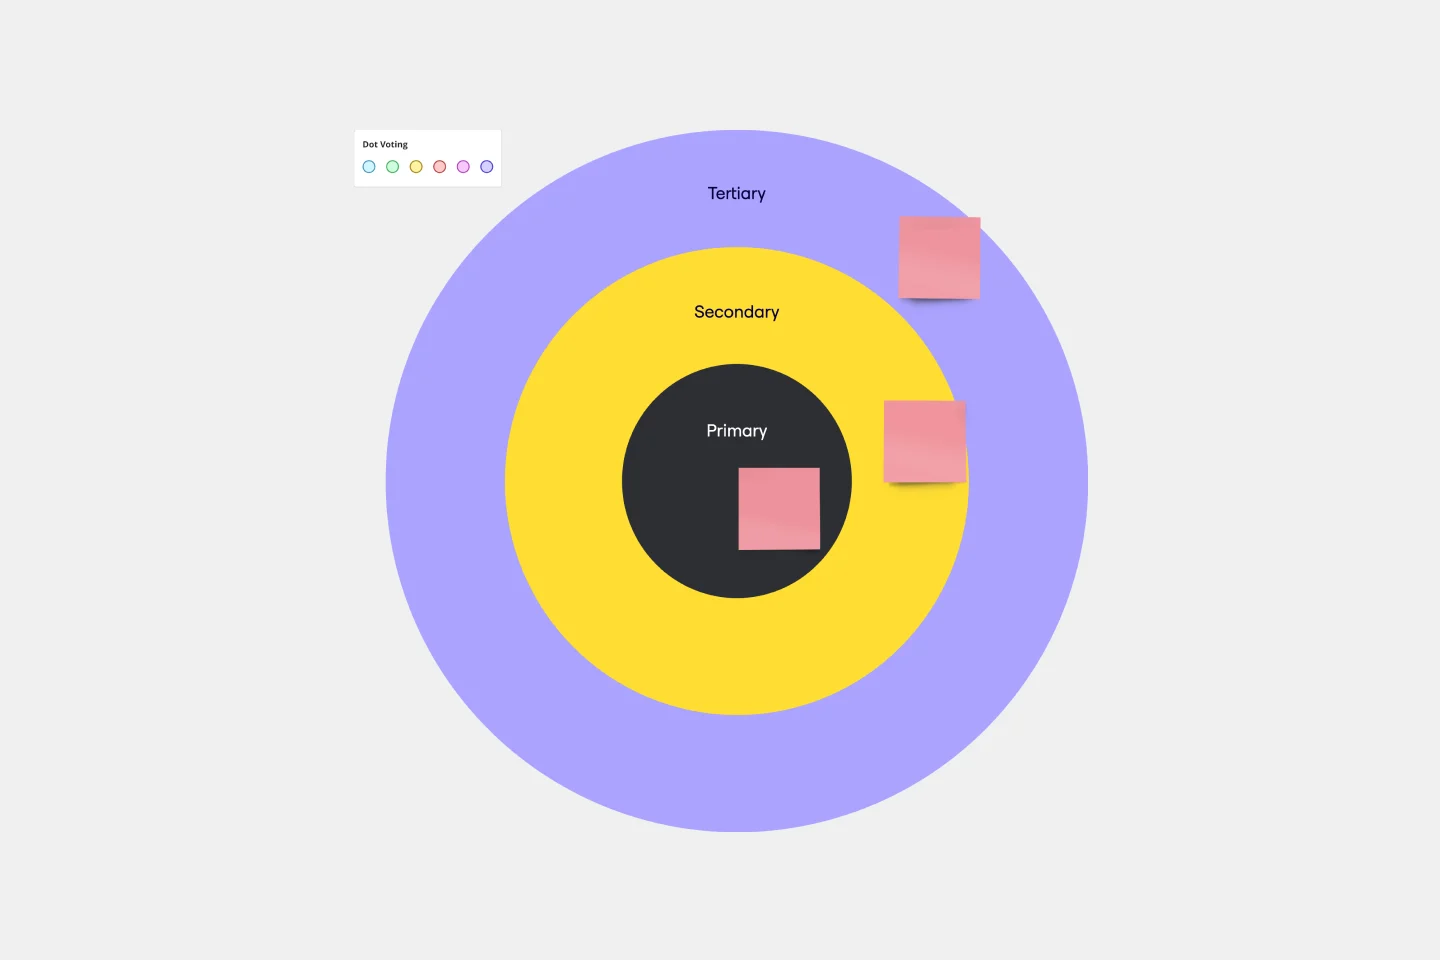
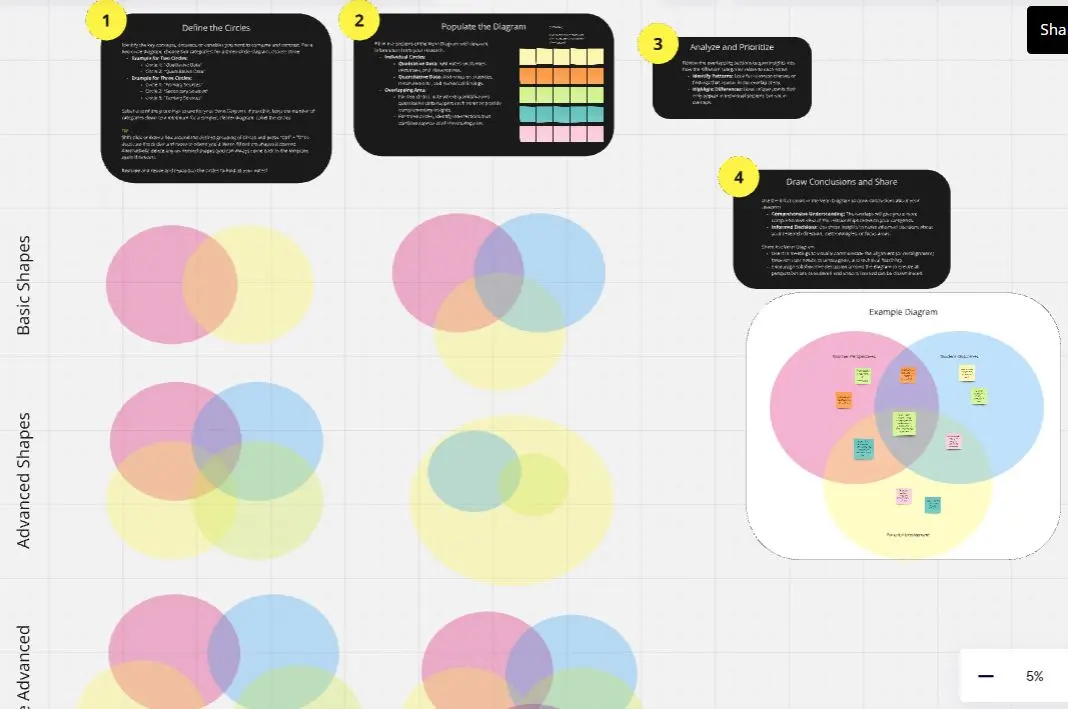
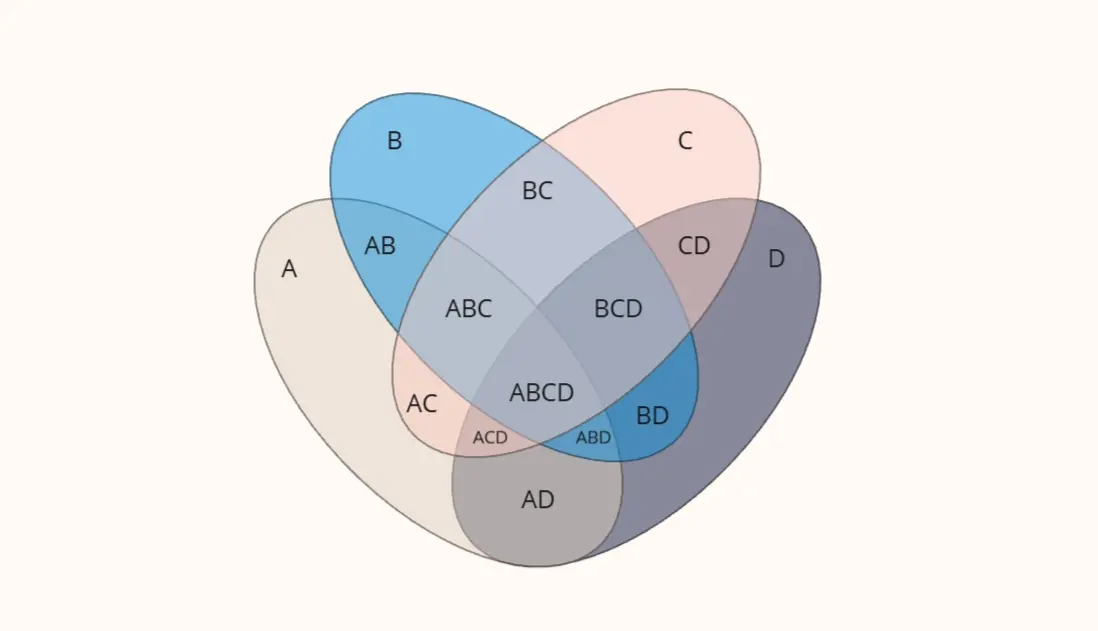
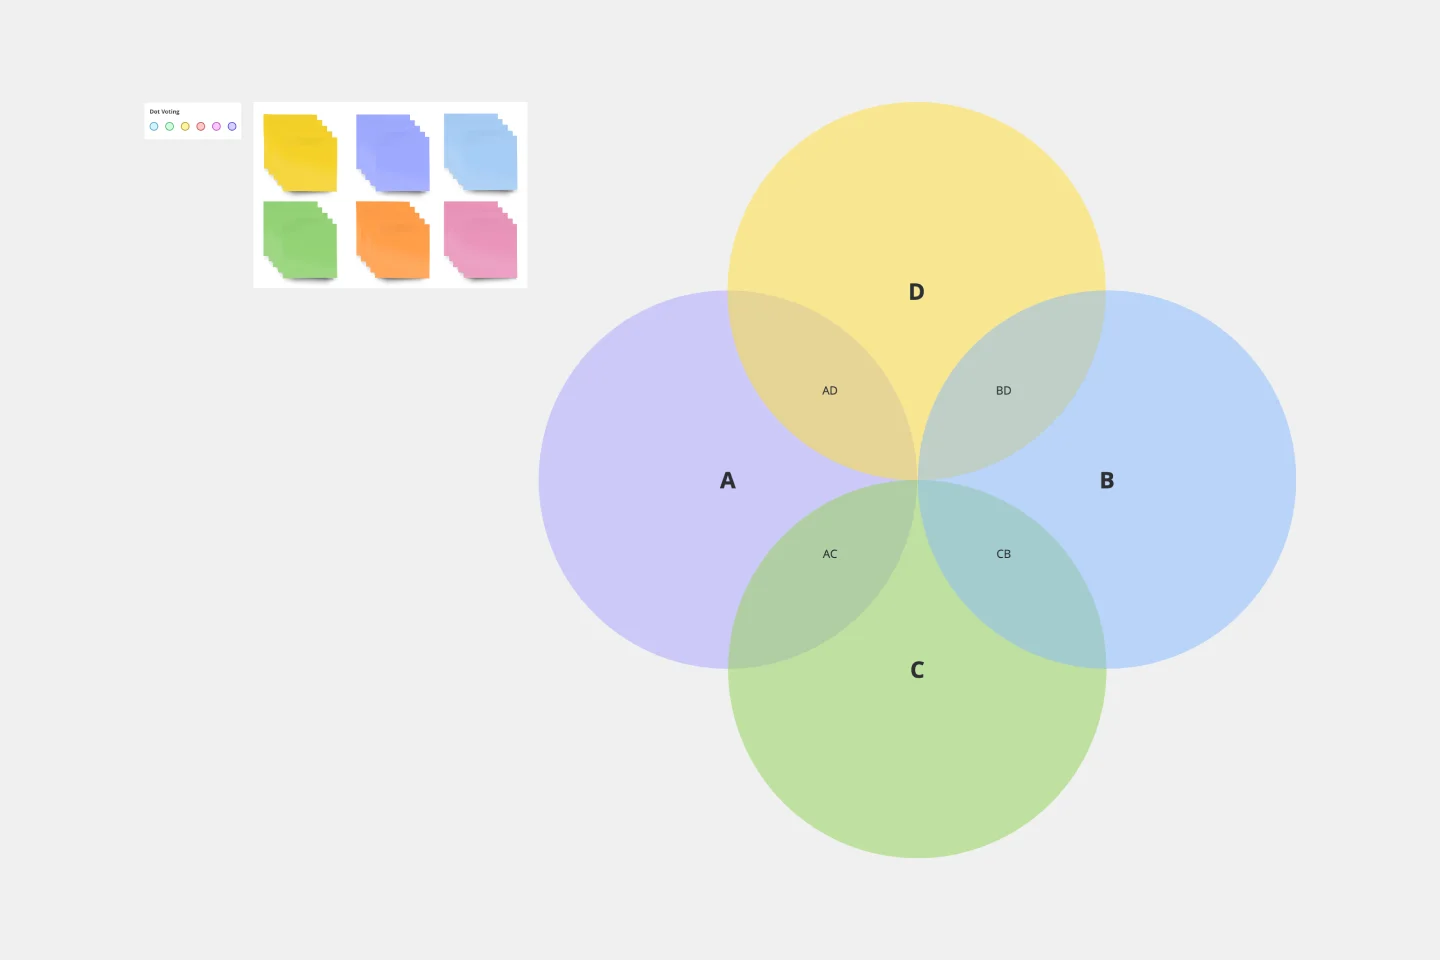
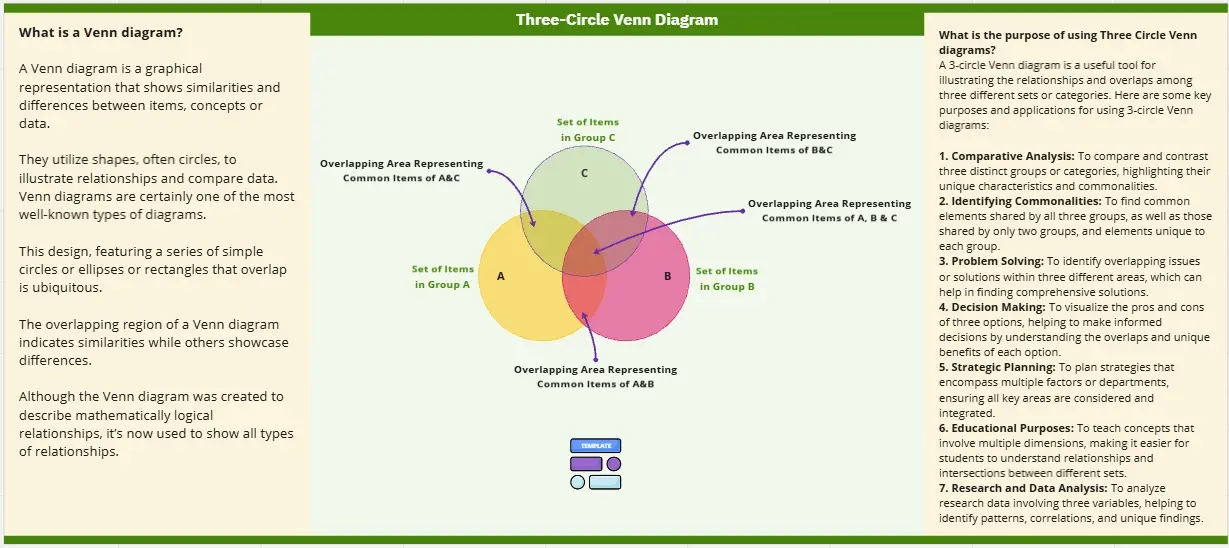
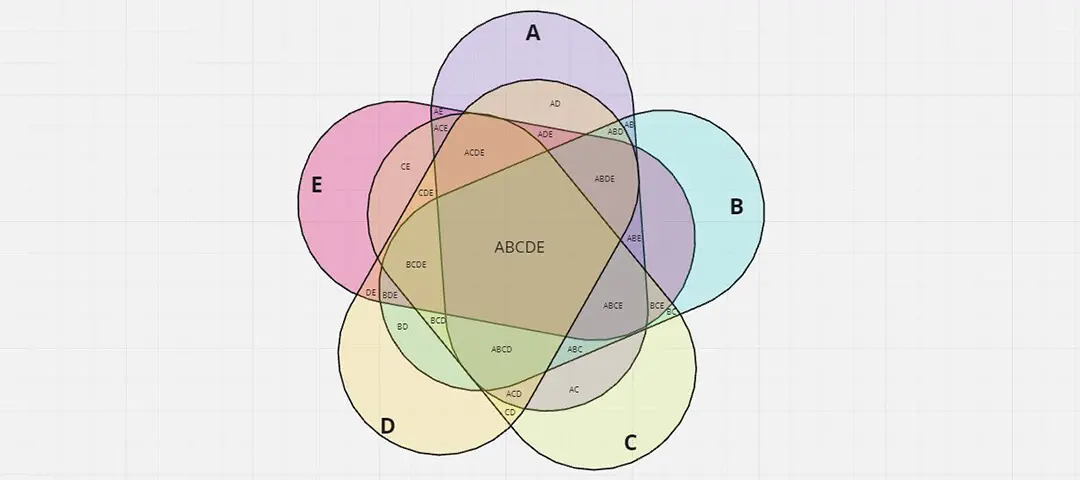
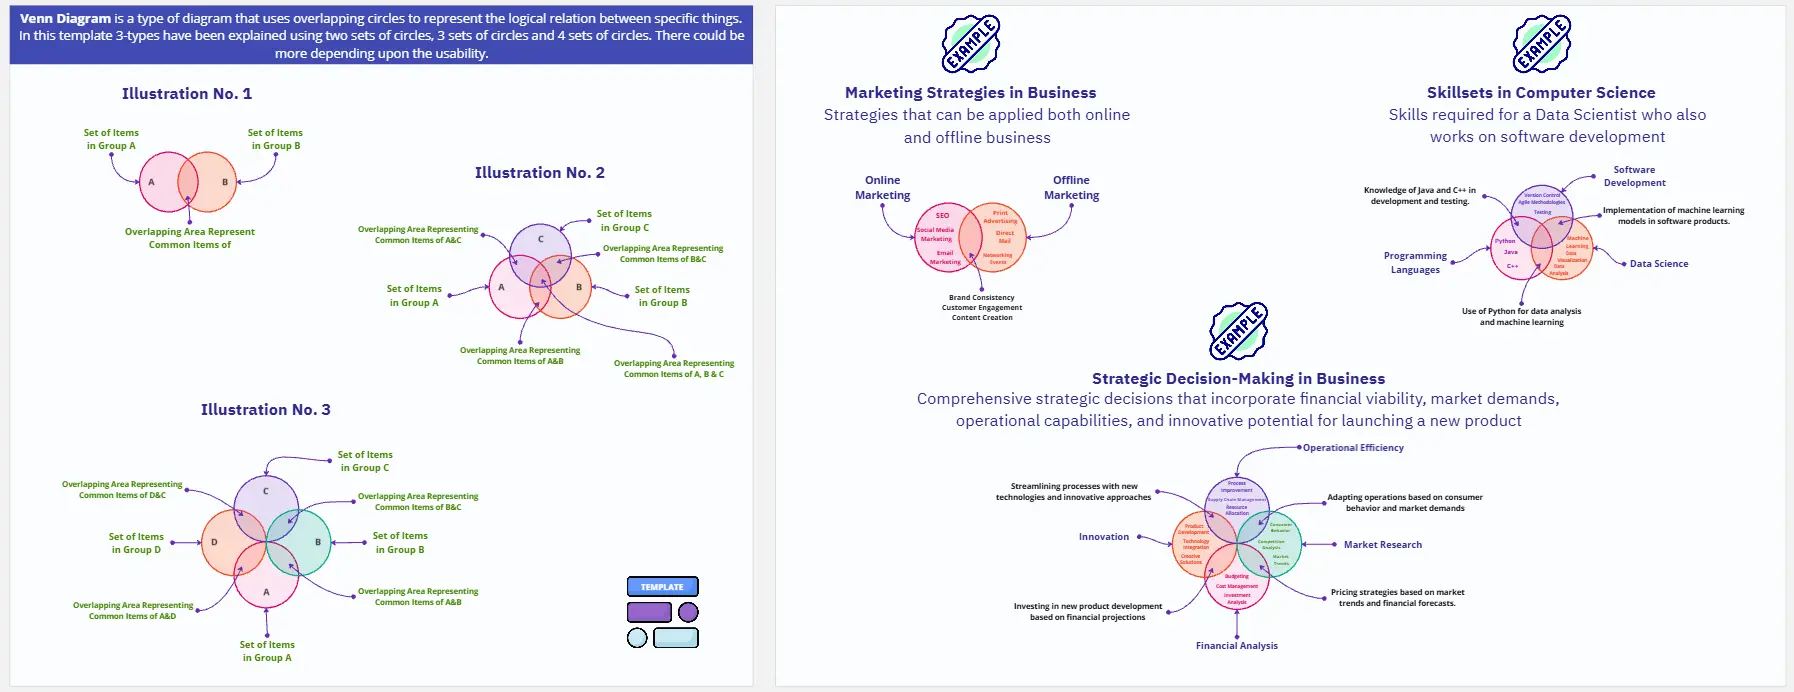
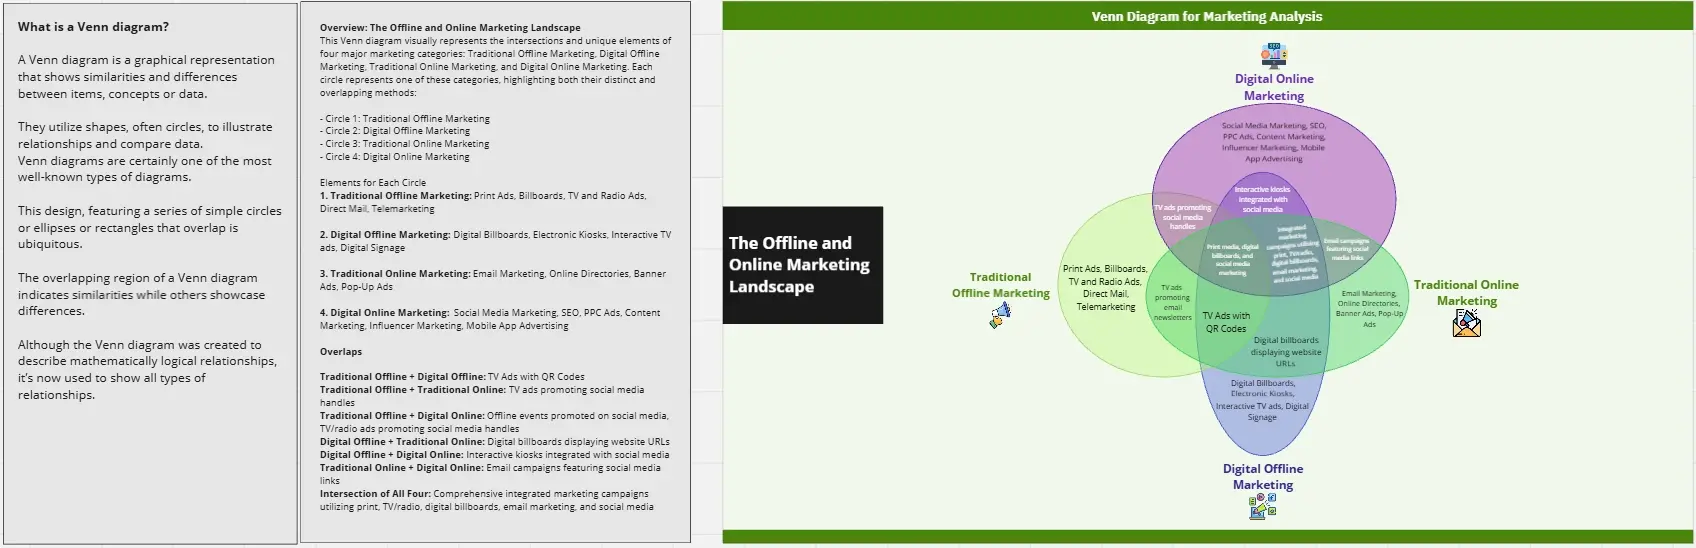
3-Circle Venn Diagram
Venn diagrams have been a staple of business meetings and presentations since the 1800s, and there’s a good reason why. Venn diagrams provide a clear, effective way to visually showcase relationships between datasets. They serve as a helpful visual aid in brainstorming sessions, meetings, and presentations. You start by drawing a circle containing one concept, and then draw an overlapping circle containing another concept. In the space where the circles overlap, you can make note of the concepts’ similarities. In the space where they do not, you can make note of their differences.