2-Circle Venn Diagram Template
Simplify complex ideas, boost team collaboration, and foster innovative insights with the 2-Circle Venn Diagram Template. It's an all-encompassing tool that improves your decision-making and brainstorming processes.
About the 2 Circle Venn Diagram Template
The 2 Circle Venn Diagram Template is one tool that helps teams to collaborate and communicate better. Whether for business strategy, education, or simply brainstorming, this universal template allows you to illustrate connections and disparities and distill complex data into digestible visual information.
What's a 2-Circle Venn Diagram Template?
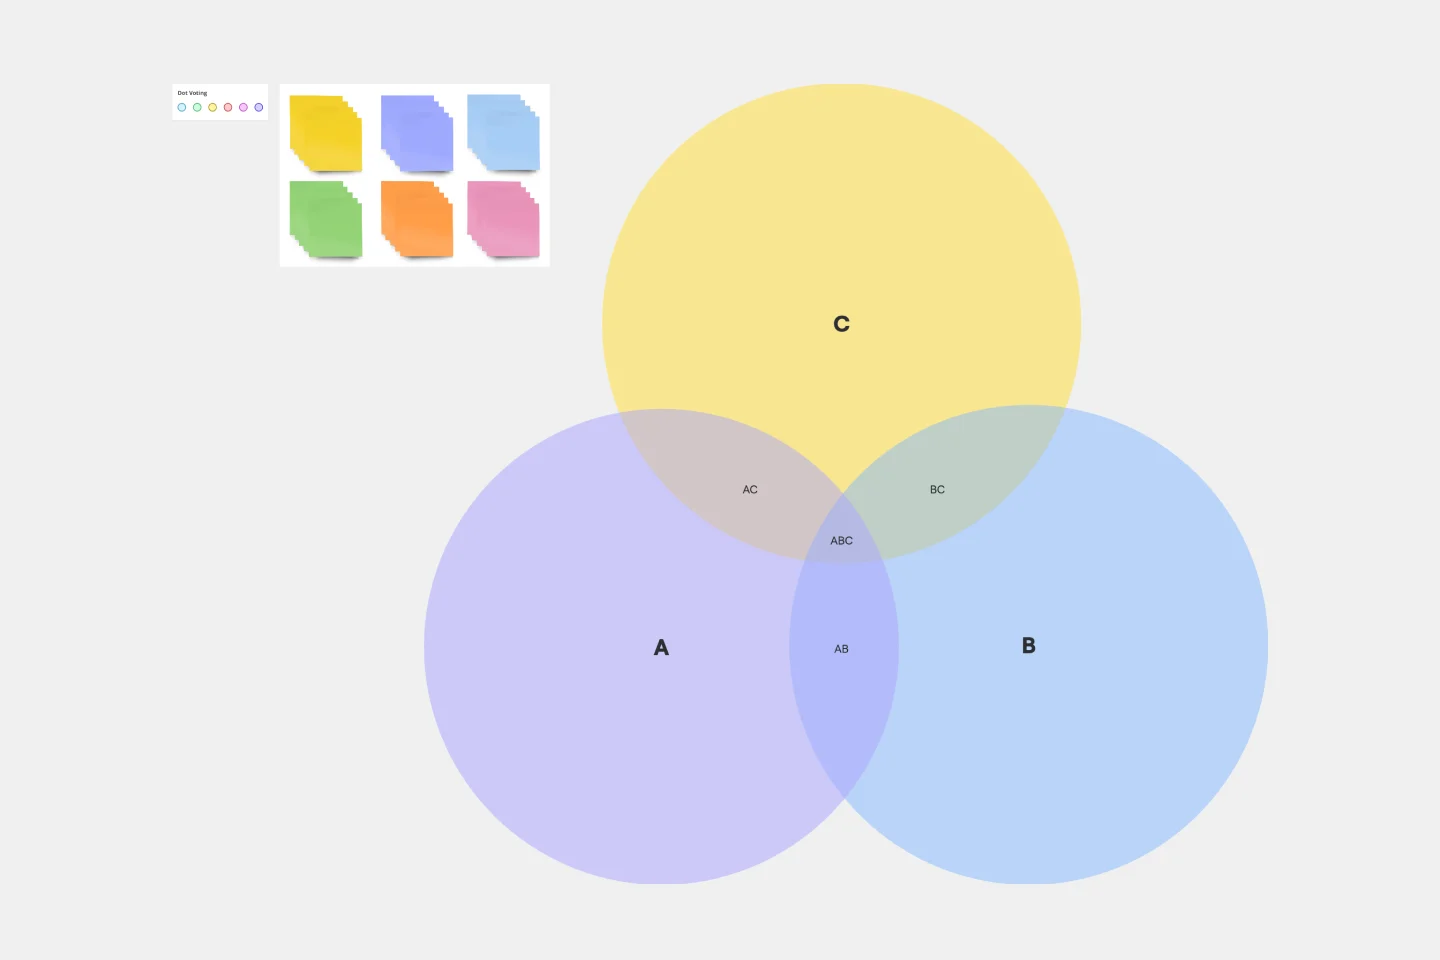
A 2-Circle Venn Diagram is a visual representation that maps the relationship between two distinct groups or sets of data. It consists of two overlapping circles, where each circle symbolizes a unique set. These circles' overlapping or intersecting area delineates shared traits or commonalities between these sets. Venn diagrams are an easy-to-understand visual tool that allows you to represent complex relationships, compare and contrast different entities, and stimulate thought-provoking discussions.
How to use a 2-Circle Venn Diagram Template in Miro?
Step 1: Select the 2-Circle Venn Diagram Template and add it to your board.
Step 2: Once the template is on your board, label each circle to represent the two sets or groups you are comparing and contrasting.
Step 3: Fill your circles with respective data points or ideas. Depending on your project's requirements, these could be anything from product features to business strategies.
Step 4: Use Miro's automated diagramming features for an impeccably neat and professional look. These tools automatically align and space your elements, helping you maintain consistency throughout your diagram.
Step 5: Edit your 2-circle Venn diagram effortlessly. Adjust, move, and edit elements until you achieve a layout that serves your purpose best.
Step 6: Finally, invite your team members to collaborate. They can simultaneously work on the diagram, provide real time feedback, and contribute to it. Once satisfied with your Venn Diagram, you can share it with others via a link or present it in a meeting.
Remember, practice makes perfect. The more you use the 2 Circle Venn Diagram Template in Miro, the more fluent you'll become at visualizing and communicating complex relationships and ideas. Miro is the perfect Venn diagram maker with a range of available templates and the ability to customize everything, from the number of circles to labeling and colors. Happy diagramming!
Can I customize my 2 Circle Venn Diagram Template in Miro?
Absolutely! Change the size, colors, and labels of the circles, as well as the fonts used, thereby aligning your diagram with your project's unique aesthetics or your personal preferences.
Can multiple team members collaborate on a single Venn Diagram?
Yes. Team members can work simultaneously on the same Venn Diagram, making it a truly interactive experience. They can add comments, provide real-time feedback, and contribute to the diagram, enhancing team synergy.
Does Miro support data import for creating Venn Diagrams?
Yes, Miro supports data import from a range of formats. This functionality streamlines the process of inputting the necessary information into your Venn Diagram, saving you time and ensuring accuracy.
Can I share my Venn Diagram with people who do not have a Miro account?
Yes, Miro allows you to share your Venn Diagram via a link. The receivers can view it without a Miro account. However, if they need to edit or contribute, they must create a free account.
Get started with this template right now.
Incident Management Process Flowchart Template
The Incident Management Process Flowchart Template in Miro is designed to streamline and clarify the process of managing incidents within an organization. This template serves as a visual guide that outlines the steps involved in incident management, from the initial declaration to the final review. It is a living document, continuously evolving based on feedback and lessons learned from past incidents, ensuring that the process remains up-to-date with best practices. By defining incidents as disruptions requiring a coordinated response to restore service levels, the template emphasizes the importance of a structured, organized, and timely approach. It covers various phases such as Incident Declaration, Assessment, Response, Communication, and Review, providing a clear framework for teams to follow.
Cross Functional (Swimlane) Chart
Works best for:
Flowcharts, Mapping, Diagrams
The Cross Functional (Swimlane) Chart template offers a visual tool for mapping out processes or workflows with multiple stakeholders or functional areas. It provides swimlanes for organizing tasks and responsibilities by department or role. This template enables teams to visualize process flows, identify handoffs, and improve coordination and collaboration across functions. By promoting transparency and accountability, the Cross Functional (Swimlane) Chart empowers organizations to streamline workflows and drive cross-functional alignment effectively.
Fault Tree Analysis Template
Works best for:
Diagramming
The Fault Tree Analysis Template visually breaks down potential system malfunctions, highlighting complex causal relationships between faults. One of its standout benefits is its ability to enhance clarity in complex scenarios, allowing professionals to swiftly pinpoint root causes and prioritize interventions, ensuring a more streamlined approach to problem-solving.
UML Sequence Deployment Pipeline Template
Works best for:
UML
The UML Sequence Deployment Pipeline Template in Miro visually maps the sequence of steps in an automated deployment pipeline, helping teams in software development and deployment. It helps identify bottlenecks, standardizes the deployment process, and facilitates new member onboarding for continuous improvement.
Bubble Map Template
Works best for:
Diagramming, Mapping, Brainstorming
A Bubble Map Template is a visual organization tool that uses bubbles or circles to represent various ideas or data points. These bubbles are linked together, displaying their relationships and creating a network of interconnected thoughts. Use a Bubble Map Template to streamline complex information, enhancing comprehension and promoting efficient decision-making.
Driver Diagram Template
Works best for:
Diagramming
The driver diagram template is a strategic visual tool that helps teams map out their primary objectives and break them down into actionable components. It presents goals, drivers, and specific change ideas in a coherent and interconnected format, ensuring clarity of objective. By doing so, every team member is aligned towards a common endpoint, fostering unified efforts. The visual nature of the template simplifies complex objectives, making it easier for teams to stay on track and measure their progress effectively.