PERT Chart Diagram Template
Brief
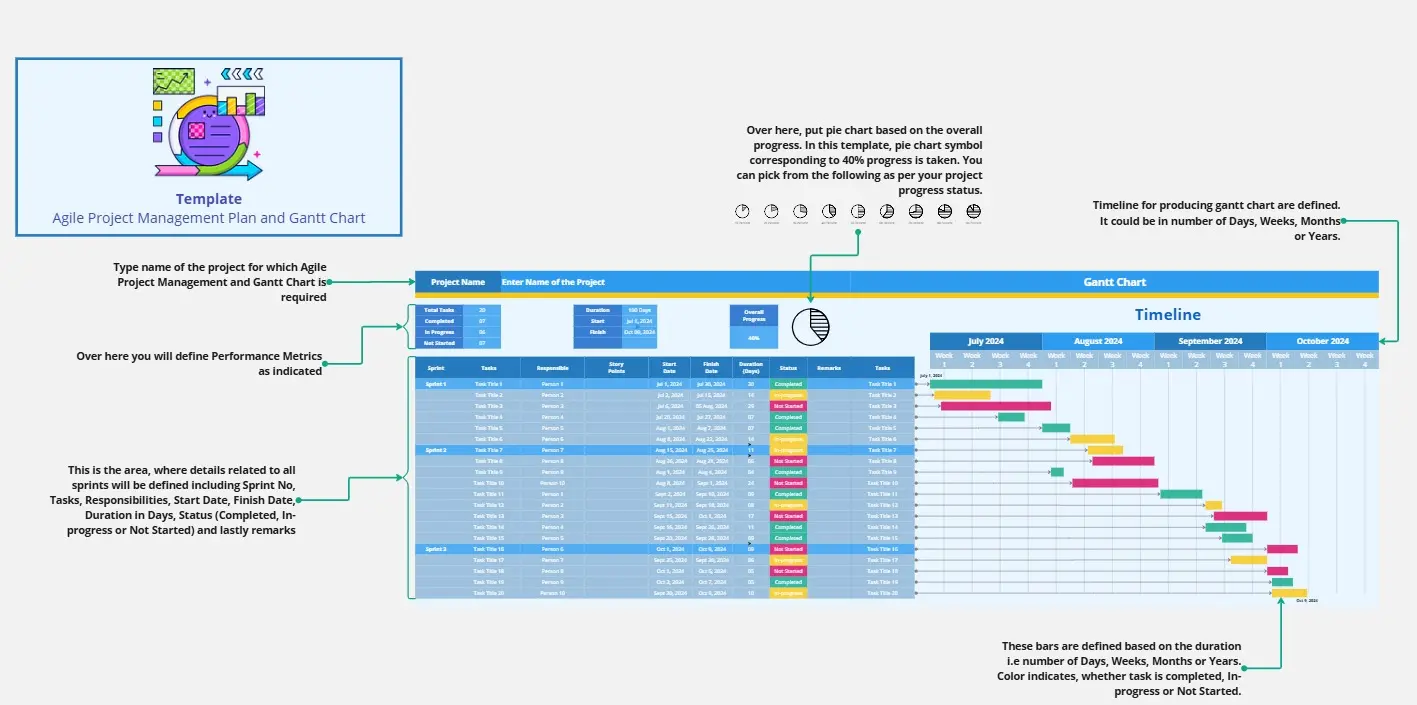
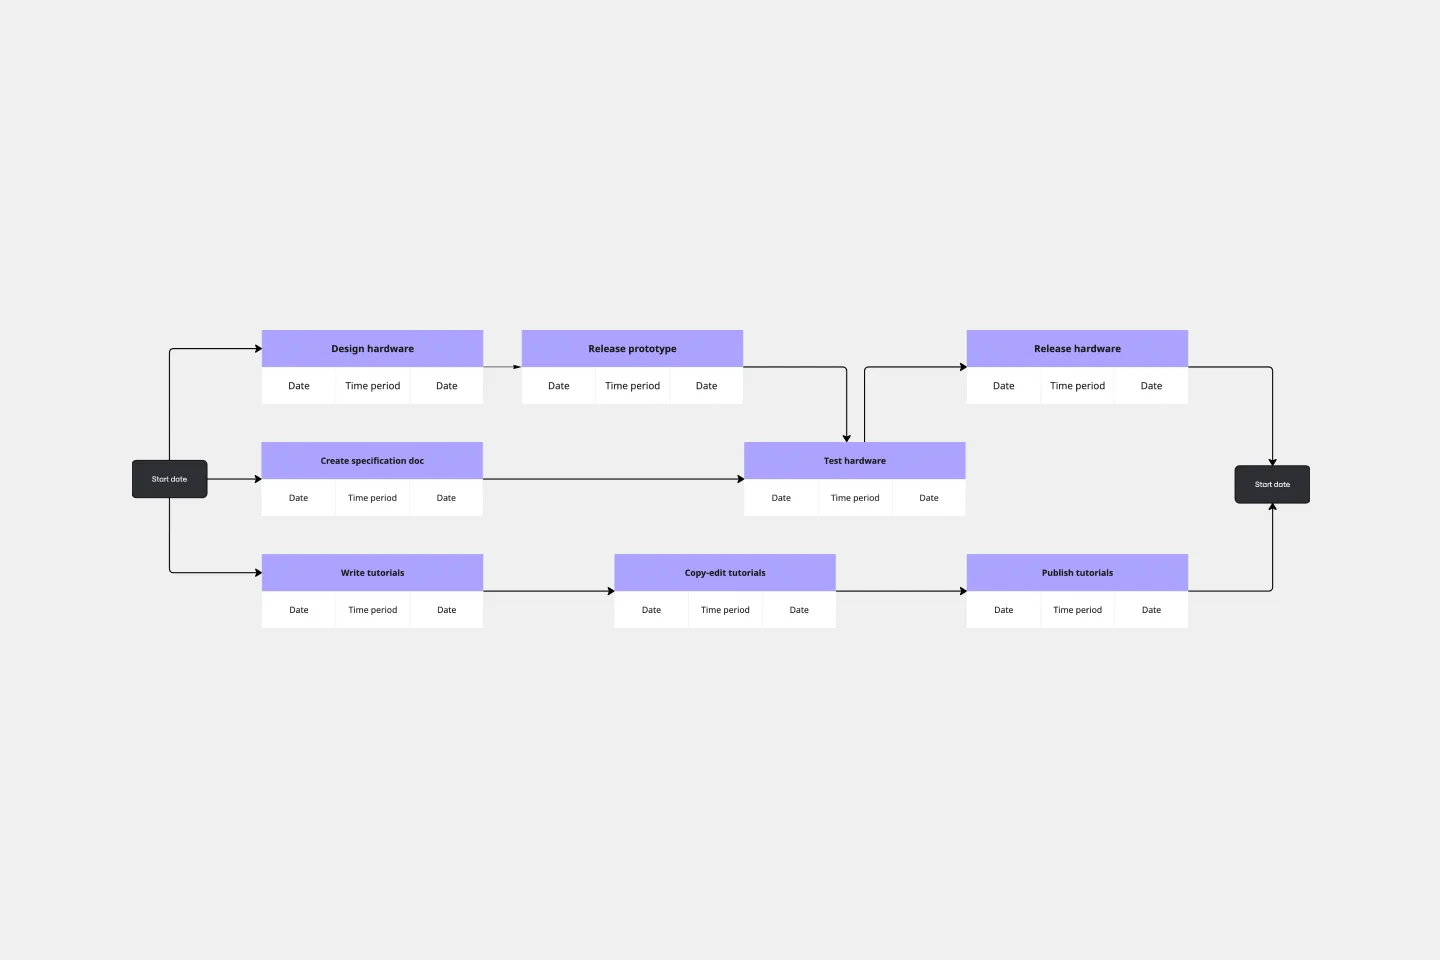
A PERT (Program Evaluation and Review Technique) chart is a network diagram that visualizes project tasks, their sequences, dependencies, and the critical path. It helps plan timelines by mapping all activities needed to complete a project and identifying which tasks directly impact the final deadline.
Who Can Use It
Project managers coordinating multi-phase initiatives
Team leaders managing cross-functional workflows
Operations planners optimizing resource allocation
Construction managers scheduling complex builds
Product developers tracking development milestones
Event coordinators managing interdependent activities
Filling Instructions
Add Task Nodes: Create boxes for each project activity with unique identifiers
Estimate Durations: Include three time estimates per task - optimistic, most likely, and pessimistic
Connect Dependencies: Draw arrows between nodes showing which tasks must finish before others start
Label Milestones: Mark key decision points or deliverables
Identify Critical Path: Highlight the longest sequence of dependent tasks that determines minimum project completion time
Cheers!
Khawaja Rizwan