Activity PERT Chart Template
Overview
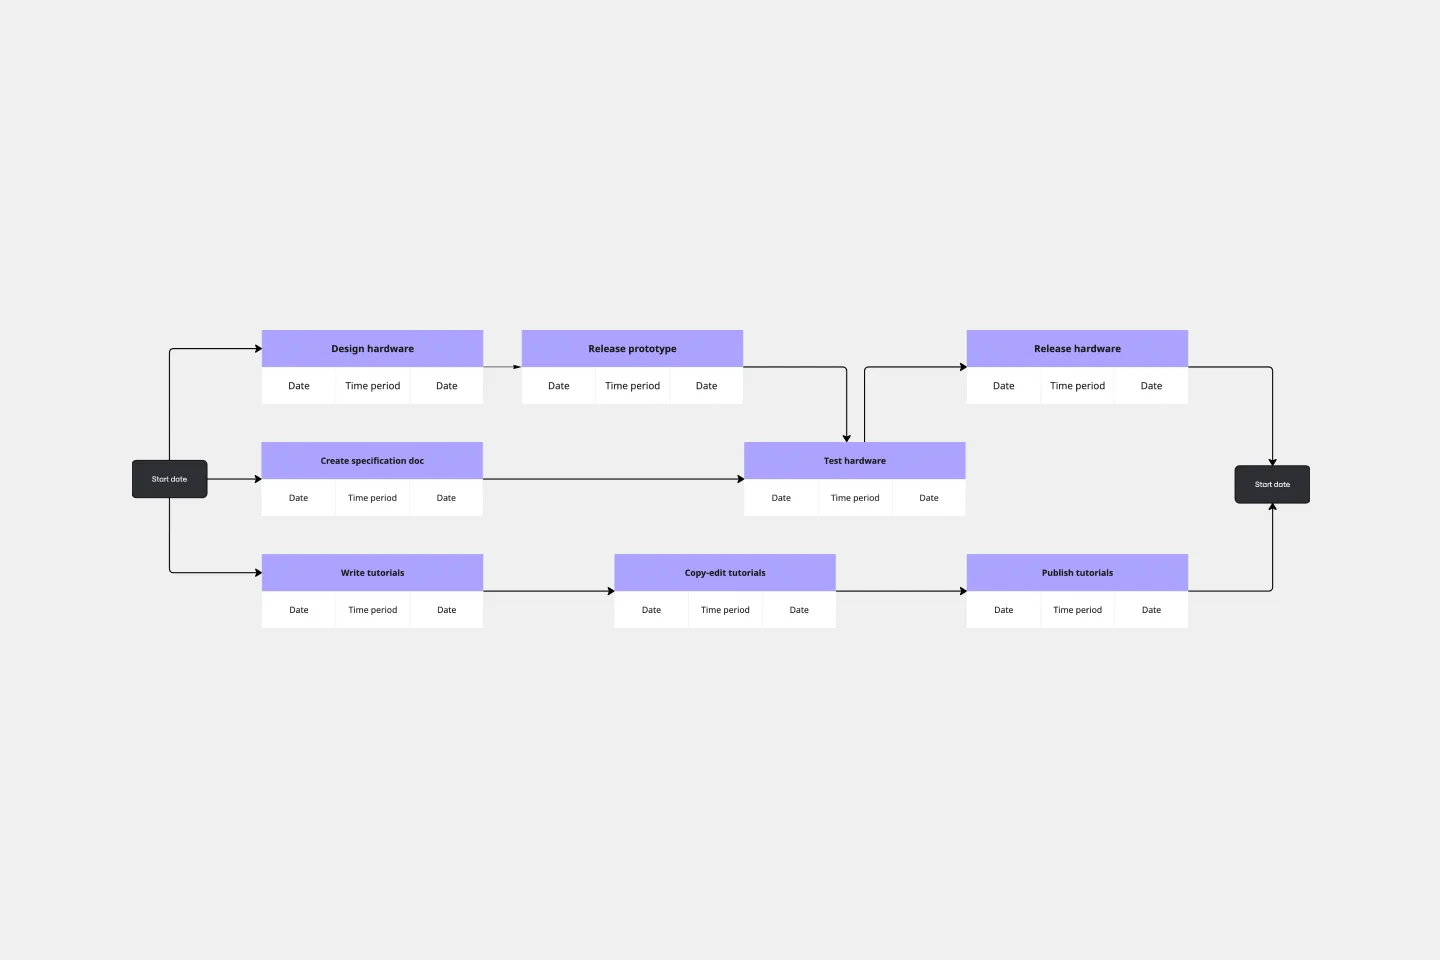
An Activity PERT Chart (Program Evaluation and Review Technique) template provides a visual framework for mapping project activities as interconnected nodes. This tool helps identify task dependencies, sequences, and the critical path that determines your project timeline.
Who Can Use This Template
Project managers coordinating complex initiatives
Team leads planning multi-phase projects
Operations managers scheduling sequential workflows
Product development teams mapping dependencies
Event planners organizing interdependent activities
Construction managers planning build sequences
Software teams scheduling sprint deliverables
How to Fill Out This Template
Step 1: List Activities
Identify all tasks required to complete your project. Break down the project into discrete, manageable activities.
Step 2: Create Activity Nodes
Add a node (circle or box) for each activity. Label each node with the activity name and a unique identifier.
Step 3: Add Time Estimates
For each activity, include duration estimates:
Optimistic time (best-case scenario)
Most likely time (realistic estimate)
Pessimistic time (worst-case scenario)
Step 4: Define Dependencies
Draw connecting lines between nodes to show which activities must finish before others can start. Use arrows to indicate direction of flow.
Step 5: Arrange the Flow
Position nodes to show the logical sequence from project start to completion. Place the starting activity on the left and the final activity on the right.
Step 6: Show Parallel Activities
Create separate branches for tasks that can occur simultaneously. This reveals opportunities for time savings.
Step 7: Identify the Critical Path
Calculate the longest path through your network by adding up durations. Highlight this path—it represents the minimum time needed to complete the project.
Step 8: Mark Milestones
Add milestone markers for key decision points, major deliverables, or phase completions.
Step 9: Assign Ownership
Note the person or team responsible for each activity within or near each node.
Tips for Success
Start simple and add complexity as needed
Update the chart as project conditions change
Use color coding to distinguish activity types or priority levels
Review the critical path regularly to monitor project health
Cheers!
Khawaja Rizwan