The 3 Set Venn Diagram is a simple visual tool for comparing three topics, groups, ideas, products, concepts, or categories. It helps you identify unique characteristics, shared features, and relationships between multiple elements at the same time.
Use it to organise information, uncover patterns, and explore similarities and differences in a clear and engaging way.
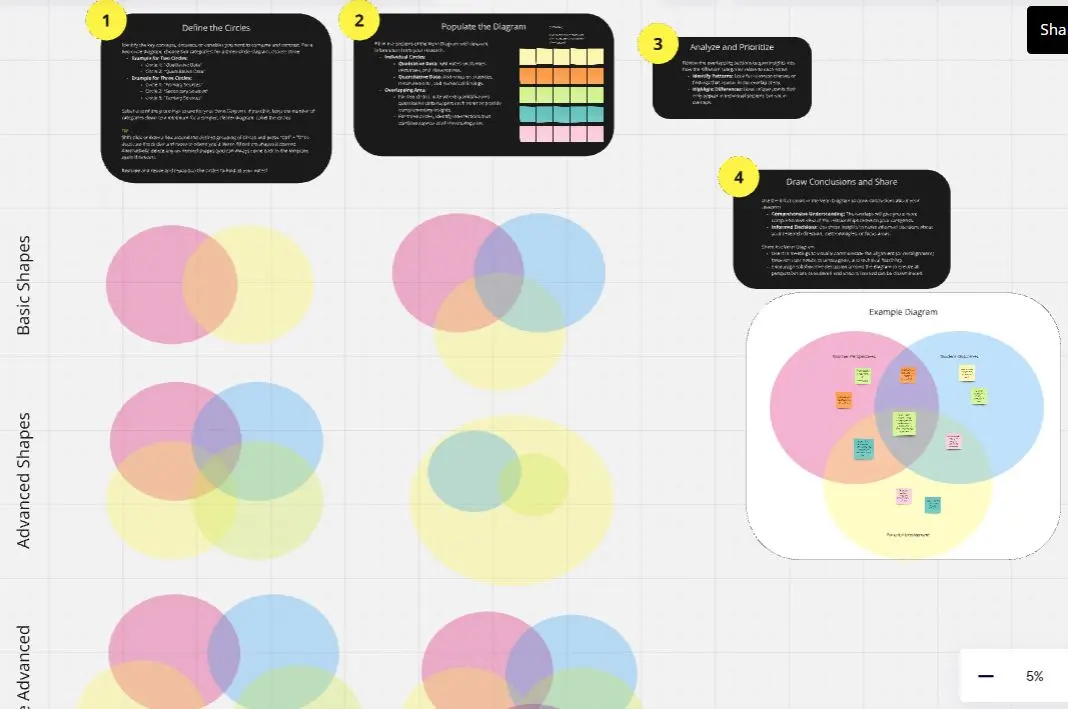
How to use it
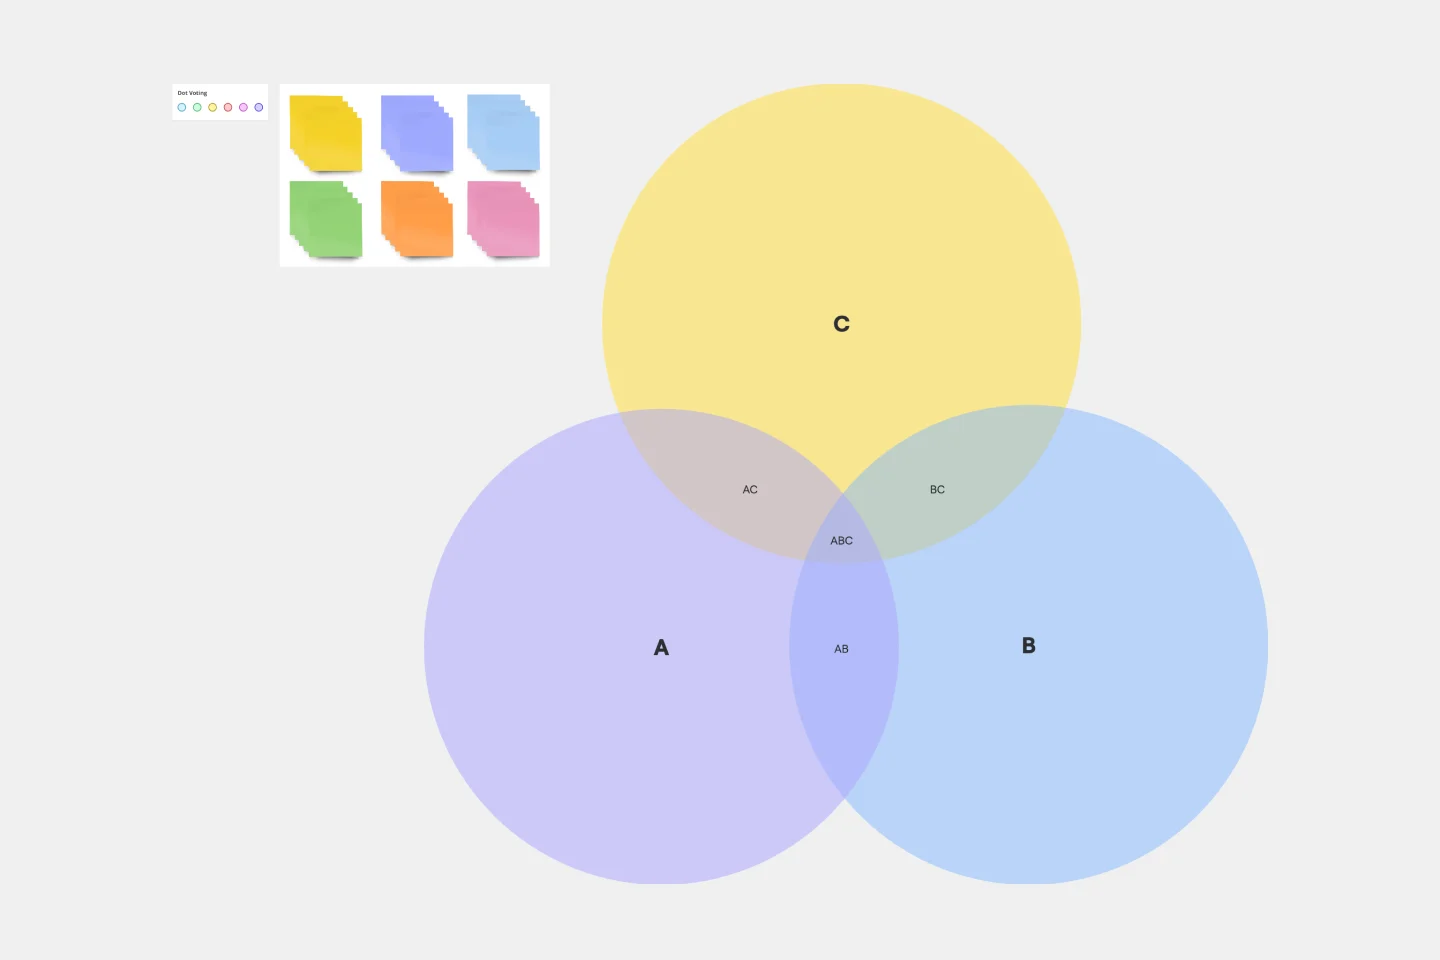
Assign a topic to each of the three coloured sections.
Add unique characteristics to the non-overlapping areas.
Use the overlapping sections to capture similarities, shared attributes, or connections.
Record observations, insights, and key takeaways in the supporting text areas.
Discuss what the overlaps reveal and what makes each topic distinct.
Workshop suggestion
Time: 15–45 minutes
Compare products, services, customer groups, competitors, stakeholders, ideas, or strategies.
Work individually or in teams using sticky notes.
Discuss similarities, differences, and opportunities revealed by the overlaps.
Summarise key insights and next steps.
Who can use it?
Teams and organisations
Students and educators
Consultants and facilitators
Researchers and analysts
Entrepreneurs and innovators
Anyone exploring relationships between multiple concepts
What should you consider?
✓ Clearly define each topic before starting.
✓ Focus on the most important characteristics and relationships.
✓ Use the overlap areas to identify common ground and opportunities.
✓ Keep information concise and easy to compare.
What’s the output?
✓ A visual comparison of three topics or concepts
✓ Greater understanding of similarities and differences
✓ Identified patterns, overlaps, and relationships
✓ Insights that support learning, decision-making, problem-solving, and innovation