About our Gantt chart templates
Miro's collection of Gantt chart templates is your go-to for visual project planning. Each template is crafted to help you organize with ease, offering a vibrant timeline that sharpens your view of project tasks and deadlines. With these templates, planning project phases, tracking progress, and adapting to shifts become second nature. Think of our collection as your partner in fostering a more structured, collaborative, and effective project management experience.
The "Critical Path" Audit: 3 Ways to Build a Resilient Gantt Chart
A Gantt chart is more than a bar graph; it is a mathematical model of your project’s success. To move from a basic schedule to a professional-grade roadmap, apply these three expert "health checks" to your Miro board:
1. The "Critical Path" Analysis
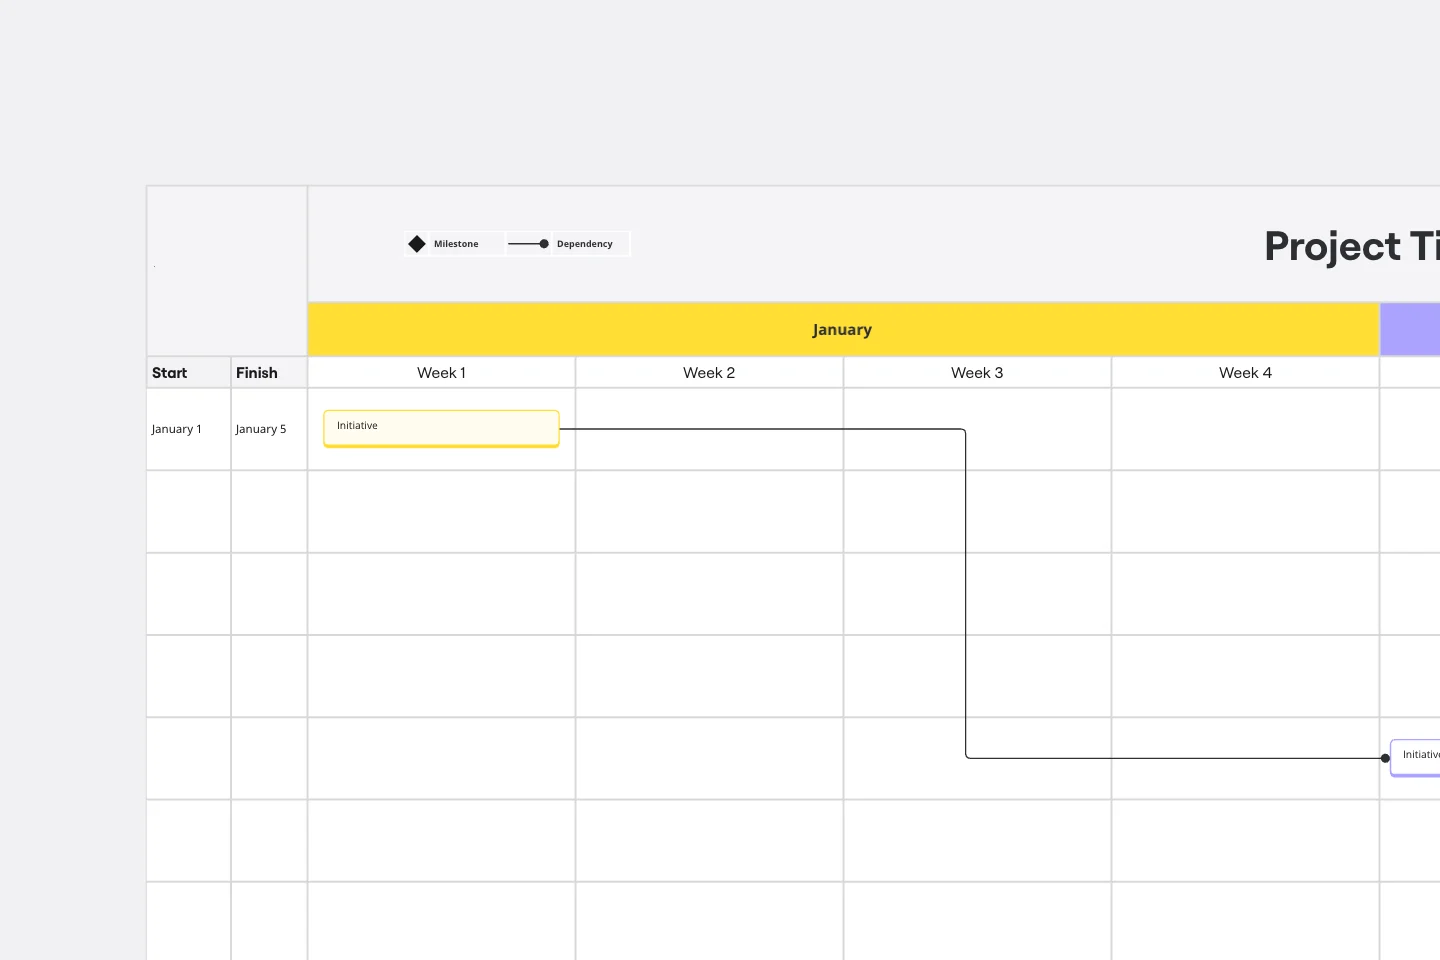
The Audit: Can you immediately identify which tasks, if delayed by 24 hours, will push back the entire project's launch date? The Fix: Use Miro’s connection lines to highlight your Critical Path. These are the tasks with "zero float." By visually distinguishing these from non-essential tasks, you help your team understand where they cannot afford to slip.
2. Eliminating "Dependency Deadlocks"
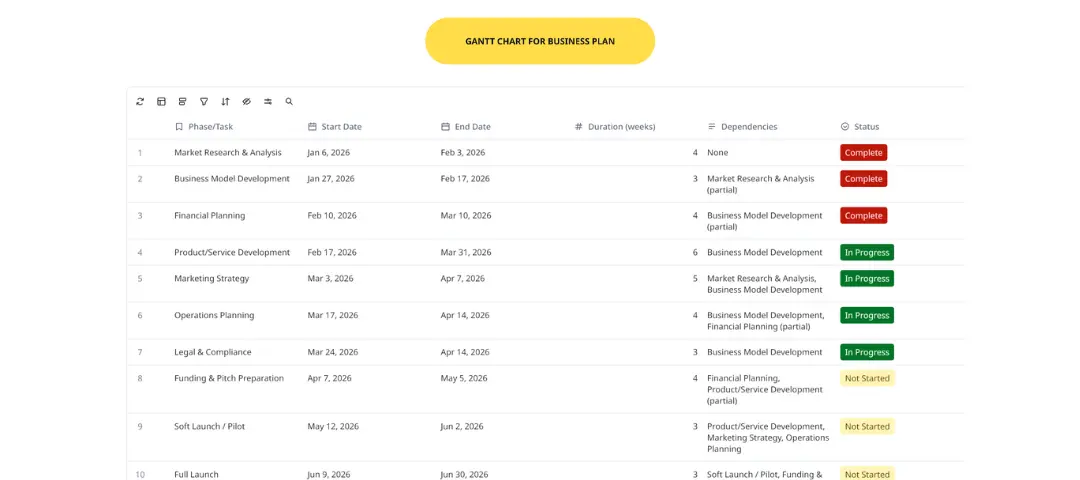
The Audit: Are your tasks connected in a way that creates a loop or an impossible sequence? The Fix: Audit your Finish-to-Start (FS) and Start-to-Start (SS) dependencies. A common mistake is overloading a single team member with five simultaneous "Start-to-Start" tasks. Use your Gantt chart to "stagger" these bars, ensuring that human capacity matches the visual timeline.
3. The "Granularity Gap" Test
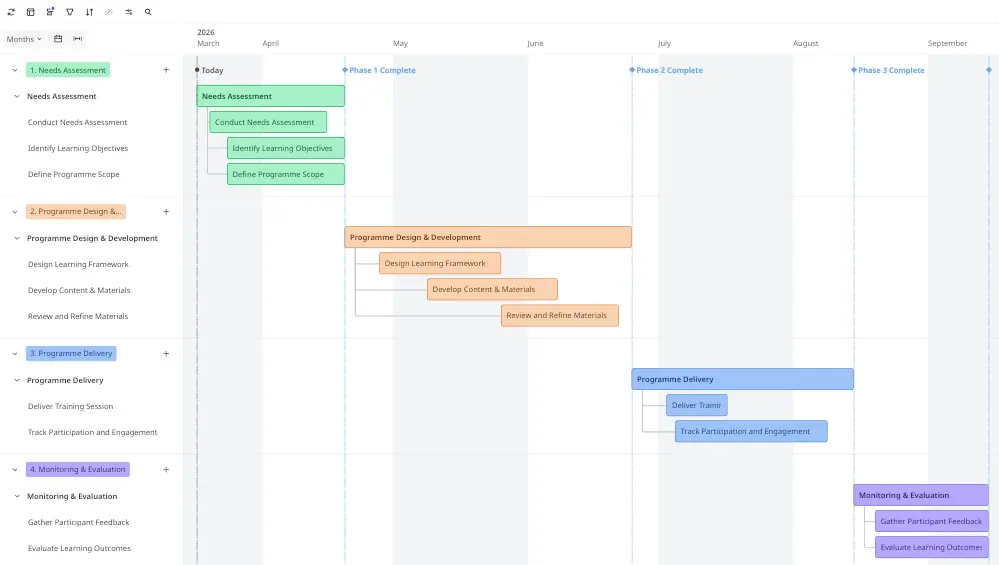
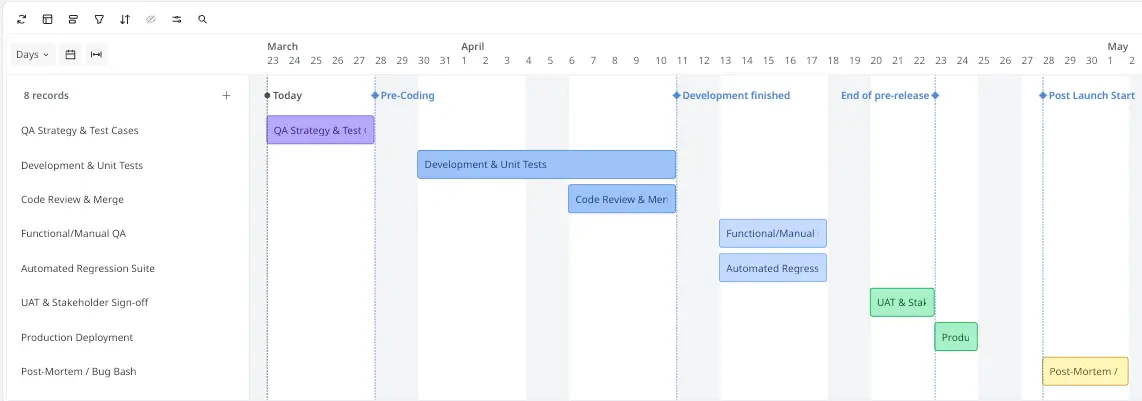
The Audit: Are your task bars too long (e.g., a single 4-week bar for "Development")? The Fix: If a task bar is longer than 5 days, it’s a "black box." Break large tasks into smaller sub-tasks. This allows you to track progress incrementally and provides more frequent "wins" for the team as they complete smaller sections of the Gantt chart.
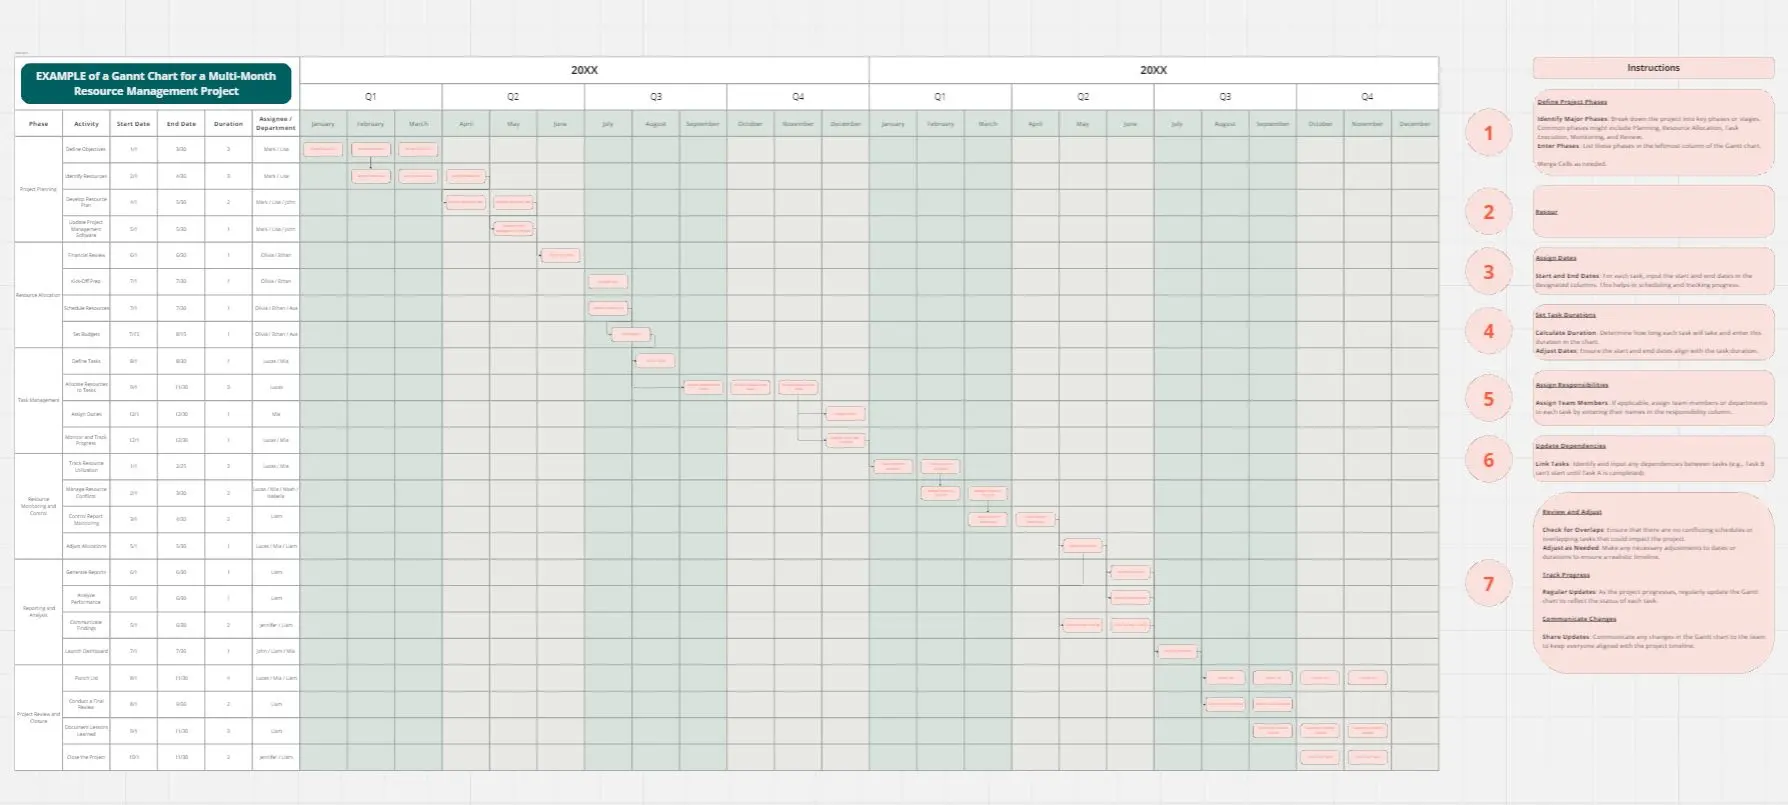
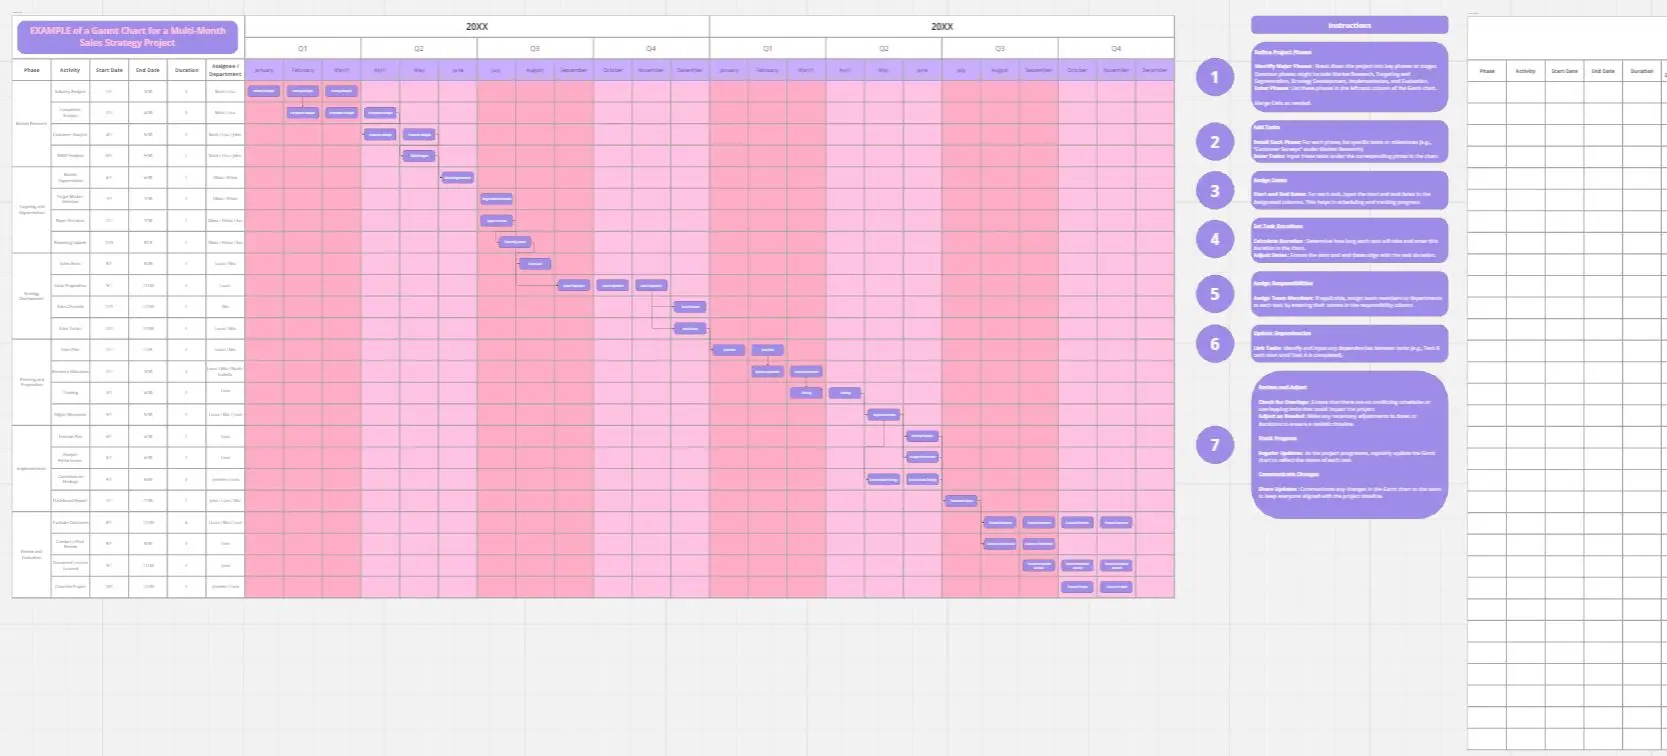
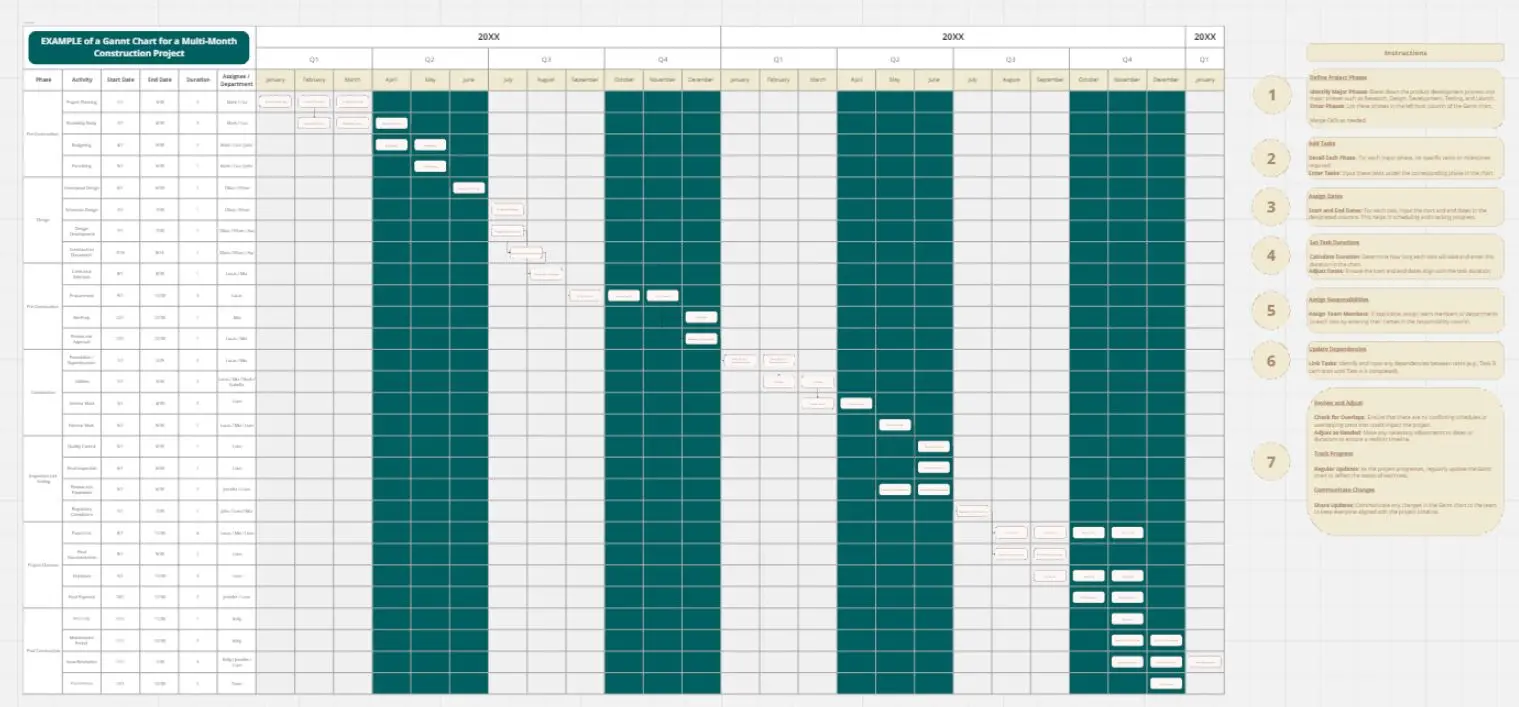
Why you’ll love our Gantt chart examples
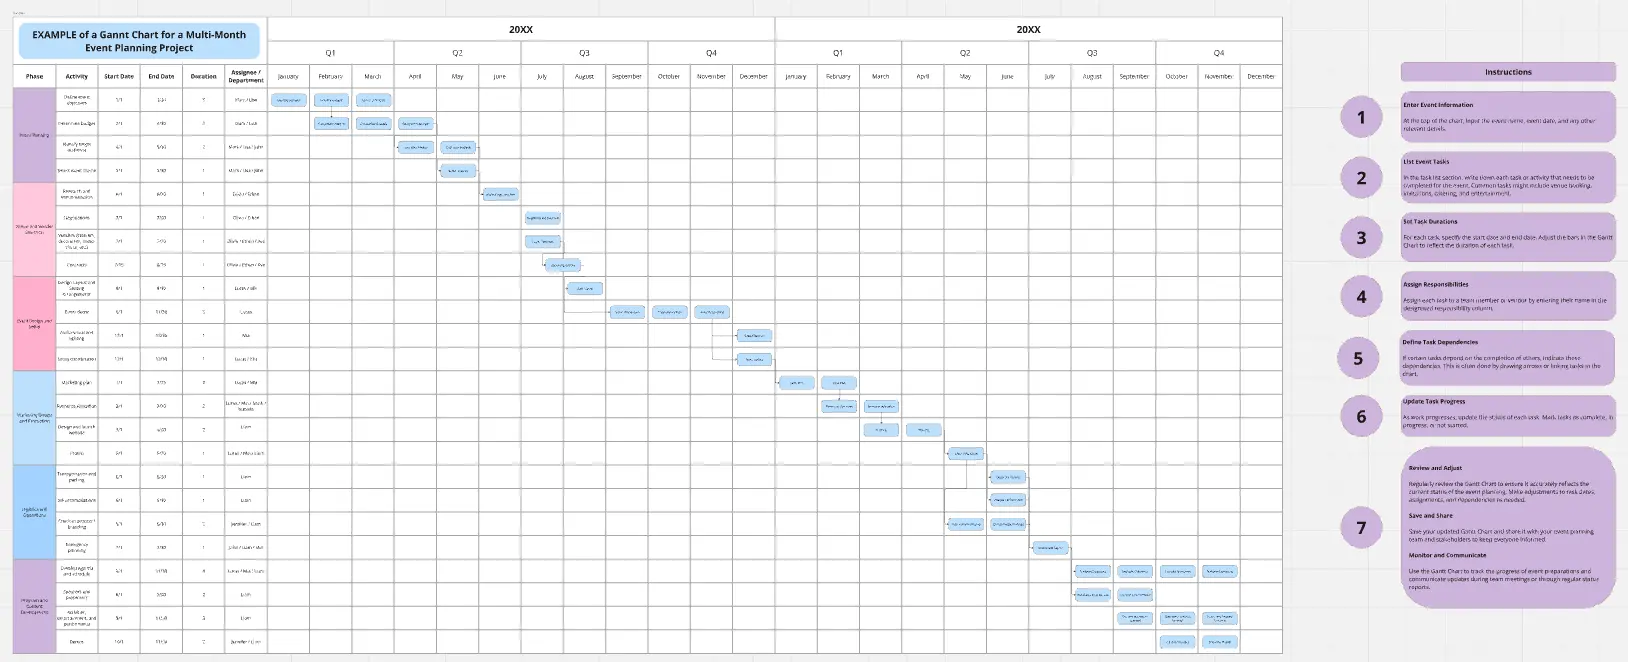
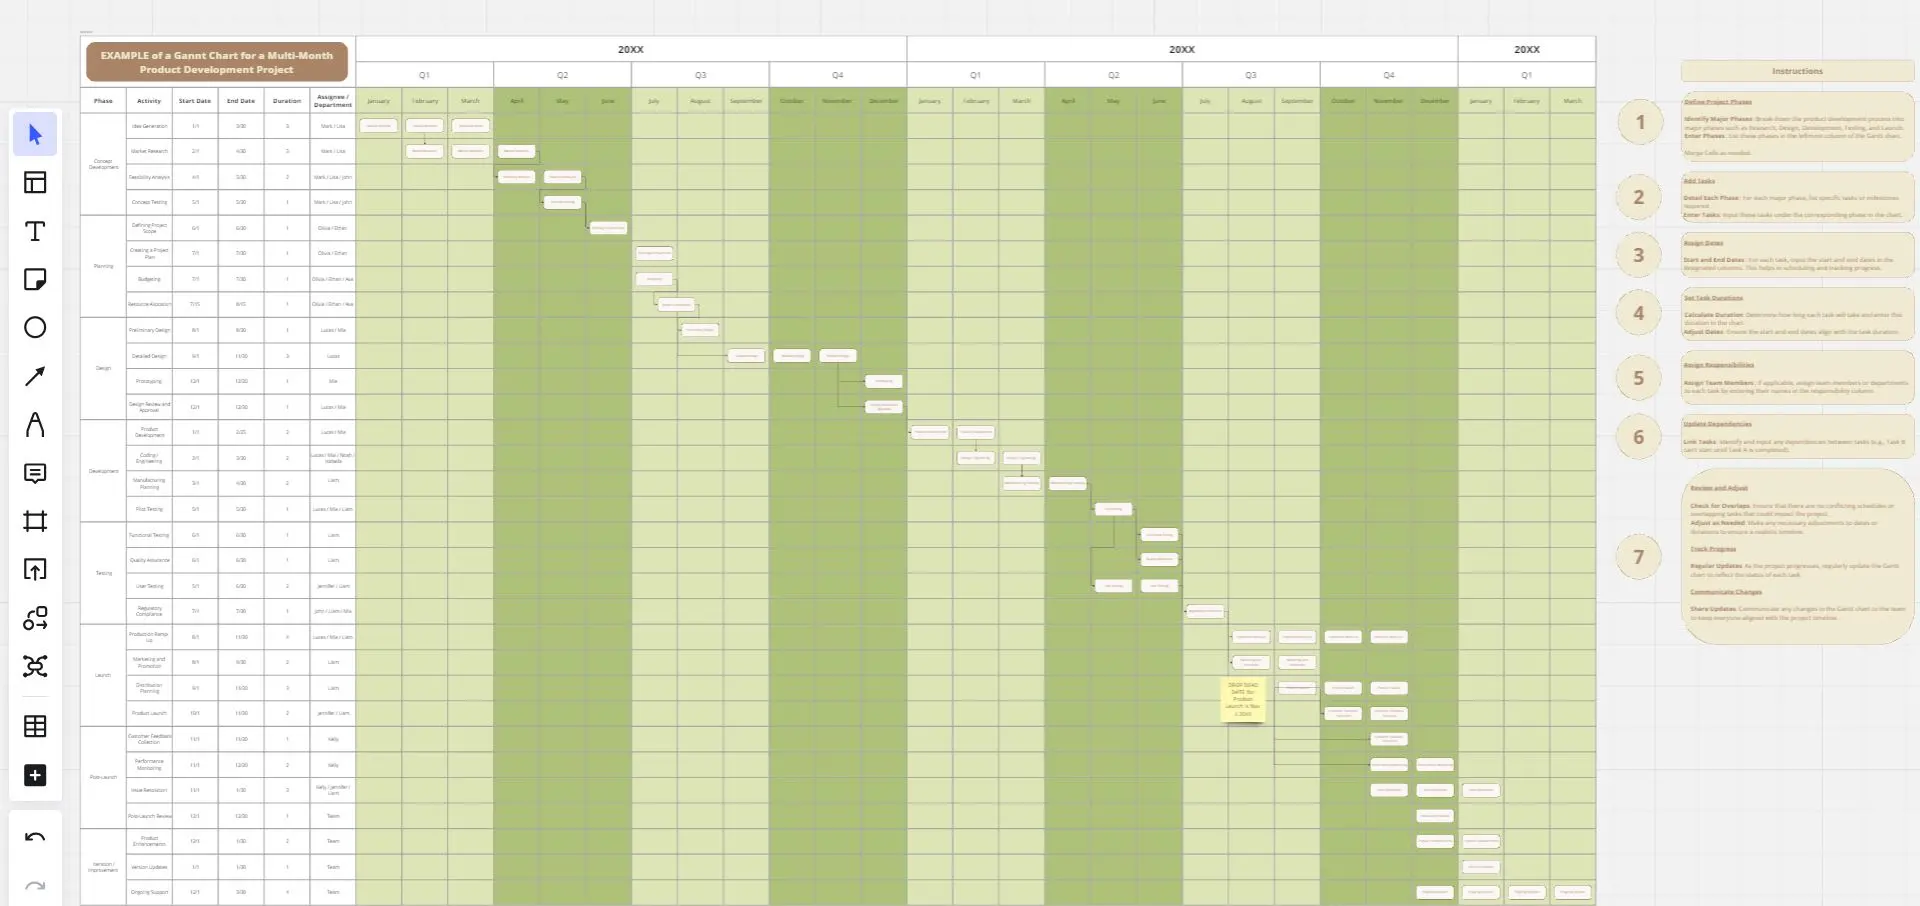
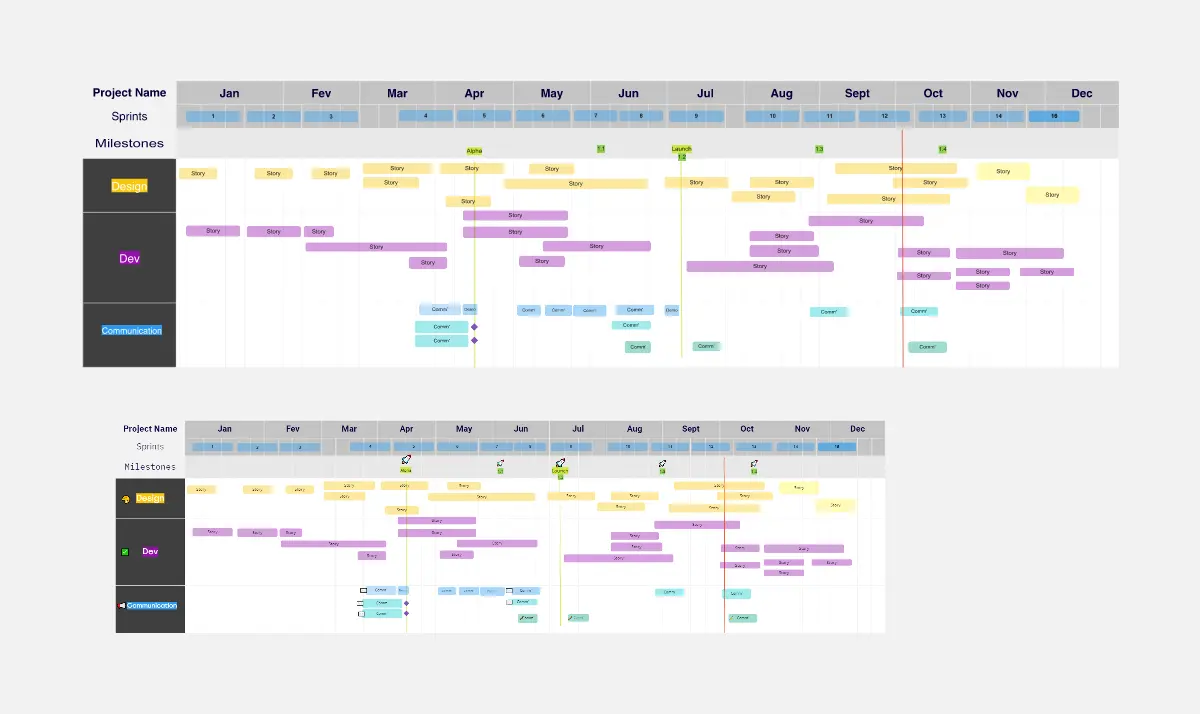
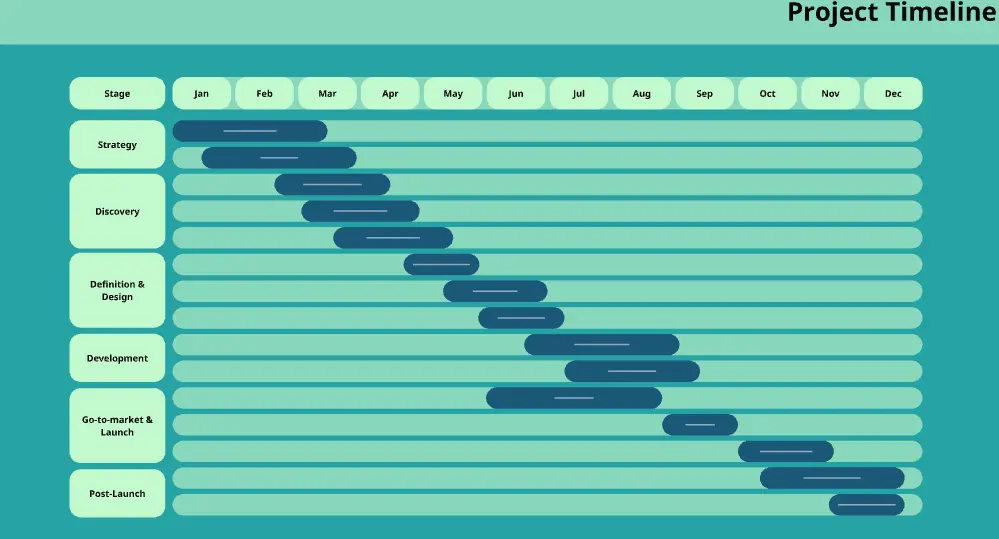
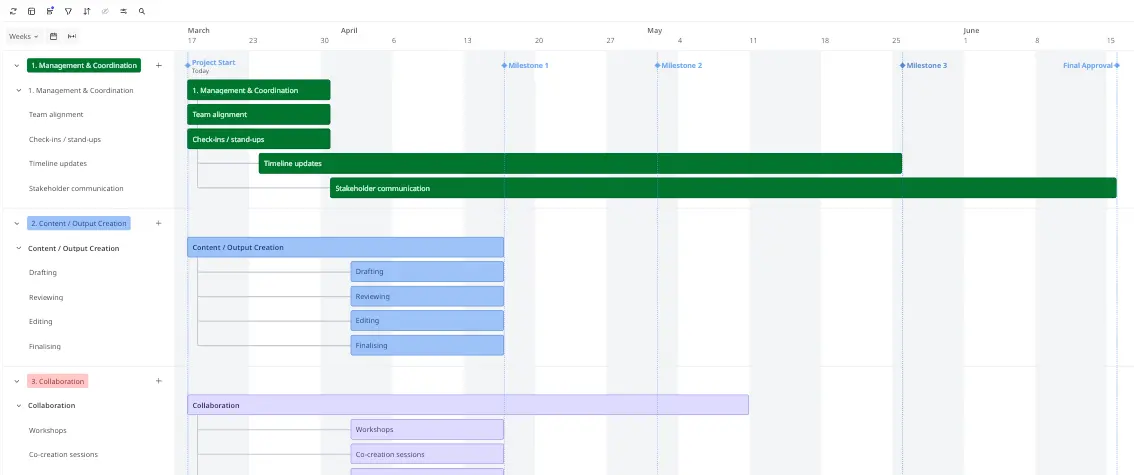
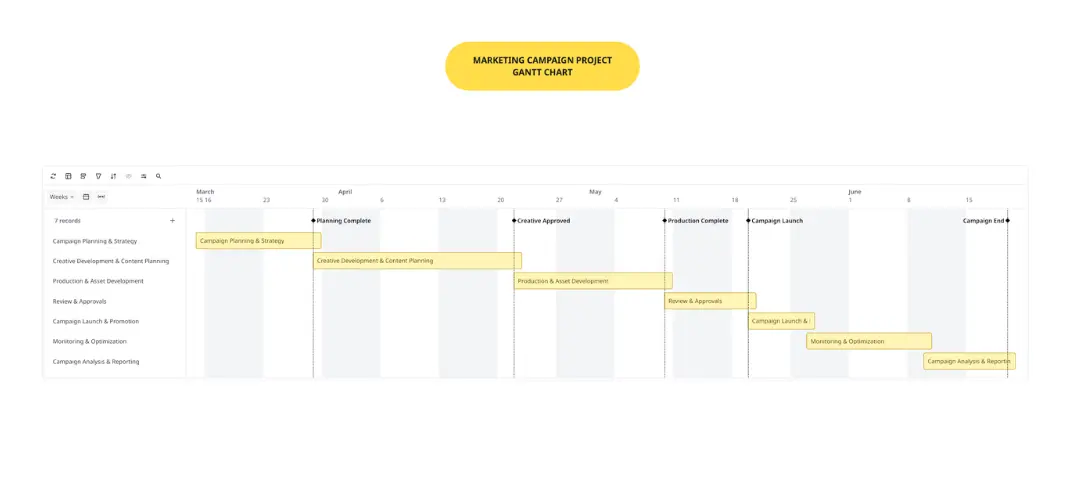
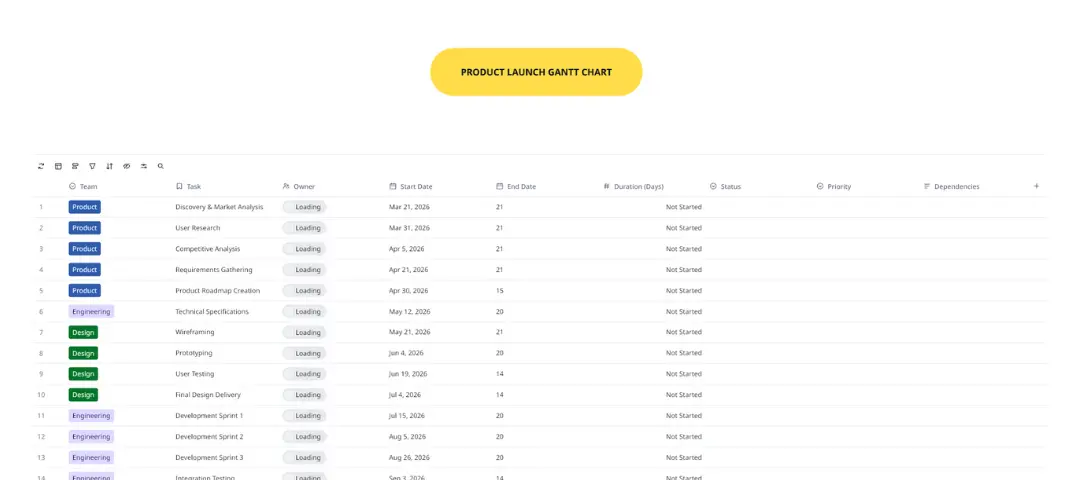
Our Gantt chart examples demonstrate the versatility of our templates, suitable for a wide range of projects and sectors. They offer a clear way to visualize your project's timeline, understand the interdependencies of tasks, and improve team coordination. These examples are more than just templates; they are a visual tool that integrates with your workflow, helping you to navigate your project's development with greater transparency and control.
Effortlessly navigate Miro's Gantt chart template
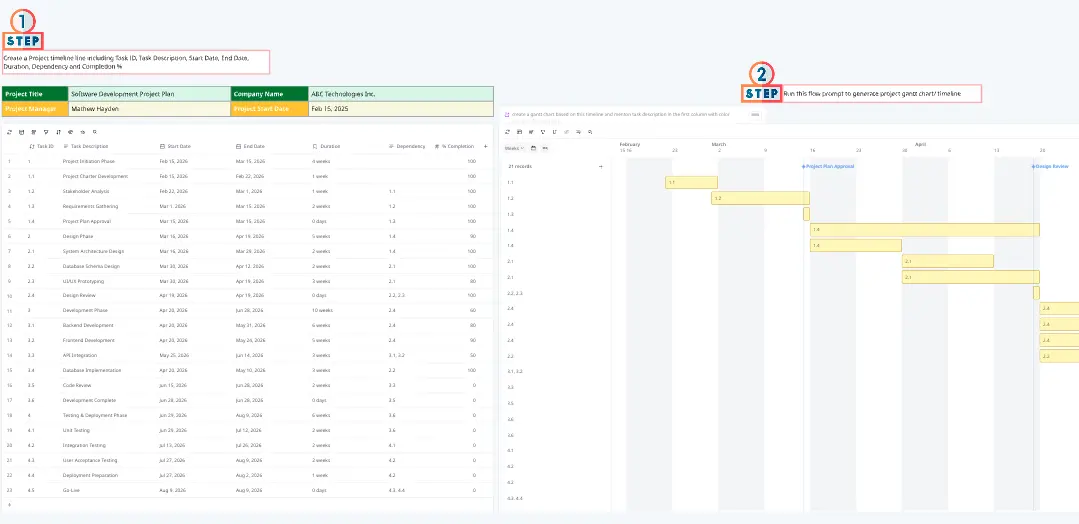
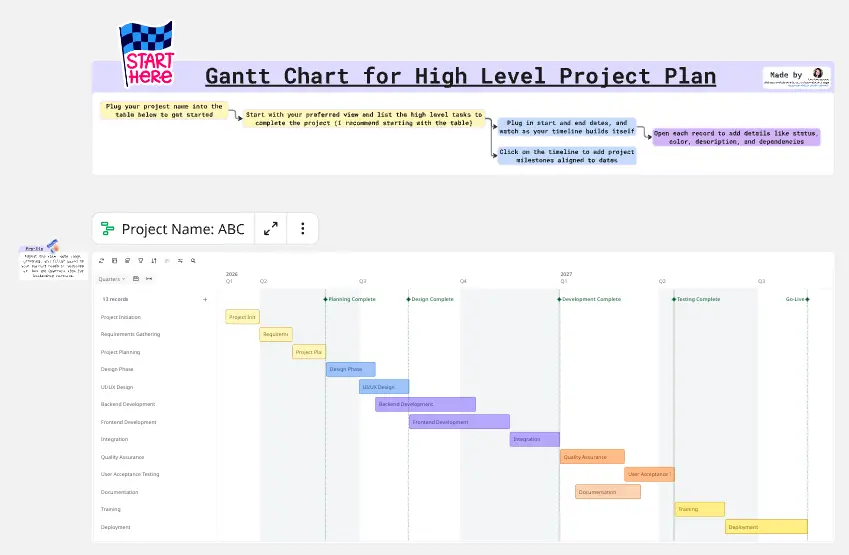
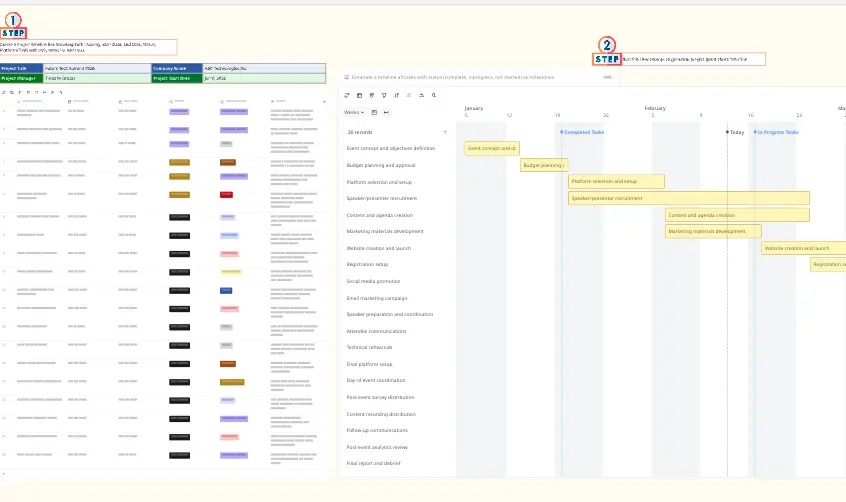
Getting started with a Gantt chart template in Miro is straightforward. Here's a step-by-step guide on how to use the Gantt chart template in Miro:
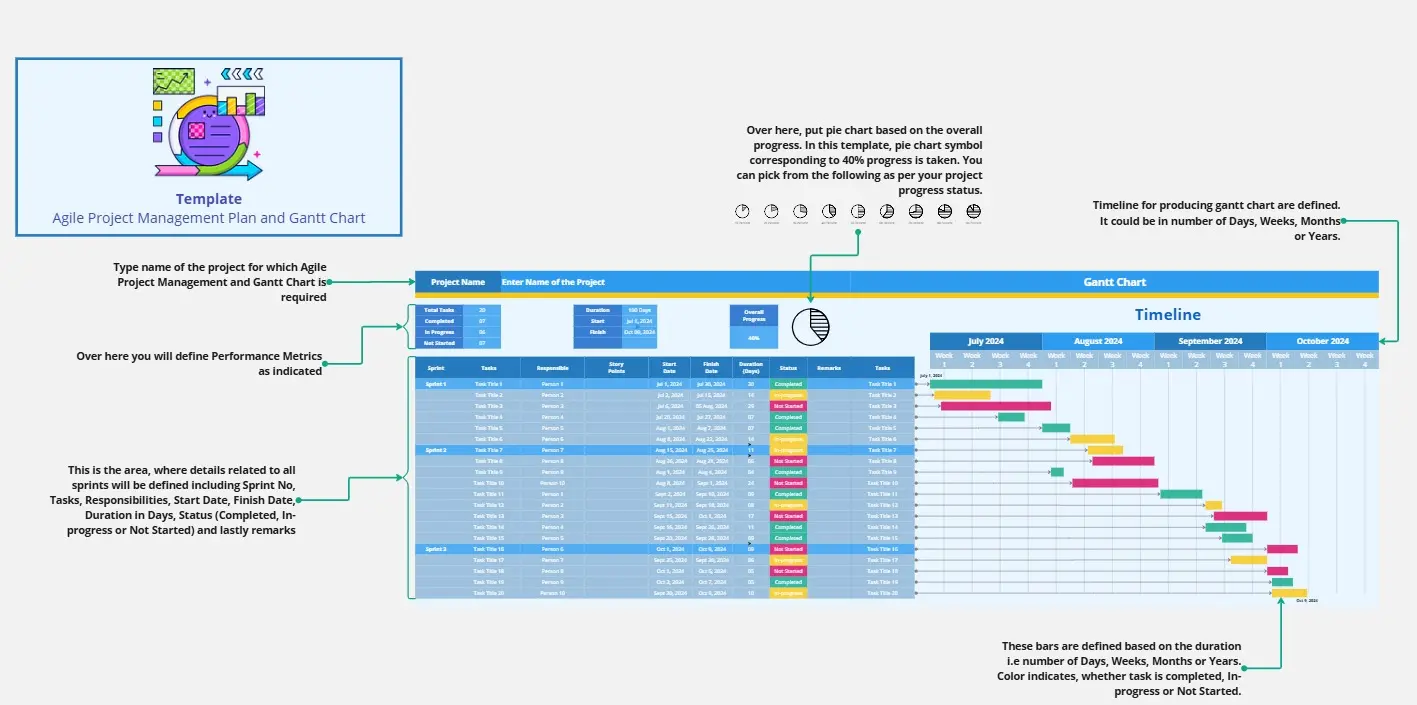
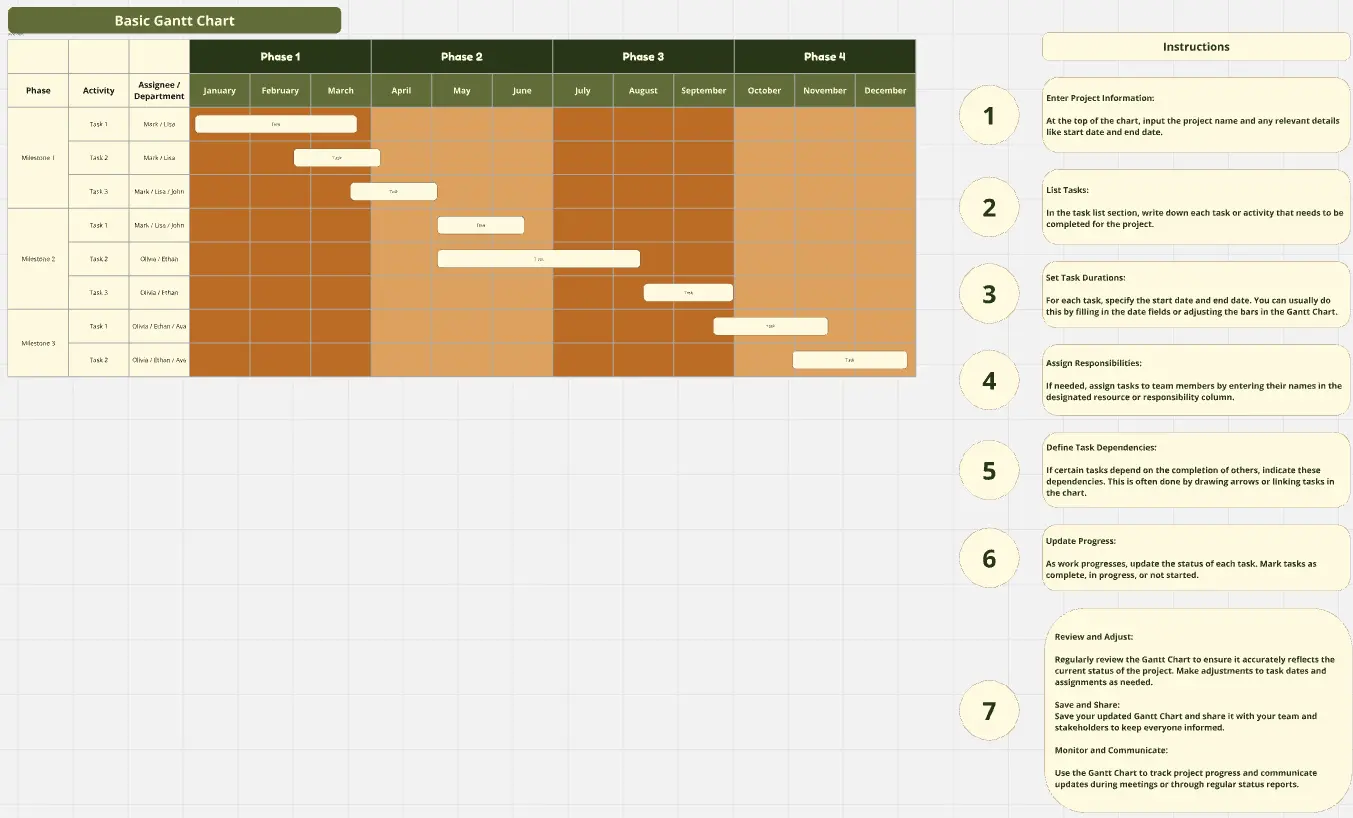
Select the template: Navigate to Miro's template gallery and choose the Gantt chart template that best suits your project's needs.
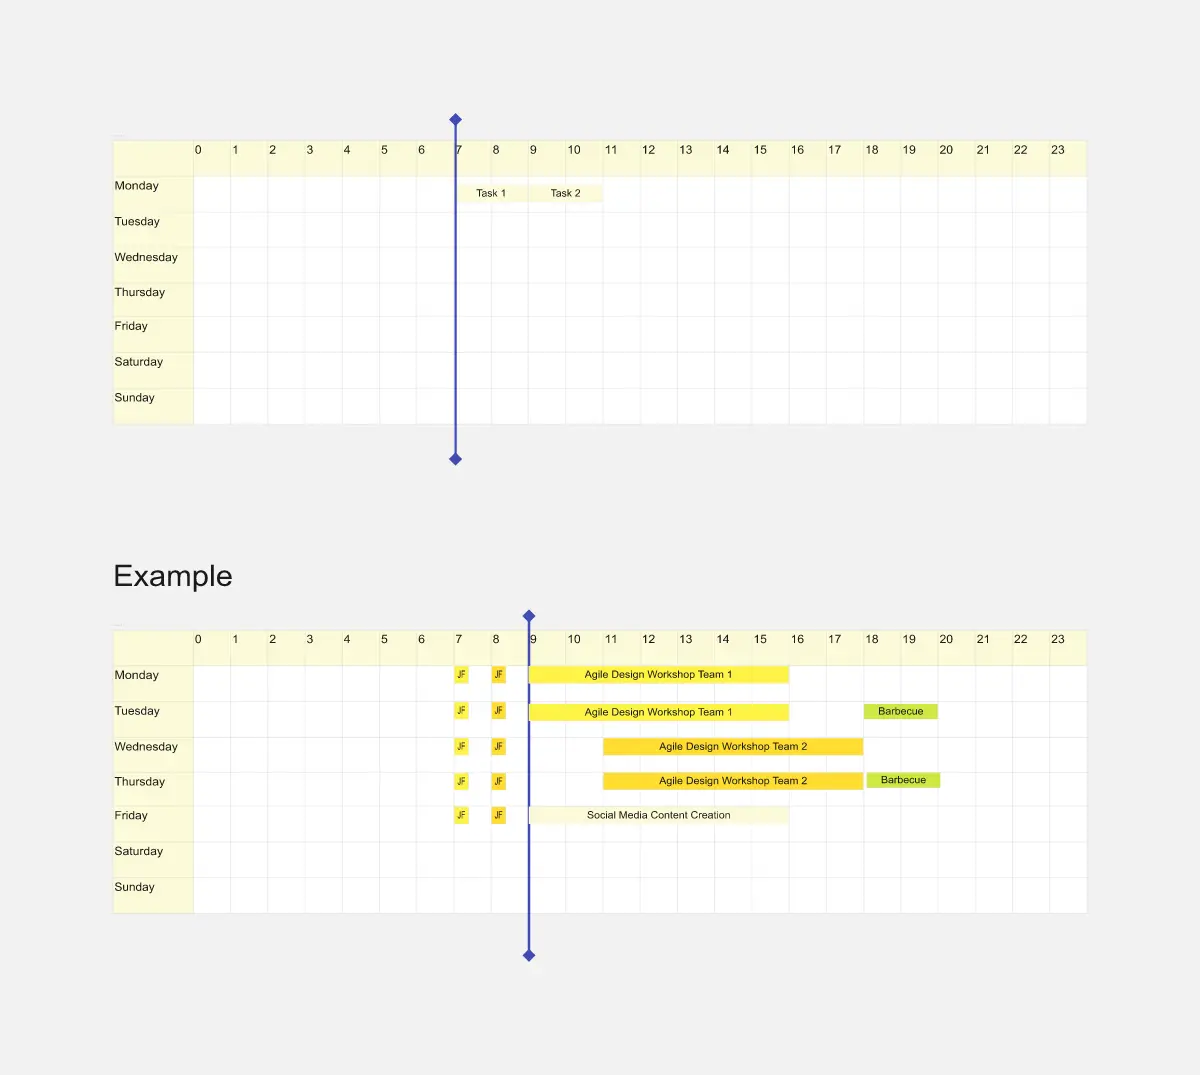
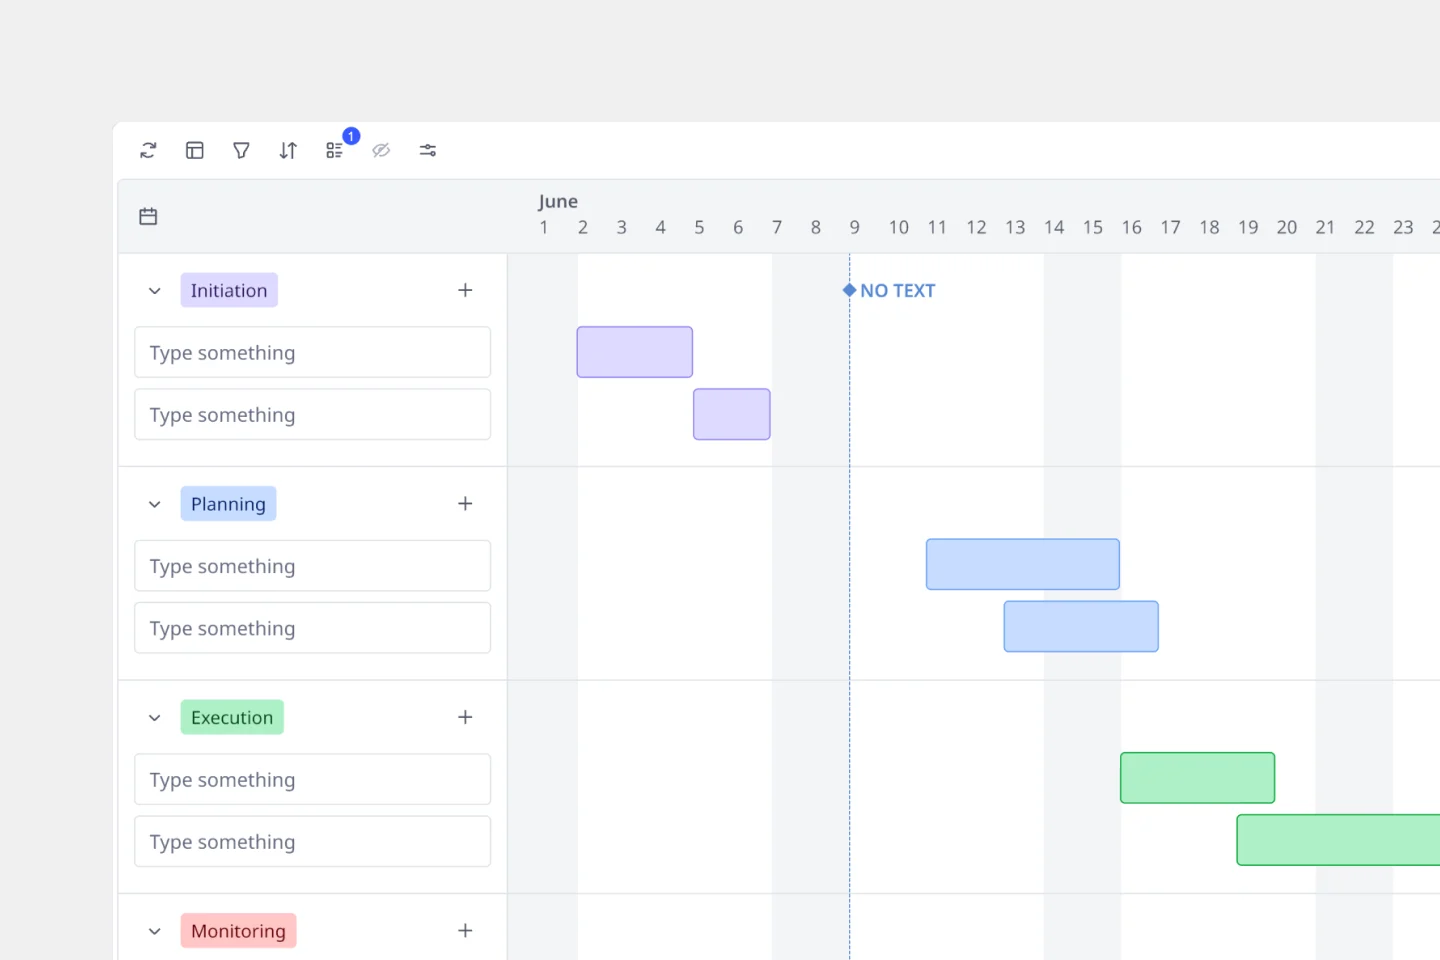
Customize your tasks: Once the template is on your board, add your project tasks. Click on the existing task bars or use the toolbar to add new ones, and then label them accordingly.
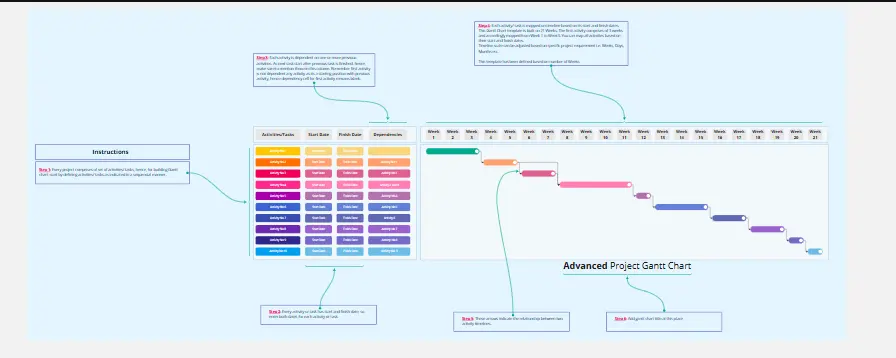
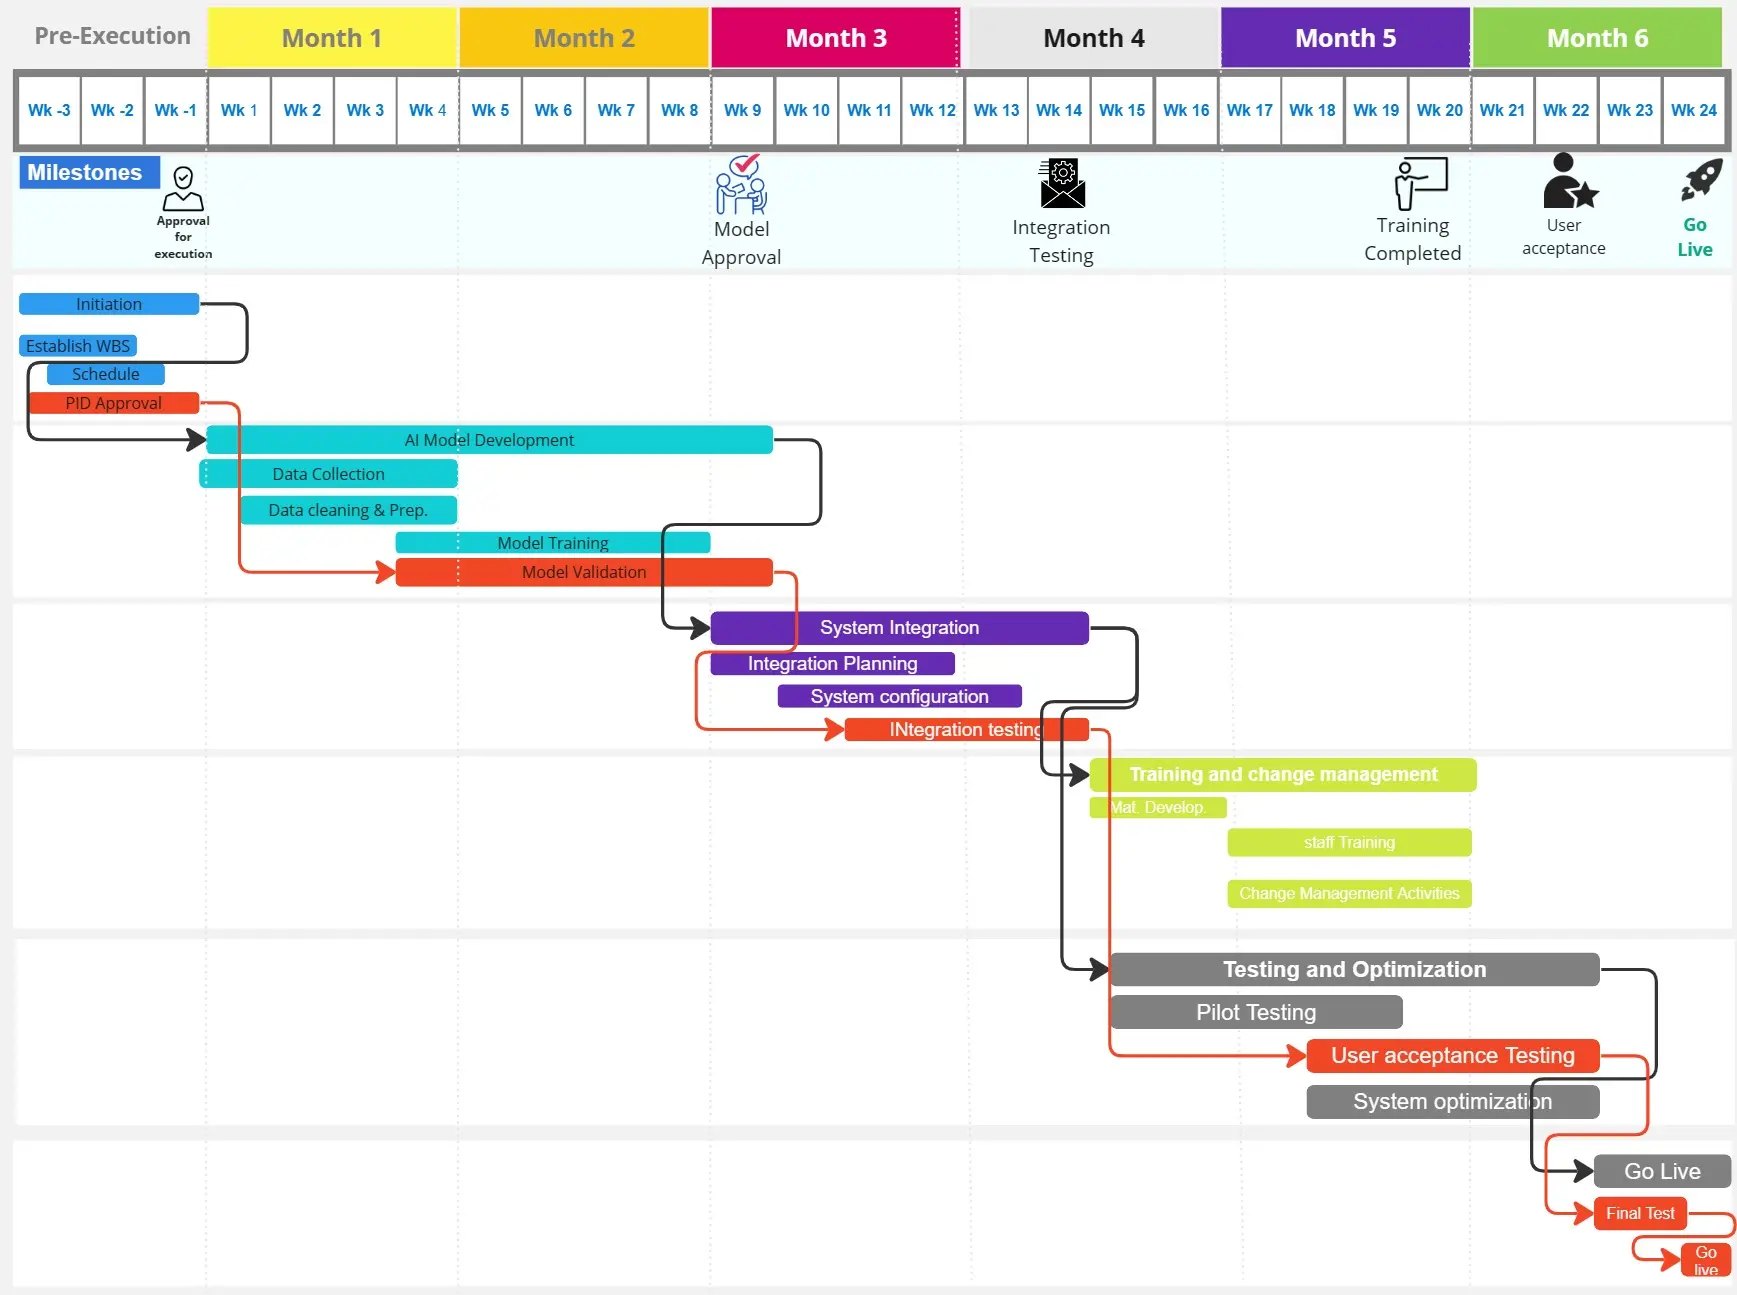
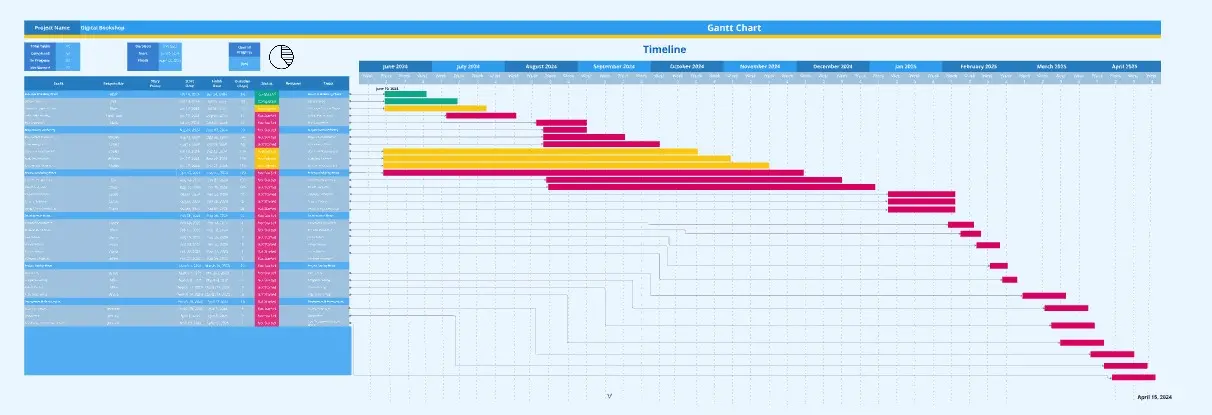
Set start and end dates: For each task, specify the start and end dates. This will automatically adjust the length of the task bar on the Gantt chart to represent the duration of the task.
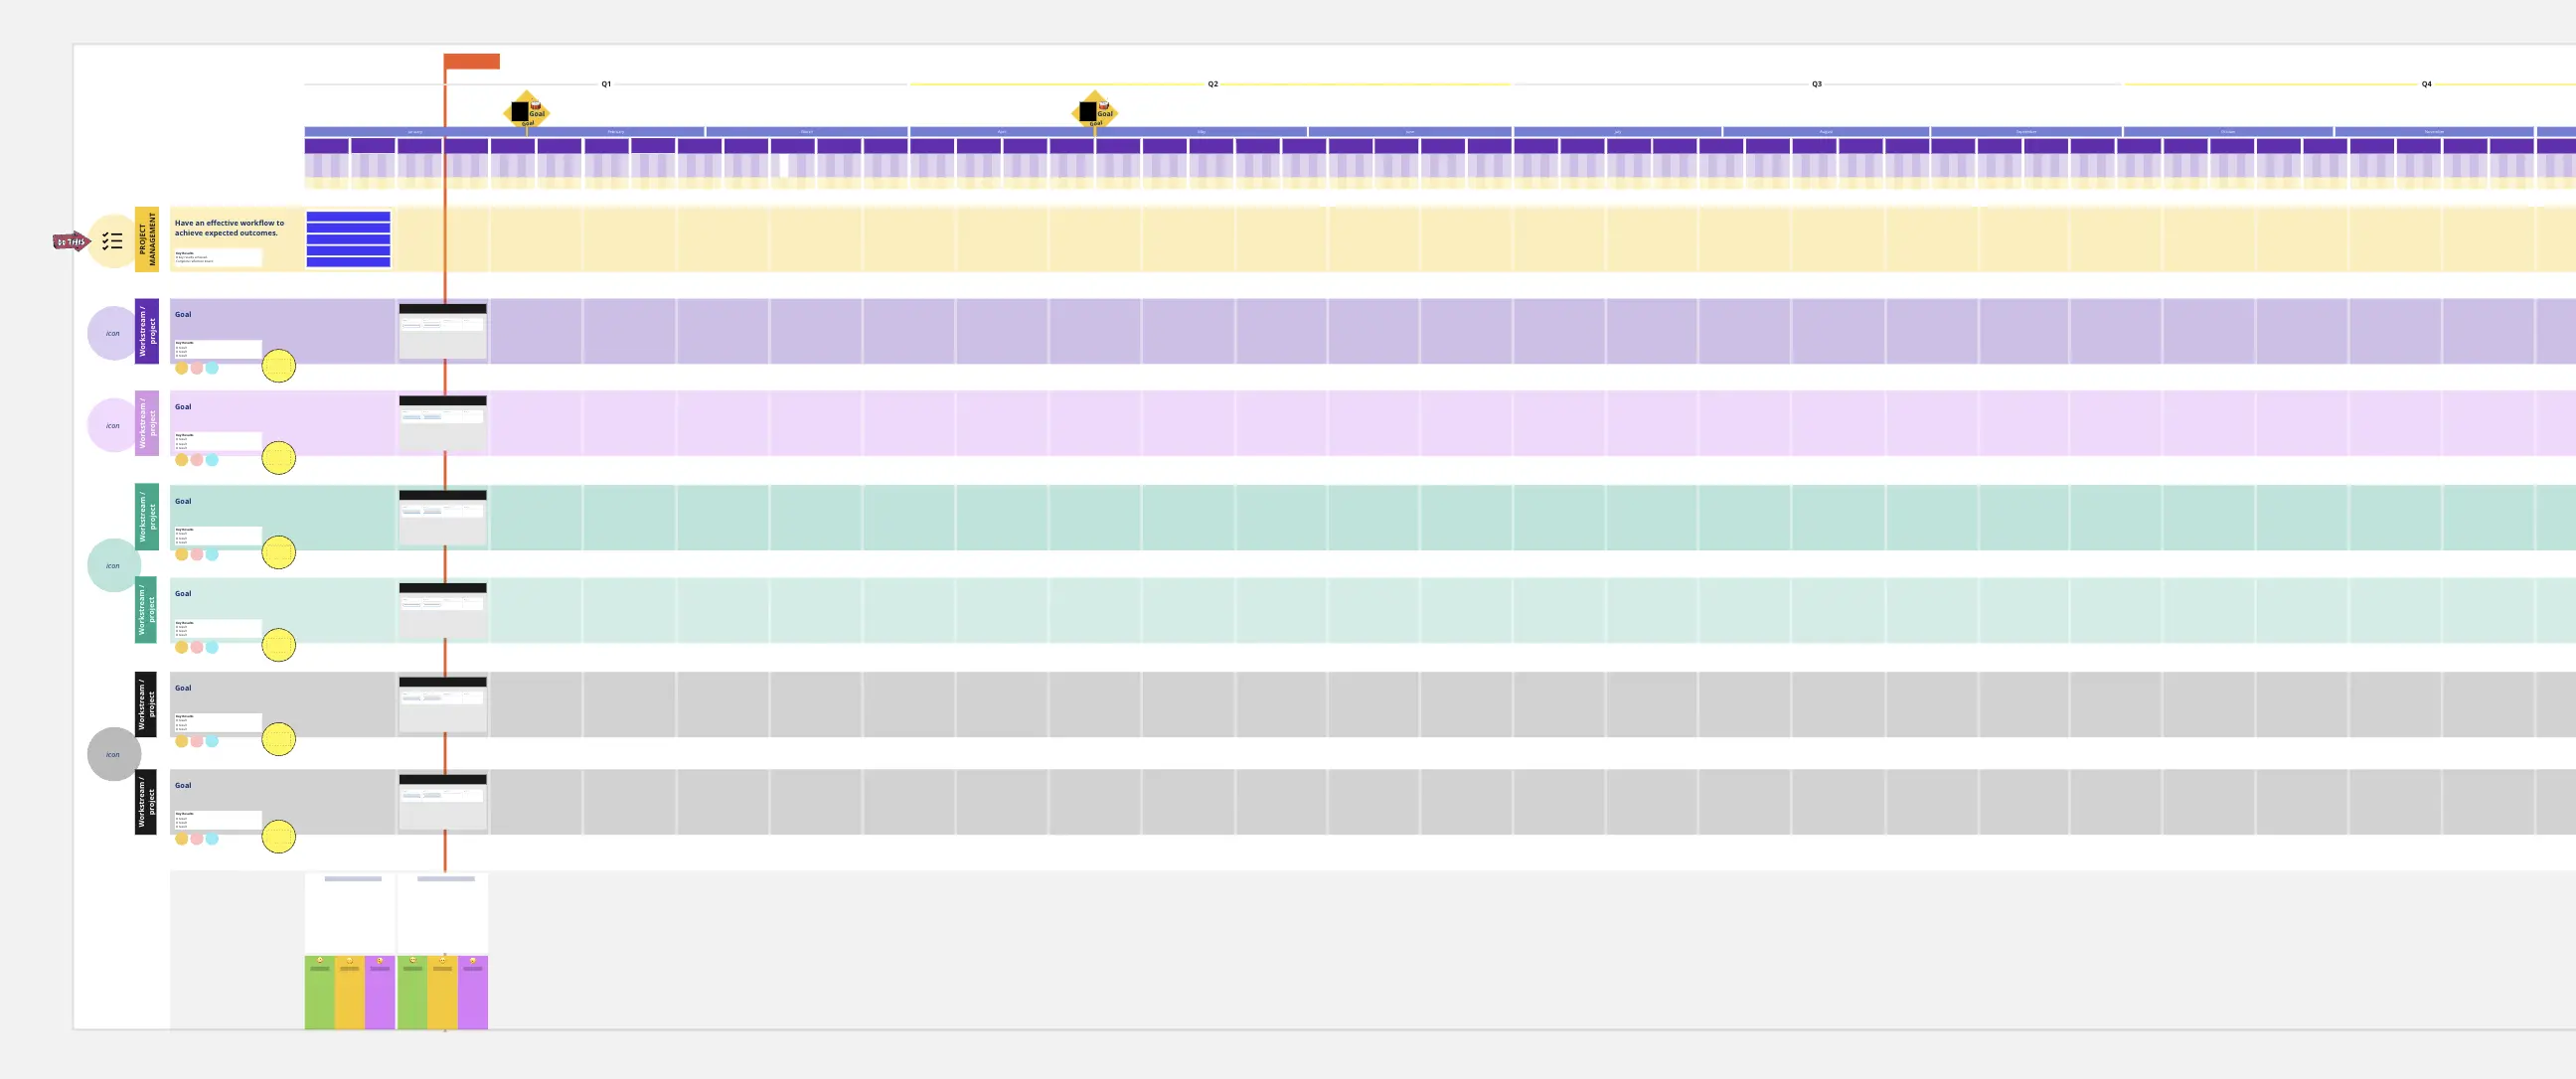
Define milestones: Identify and add key milestones to your project timeline. These are significant checkpoints or goals that mark major progress points.
Establish dependencies: If certain tasks depend on the completion of others, indicate these dependencies by drawing lines or arrows between the related task bars.
Assign tasks: Assign tasks to team members by adding their names or using icons to represent individuals or teams responsible for each task.
Collaborate and share: Share the board with team members and invite them to view or edit the Gantt chart. They can provide real-time input and updates.
Track progress: As your project progresses, update the Gantt chart by moving the task bars or changing their colors to reflect completed activities.
Adjust as needed: If project timelines shift, easily drag and drop task bars to new dates, or extend and shorten them to adjust the task durations.
Review and report: Use the Gantt chart to review project progress during meetings and share updates with stakeholders by exporting the board or presenting it directly from Miro.
Remember, the key to effective Gantt chart management in Miro is regular updates and clear communication with your team.