Staff Resource Planning Template
A structured planning tool for tracking and visualizing staff allocation across departments and time periods. This template helps organizations forecast resource needs, identify staffing gaps, and optimize workforce distribution throughout the year.
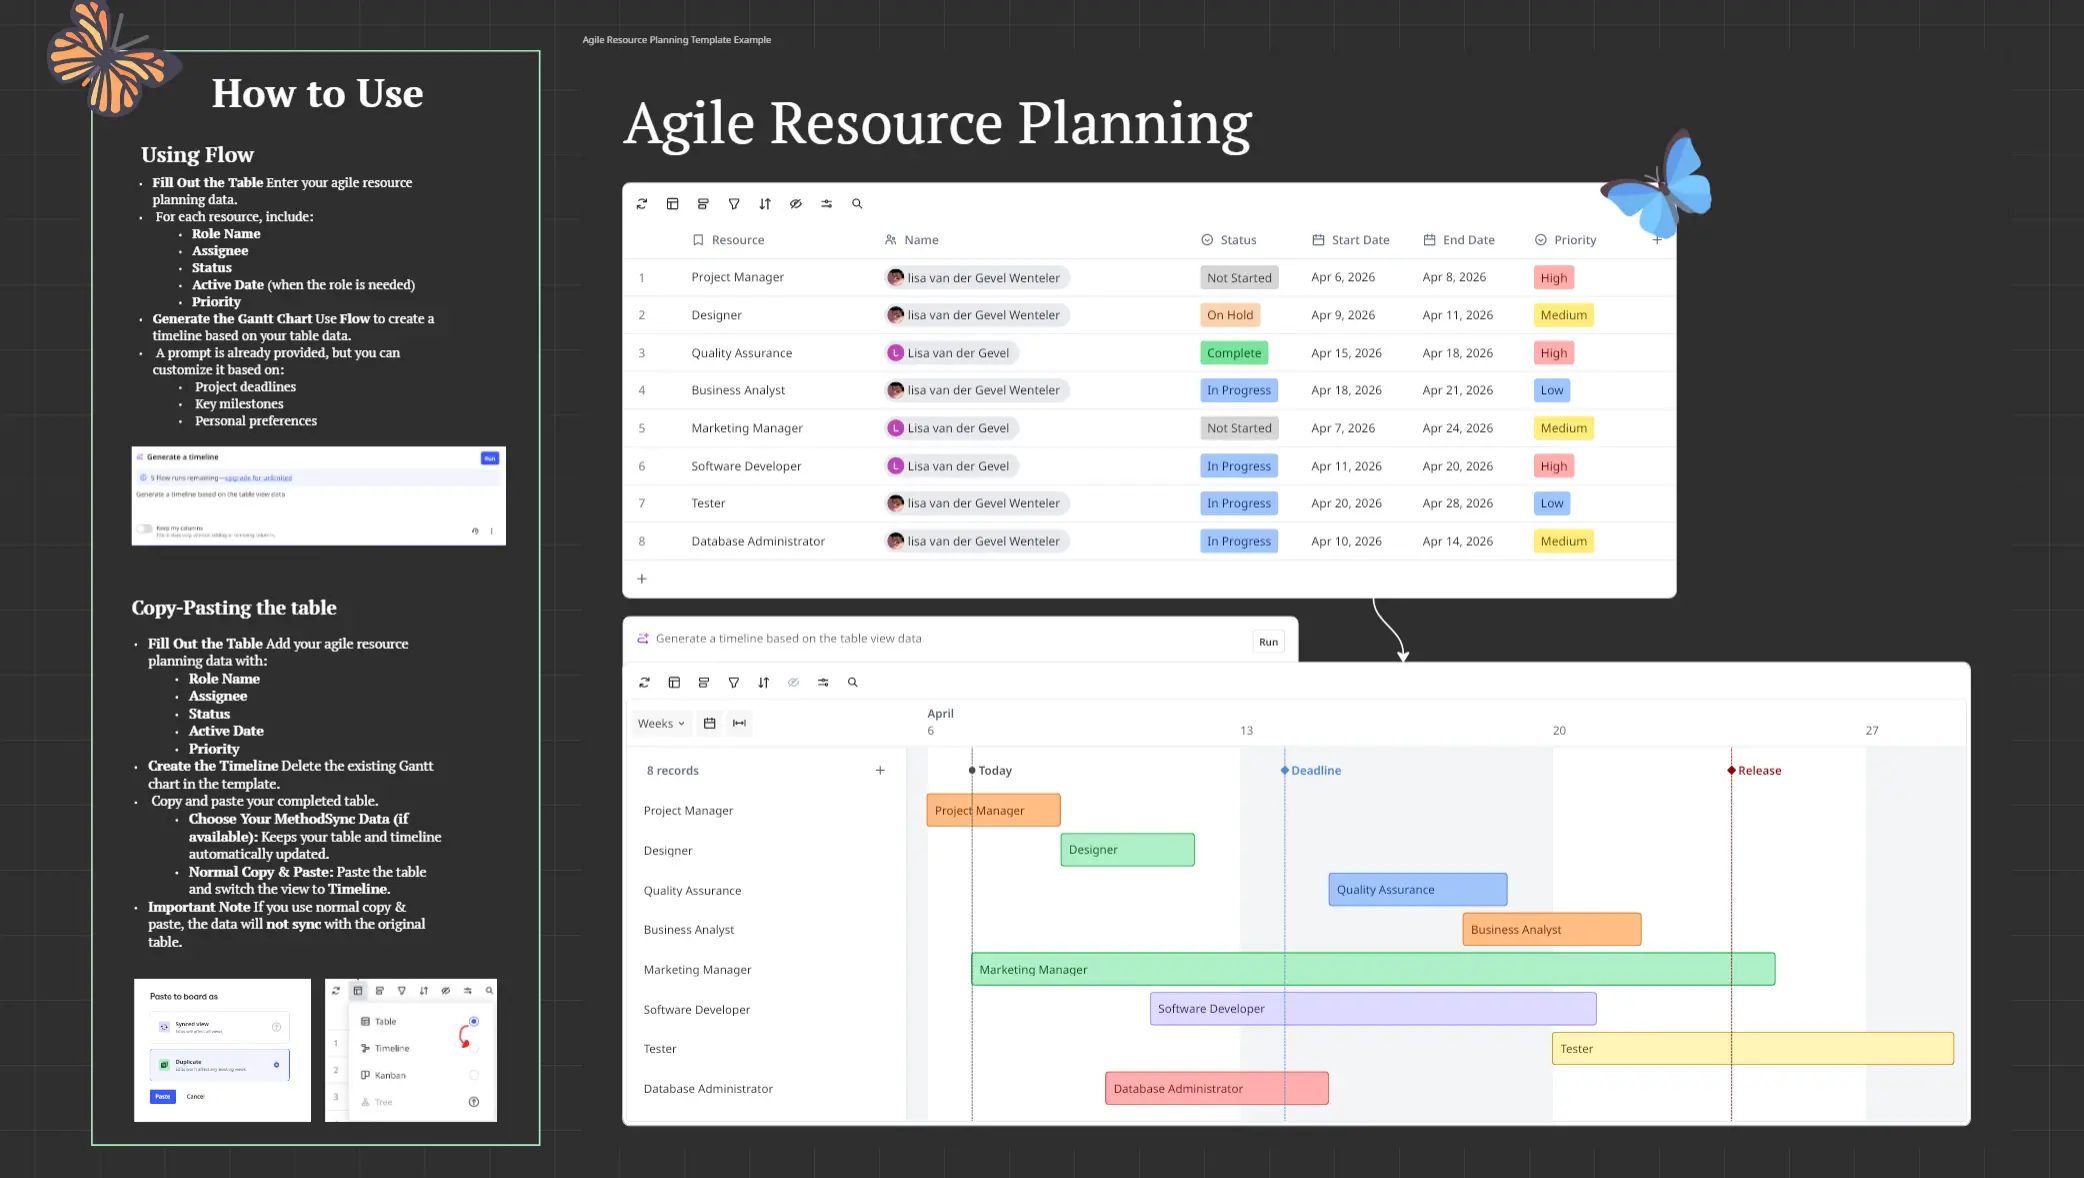
Template Structure
The template consists of a data table with the following columns:
Job Title - The role or position being tracked (e.g., Quality Assurance, Operations, Engineers, Design, Project Managers)
Monthly Columns - January through December, each representing planned headcount or FTE allocation for that month
Total - Optional column for calculating annual totals per role
Filling Instructions
Step 1: Define Job Titles
Enter each role or position you need to track in the "Job Title" column. Use one row per role or department.
Step 2: Enter Monthly Allocations
For each job title row, input the number of staff members allocated or required for each month. Enter numerical values only (representing headcount or full-time equivalents).
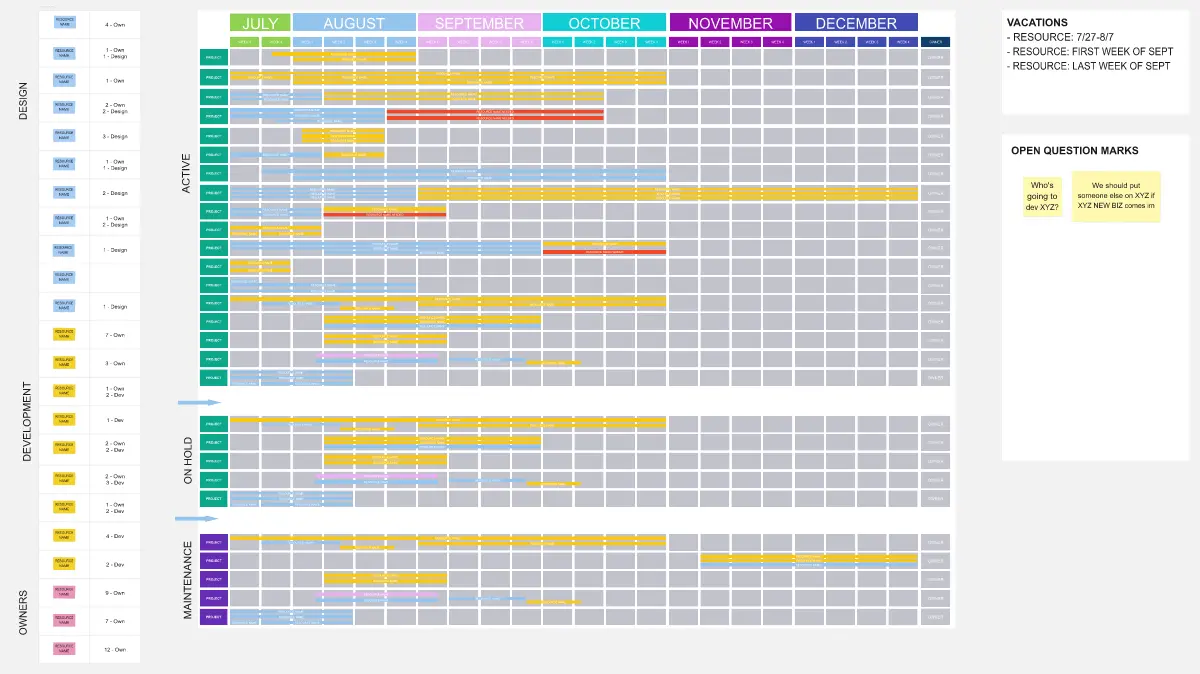
Step 3: Organize by Category
Leave empty rows between different role categories or departments for visual separation and better readability.
Step 4: Track Multiple Teams
If tracking separate teams or departments with the same role title, create duplicate entries on separate rows.
Step 5: Calculate Totals (Optional)
Sum the monthly values in the Total column to see annual requirements per role.
Histogram Generation Prompt
Once your data is entered, use this prompt to generate a visual representation:
"Create a stacked bar chart showing monthly staff allocation by job title. The X-axis should display all 12 months (January through December). The Y-axis should show the total headcount. Each job title should be represented as a different colored segment in the stacked bars. Include a legend identifying each job title by color. Title the chart 'Monthly Total Hours by Job Title'. Use the numerical values from each monthly column to construct the visualization."
Using the Generated Histogram
The resulting visualization displays:
Monthly staffing patterns and peaks across the organization
Proportional allocation between different roles
Seasonal trends in resource requirements
Total monthly headcount at a glance
This visual complement helps stakeholders quickly identify resource constraints, budget implications, and hiring priorities throughout the planning period.
Cheers!
Khawaja Rizwan