What is the Social Media Report Presentation Template?
A presentation template that helps marketers, social media managers, agencies, and business leaders communicate social media performance in a clear and actionable format. The template guides users through reporting on key metrics, audience growth, content performance, campaign results, insights, and recommendations.
What problem does the Social Media Report Presentation Template solve?
Social media reports that focus on data without insights
Difficulty communicating performance to stakeholders
Inconsistent reporting across channels and campaigns
Lack of actionable recommendations
Time-consuming report creation processes
How to use the Social Media Report Presentation Template
Define the reporting period and objectives.
Collect performance data from your social media platforms.
Summarize key metrics and performance trends.
Highlight top-performing content and campaigns.
Analyze audience growth and engagement patterns.
Identify key insights and lessons learned.
Create recommendations based on the data.
Present next steps and future opportunities.
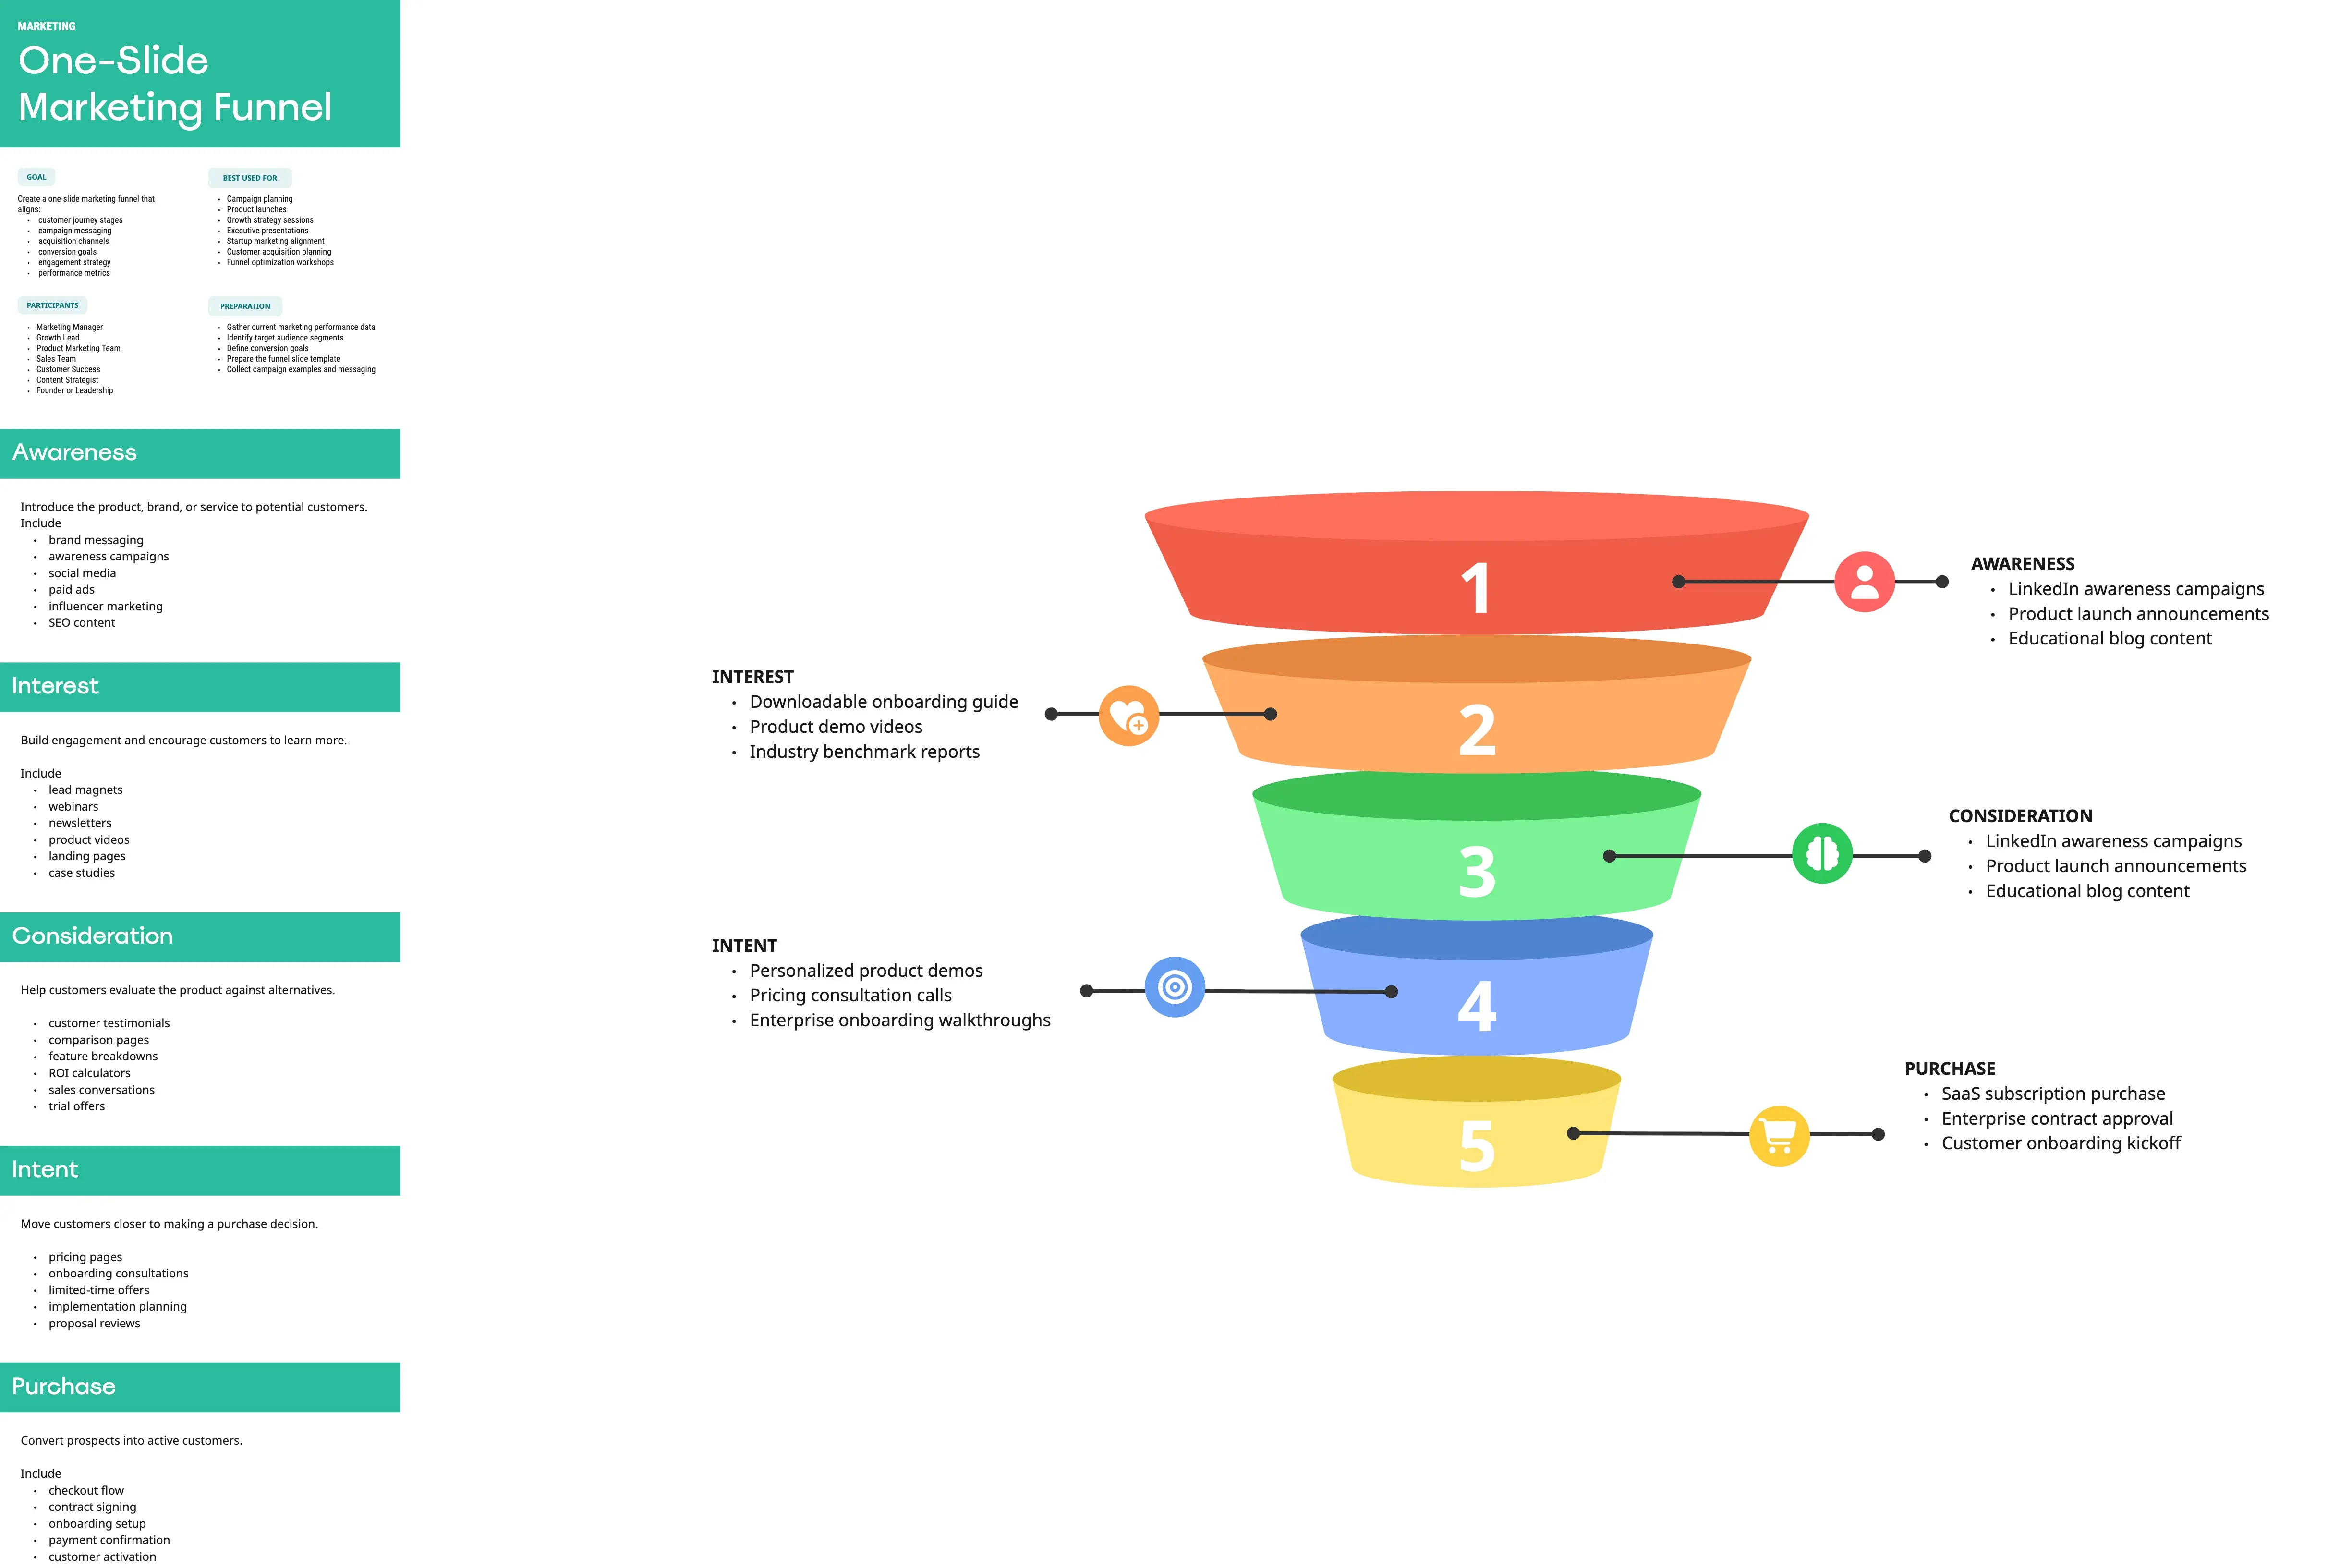
Recommended Presentation Structure
1. Executive Summary
Provide a high-level overview of key wins, challenges, and opportunities.
2. Goals and Reporting Period
Define what was measured and the timeframe covered.
3. Performance Overview
Present headline metrics and performance trends.
4. Channel Performance
Review results by platform.
5. Audience Insights
Analyze follower growth, demographics, and engagement behavior.
6. Content Performance
Highlight top-performing posts, videos, and campaigns.
7. Key Learnings
Identify patterns, successes, and opportunities for improvement.
8. Recommendations
Outline actions based on the findings.
9. Next Steps
Define priorities for the upcoming reporting period.
Common pitfalls
Reporting metrics without context
Including too much data on a single slide
Focusing on vanity metrics instead of business outcomes
Presenting numbers without recommendations
Using inconsistent reporting periods
Ways to avoid mistakes
Focus on insights rather than raw data
Use charts and visuals to simplify complex information
Connect social media performance to business objectives
Highlight trends and patterns over time
End every report with actionable recommendations
Miro Features You Can Use
Charts and graphs for performance visualization
Sticky notes for insights and recommendations
Tables for metric reporting
Frames for organizing report sections
Comments for stakeholder feedback
Tags for platform and campaign categorization
FAQs
Q: Who can benefit from this template?
A: Social media managers, marketing teams, agencies, content creators, consultants, founders, and business leaders responsible for reporting on social media performance.
Q: What social media platforms can this template support?
A: Instagram, LinkedIn, Facebook, TikTok, X, YouTube, Pinterest, Threads, and any platform that provides performance data.
Q: How often should social media reports be created?
A: Most organizations create reports monthly or quarterly, though campaign-specific reports may be created more frequently.
Q: Should every metric be included?
A: No. Focus on metrics that align with business goals, campaign objectives, and stakeholder needs.
Q: What will participants leave with?
A: A stakeholder-ready social media report that communicates performance, highlights insights, and provides clear recommendations for future action.