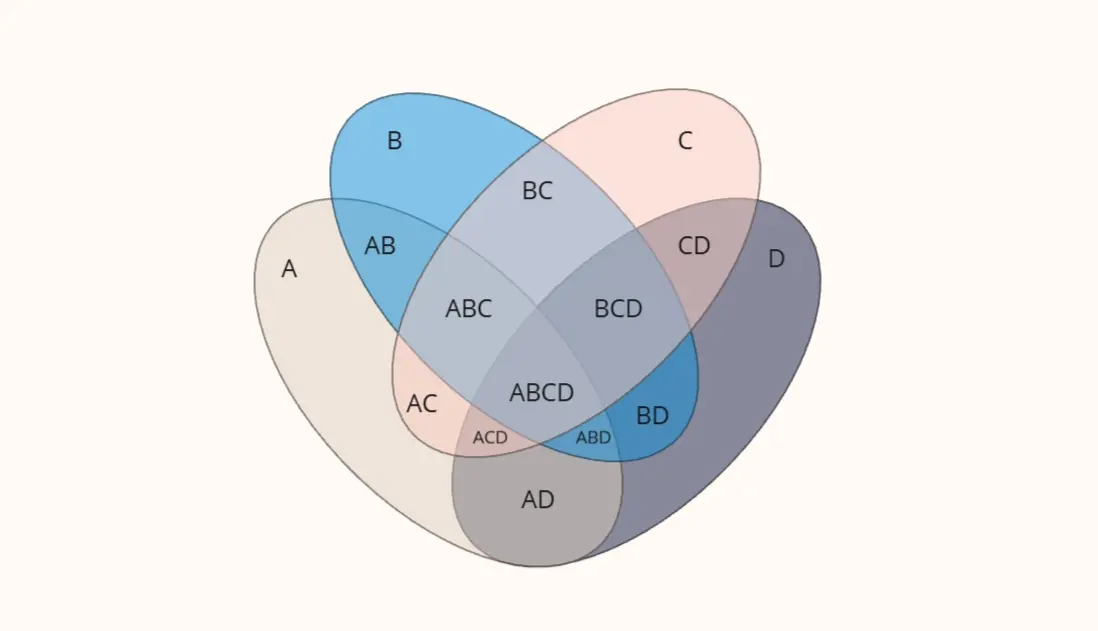
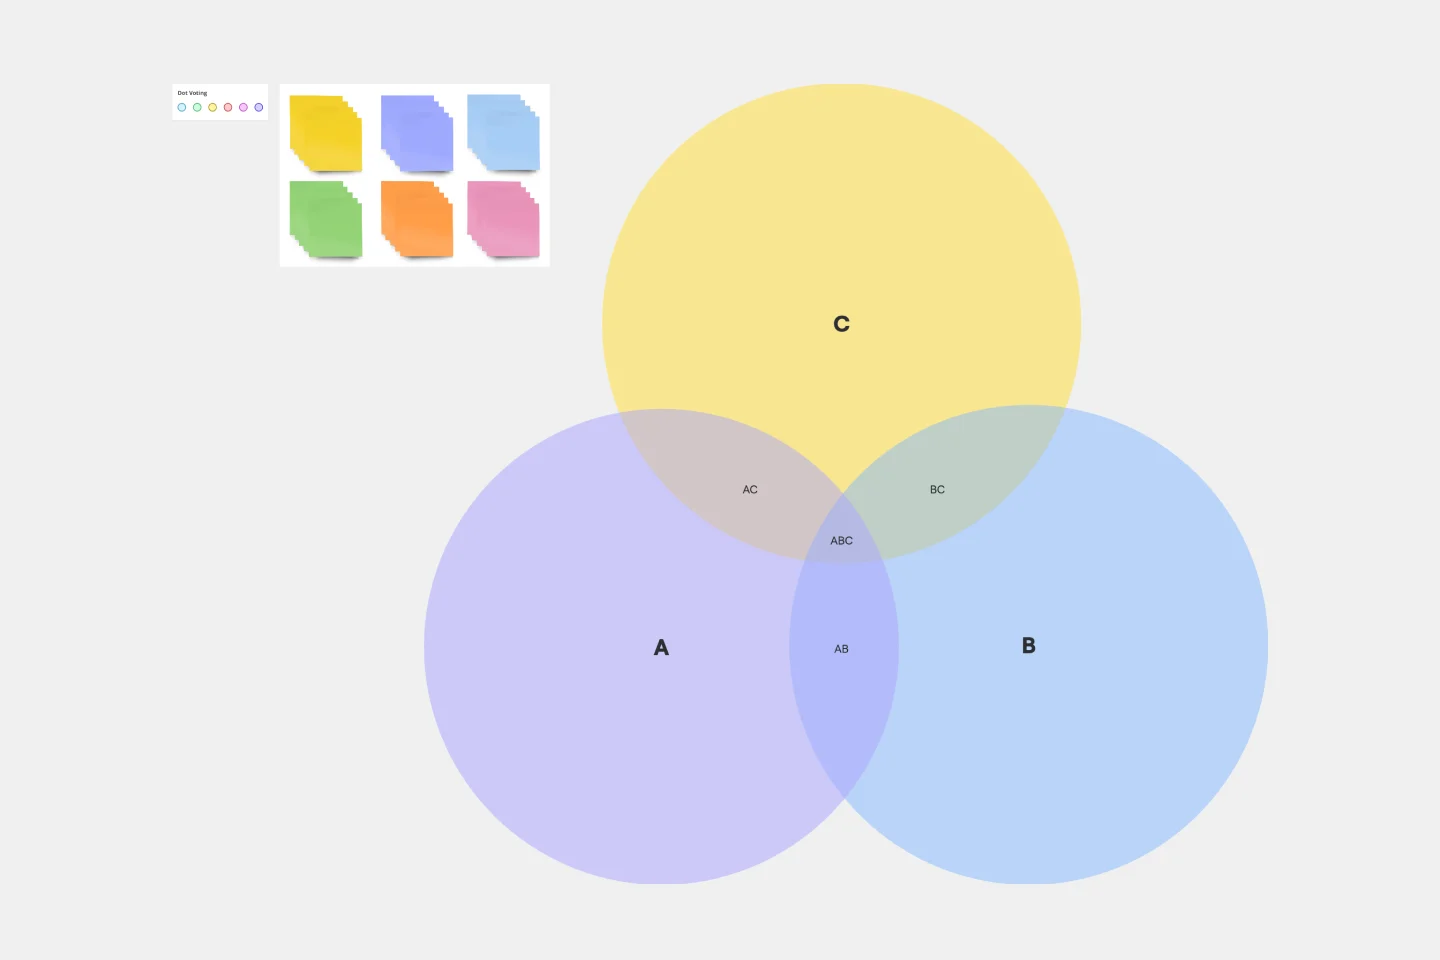
The Simple 3-Circle Venn Diagram is a visual tool for comparing and analysing three topics, ideas, groups, products, concepts, or perspectives. It helps identify what is unique to each element, what they have in common, and where meaningful overlaps exist.
Use it to explore similarities, differences, relationships, and shared opportunities in a simple and intuitive way.
How to use it
Label each circle with a topic, category, or concept.
Add unique characteristics to the outer sections of each circle.
Capture similarities in the overlapping areas.
Use the centre section to identify what all three elements have in common.
Discuss patterns, insights, opportunities, and key takeaways.
Workshop suggestion
Time: 15–45 minutes
Compare three ideas, products, customer groups, strategies, or stakeholders.
Work individually or collaboratively using sticky notes.
Discuss overlaps, differences, and opportunities for improvement or collaboration.
Summarise key insights from the centre section.
Who can use it?
Teams and organisations
Students and educators
Consultants and facilitators
Researchers and analysts
Entrepreneurs and innovators
Anyone comparing multiple ideas or options
What should you consider?
✓ Focus on the most important similarities and differences.
✓ Keep entries concise and easy to compare.
✓ Use the overlapping sections to identify connections and opportunities.
✓ Look for insights that may not be obvious when analysing each element separately.
What’s the output?
✓ A visual comparison of three topics or concepts
✓ A clearer understanding of similarities and differences
✓ Identified patterns, overlaps, and relationships
✓ Insights that support discussion, learning, decision-making, and innovation