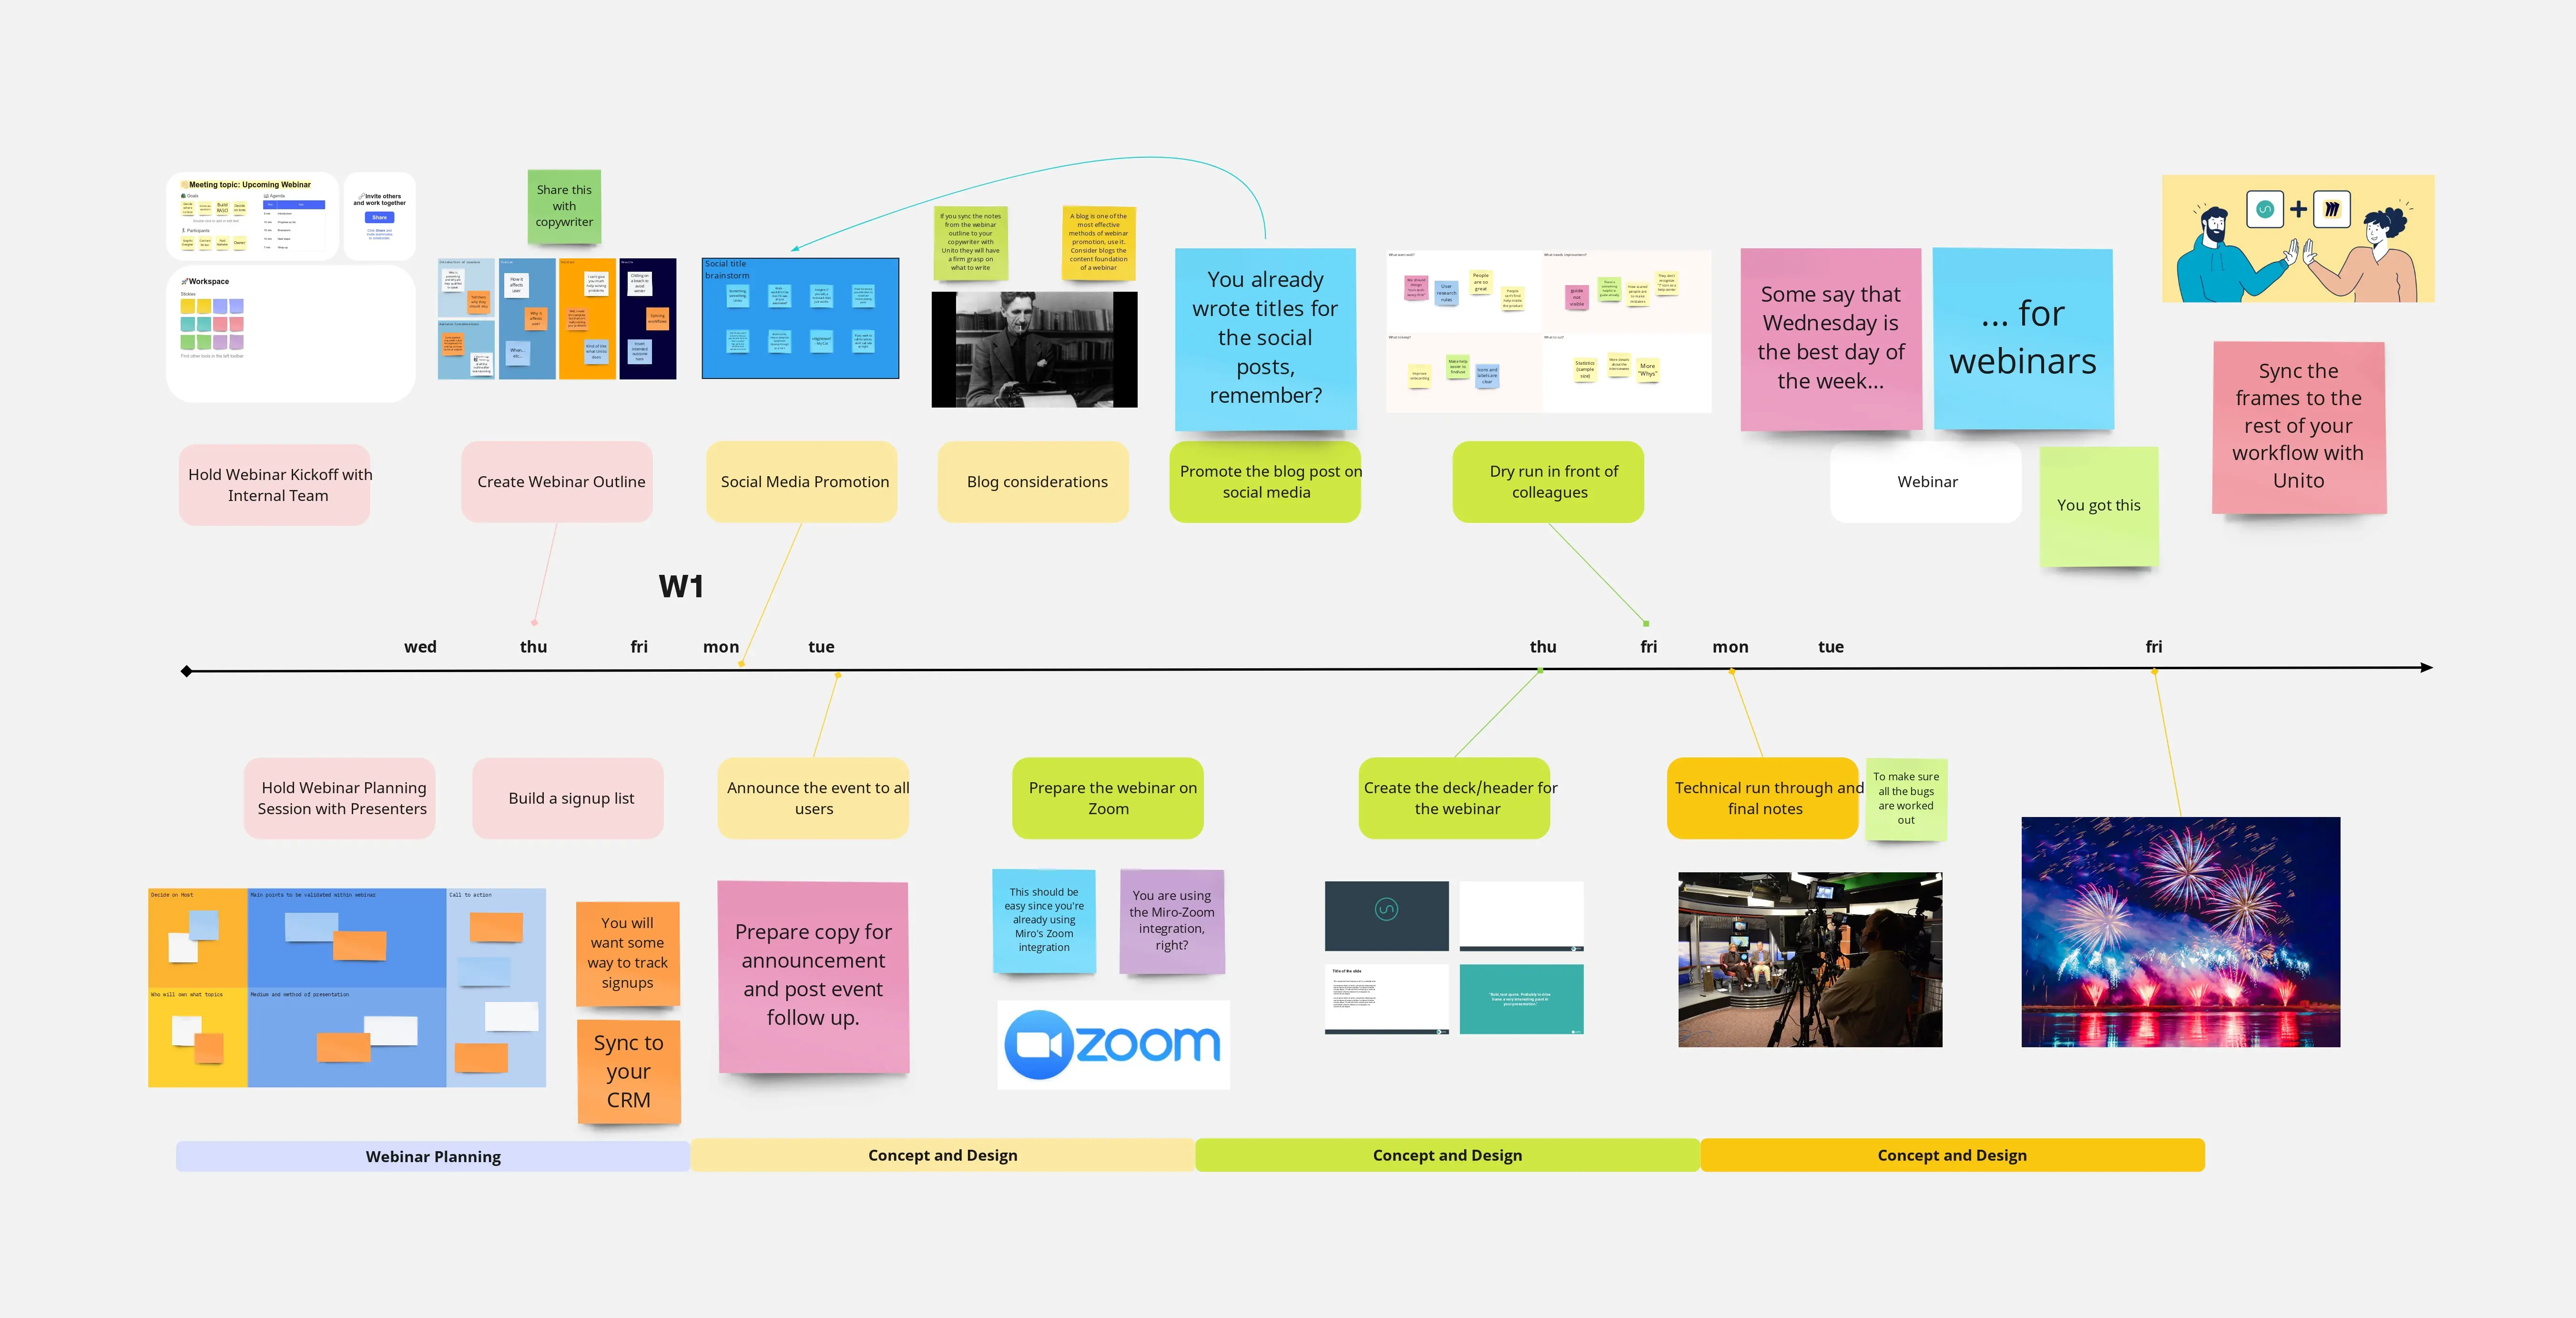
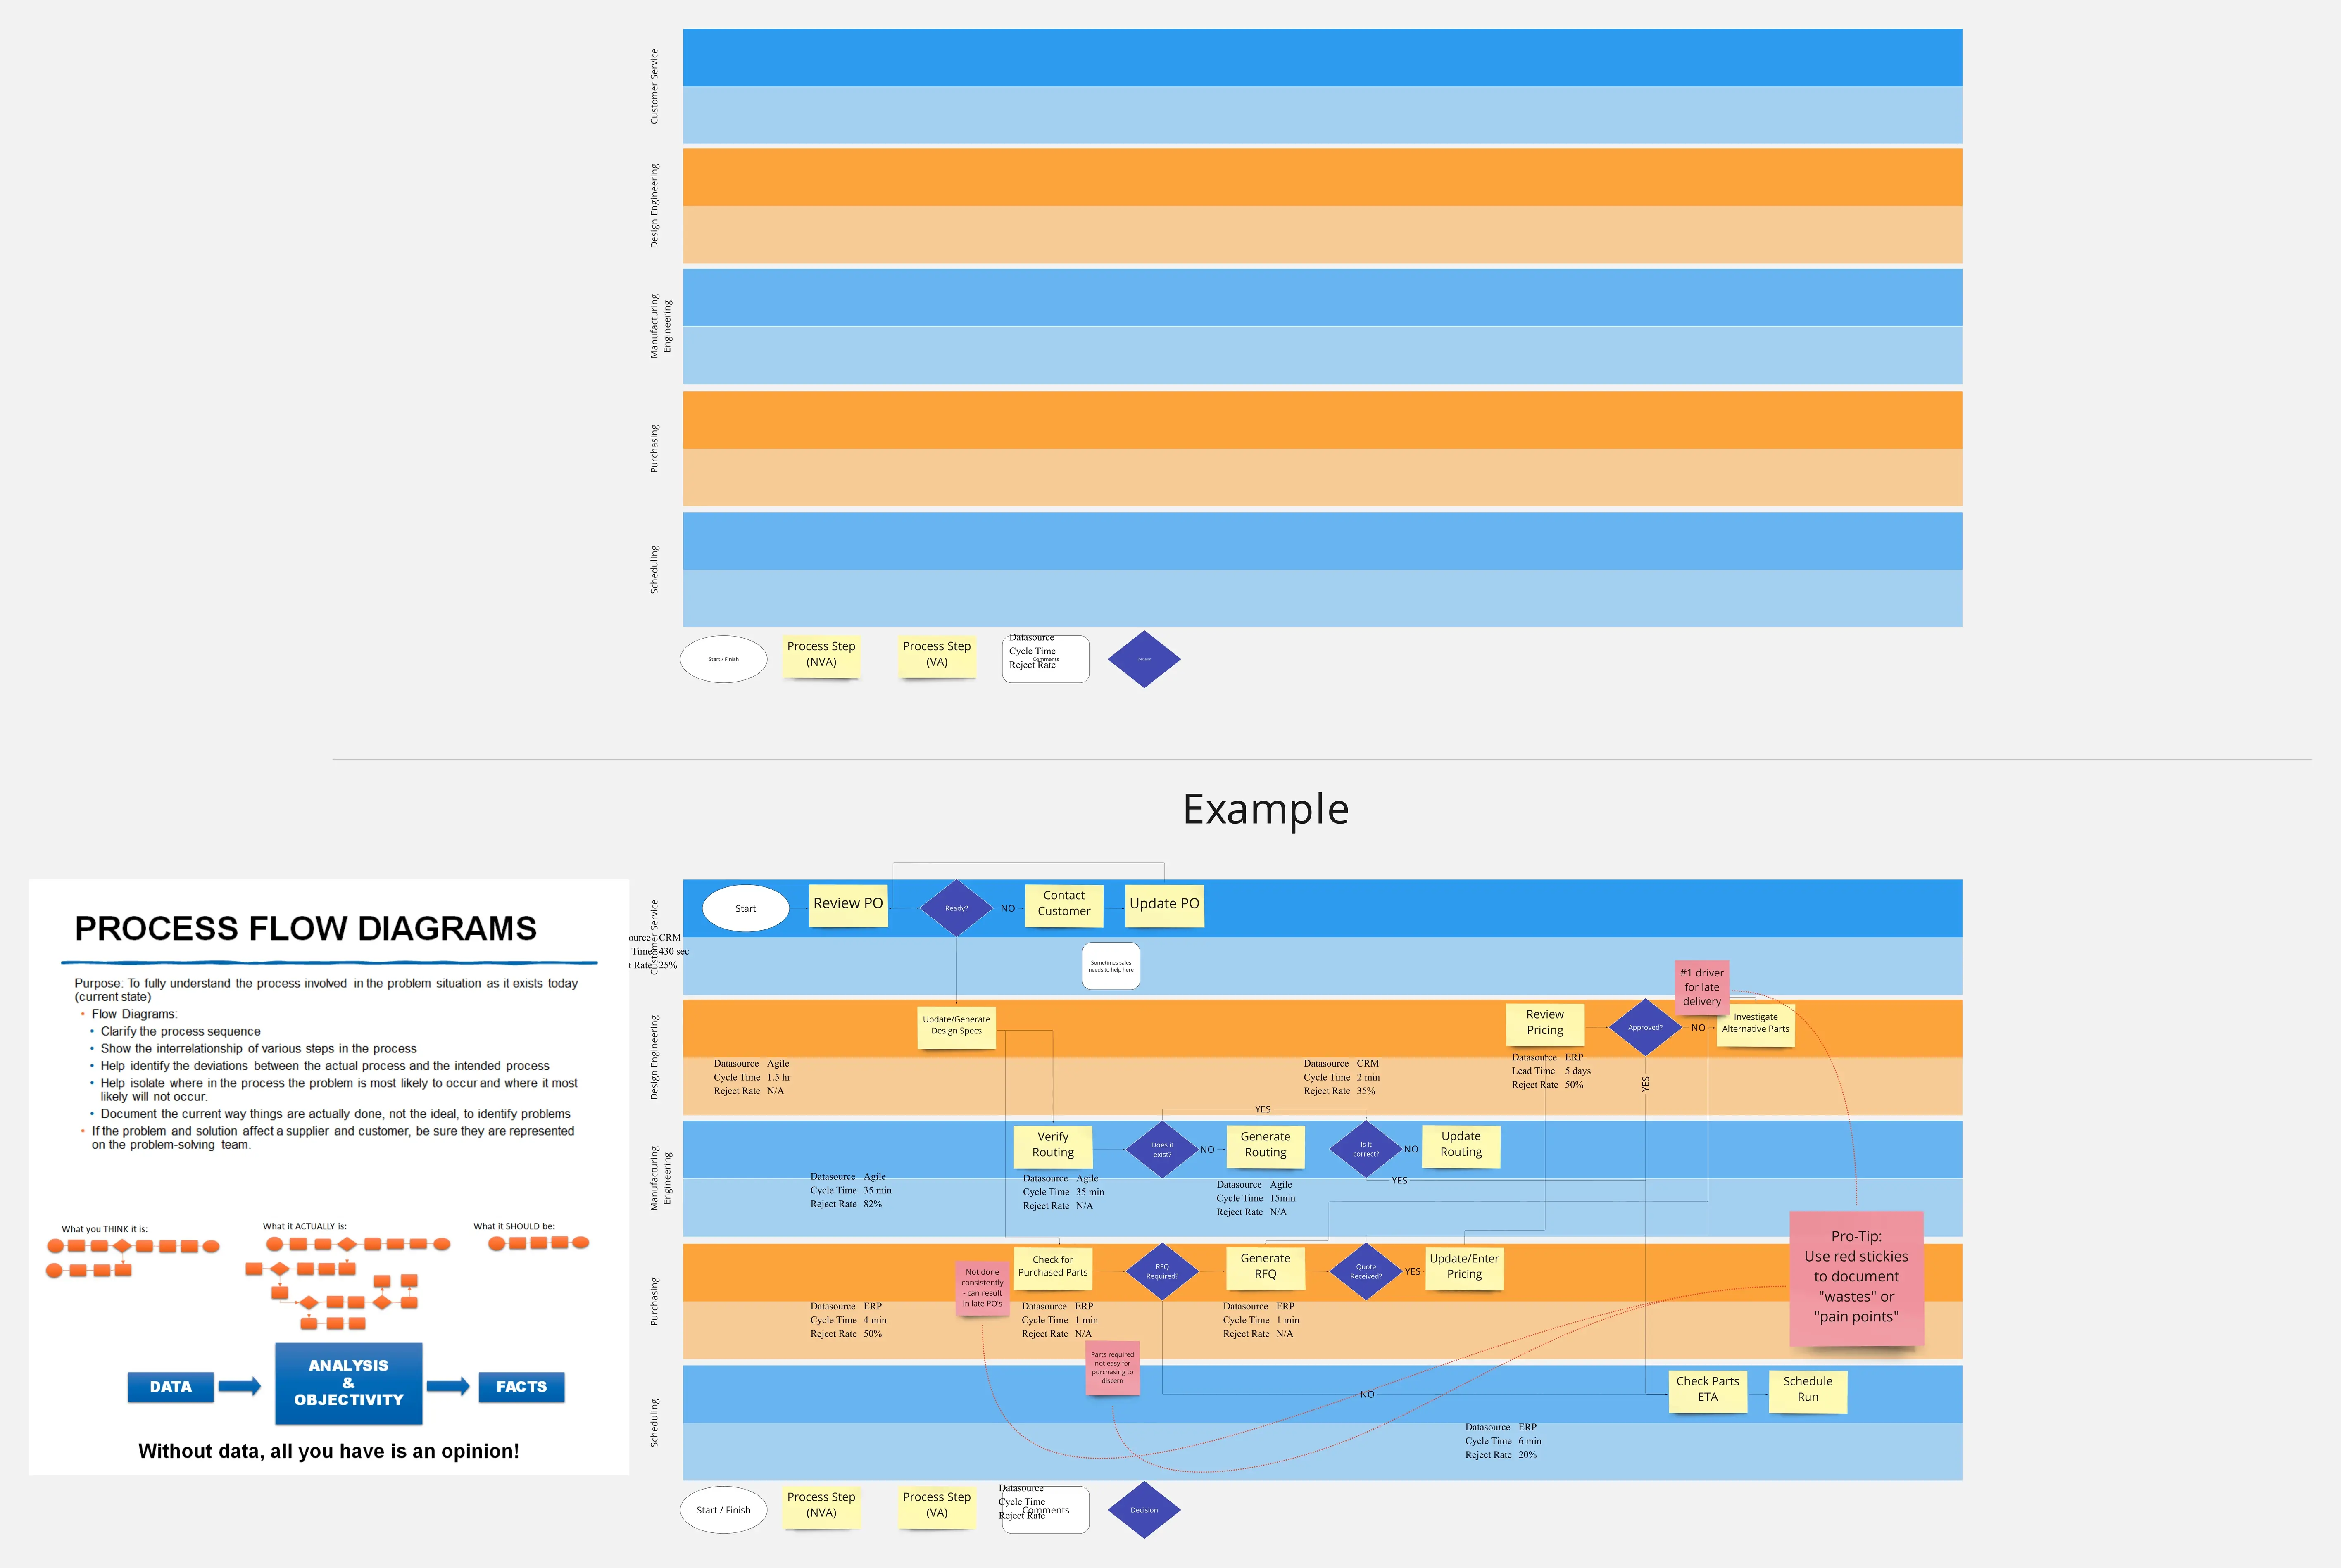
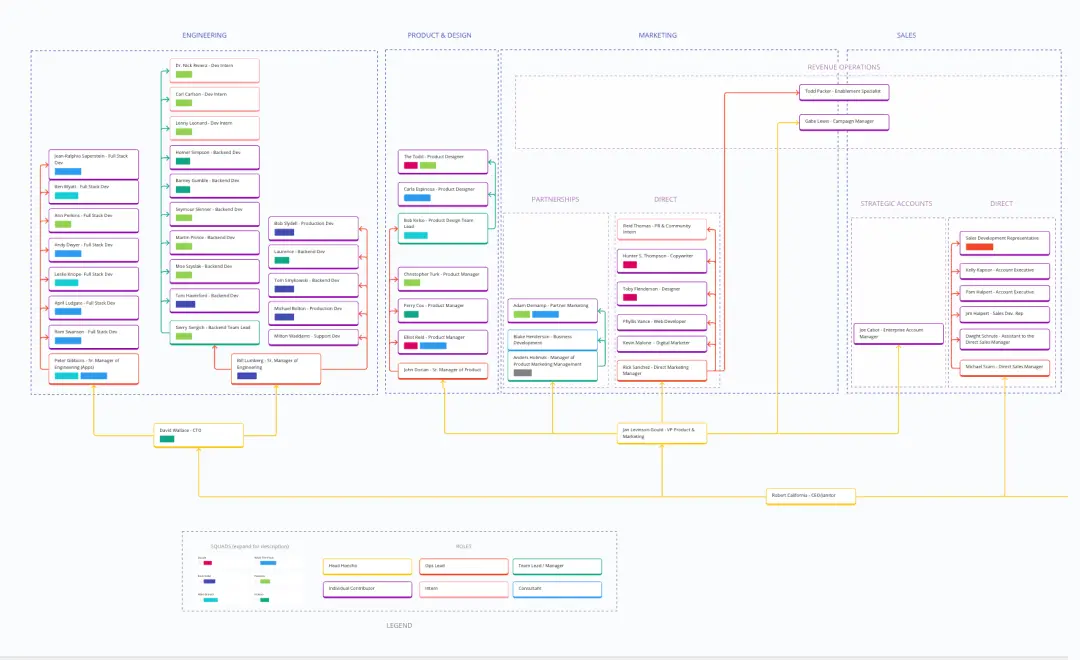
Swim Lane Diagram with Data
The Swim Lane Diagram with Data template is a visual tool for illustrating processes or workflows with swimlanes that contain additional data or information. It provides elements for documenting process steps, timelines, and performance metrics within each swimlane. This template enables teams to analyze process efficiency, identify bottlenecks, and make data-driven decisions for process improvement. By combining visual clarity with data insights, the Swim Lane Diagram with Data empowers organizations to optimize workflows and drive continuous improvement effectively.