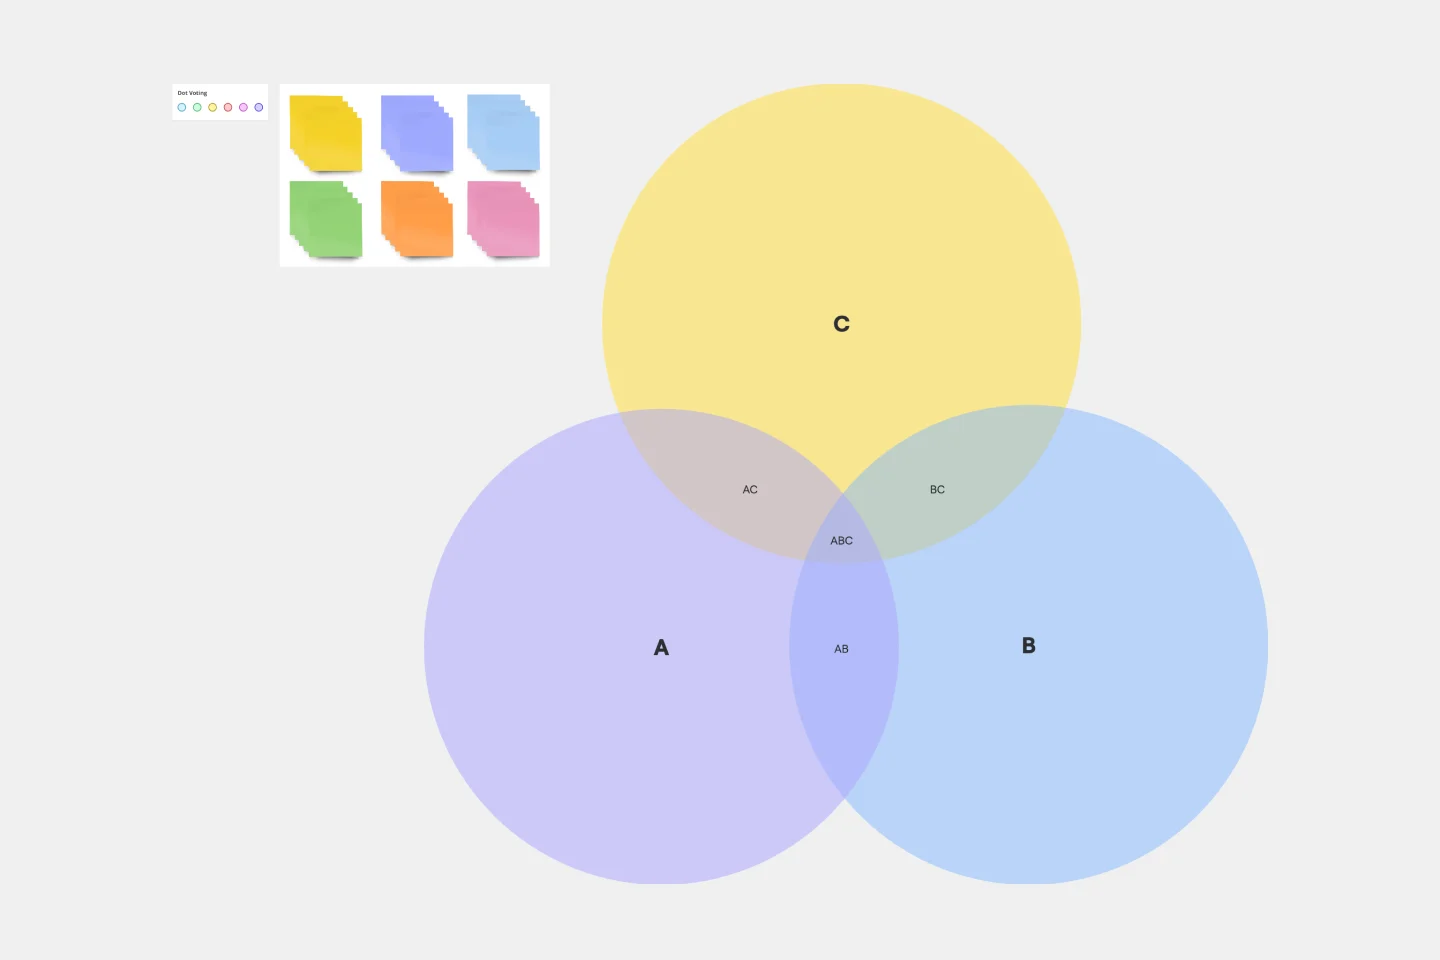
A 3-Set Venn Diagram is a simple visual tool used to compare three groups, concepts, or categories. By showing where the circles overlap, it helps identify similarities, differences, and shared relationships at a glance.
Whether you're analyzing data, comparing ideas, or facilitating a workshop, this template makes it easy to organize information and uncover meaningful connections.
Great for
Comparing three products, services, or ideas
Identifying similarities and differences
Business and strategy workshops
Research and data analysis
Education and learning activities
Brainstorming sessions
Stakeholder and audience analysis
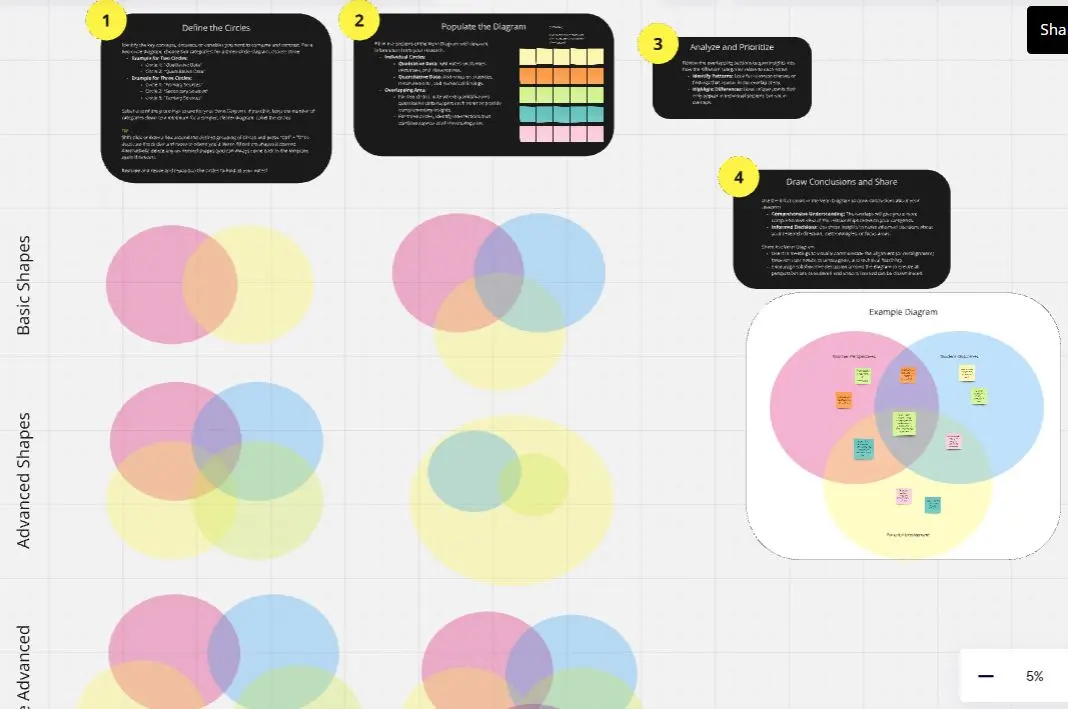
How it works
Label each circle with a category, concept, or group.
Add key information inside the relevant sections.
Use overlapping areas to highlight shared characteristics or relationships.
Place information in the center when it applies to all three categories.
Customize the colors, labels, and content to match your needs.