Current State vs. Future State Flowchart Template
Strategically allocate tasks, visualize process changes, and identify bottlenecks with the current state vs. future state flowchart template.
About the Current State vs. Future State Flowchart Template
The Current State vs Future State Flowchart Template is essential for teams facing complex processes. This powerful asset provides clarity and structure to workflows, employing swimlanes to clarify departmental responsibilities and layers to offer a nuanced view of process changes. With its strategic guidance, teams can identify and address bottlenecks with precision, empowering them to navigate their transformational journey with confidence and ease. Don't let complex processes slow you down - use the Current State vs Future State Flowchart Template to take control.
Understanding the template
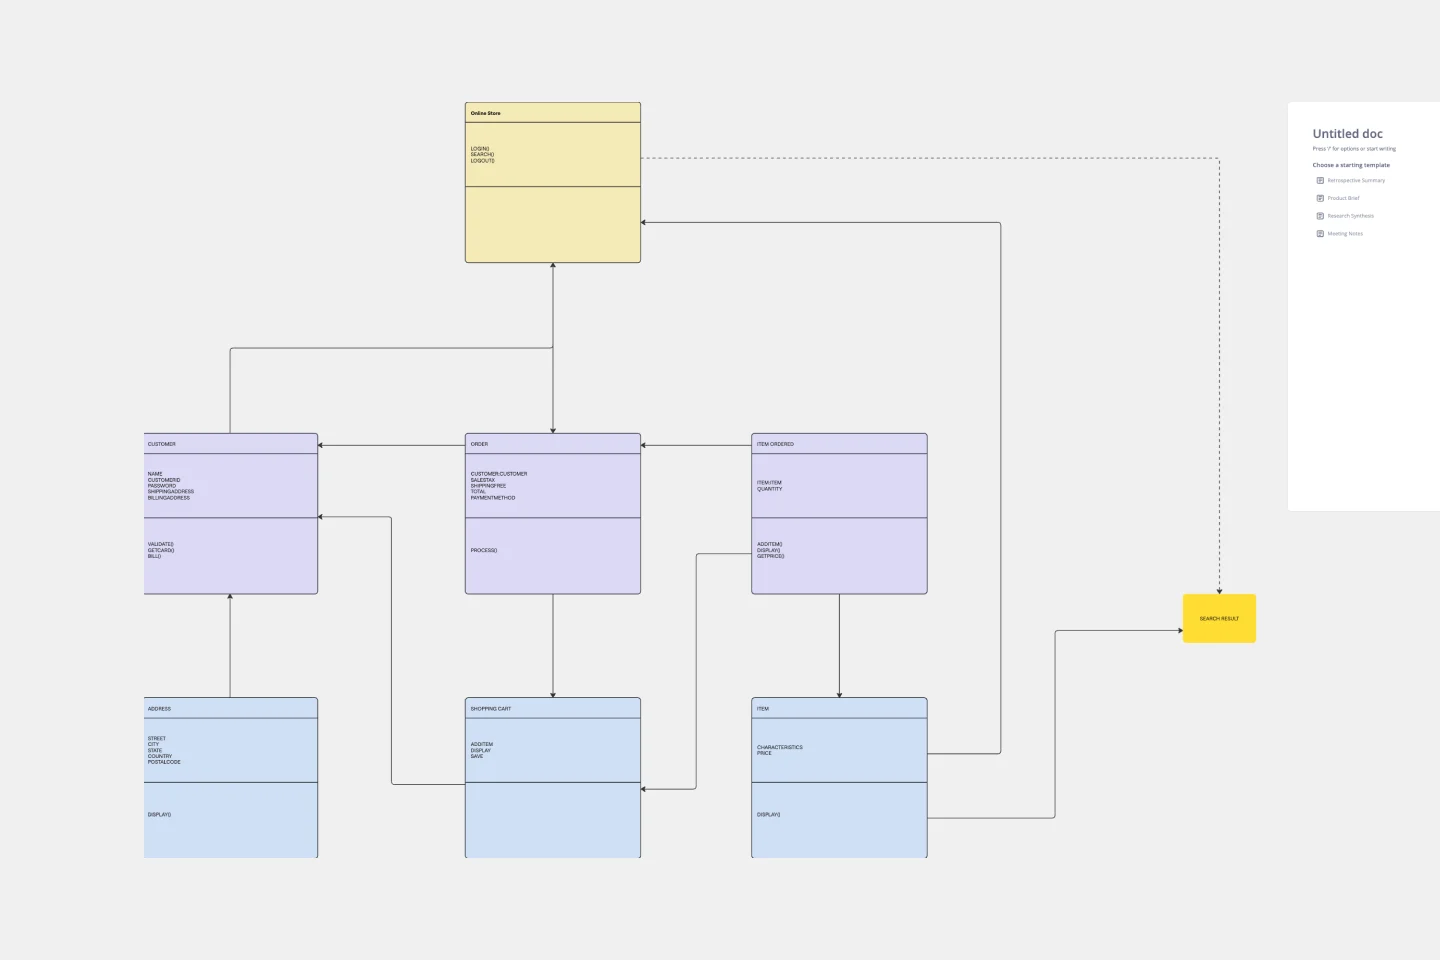
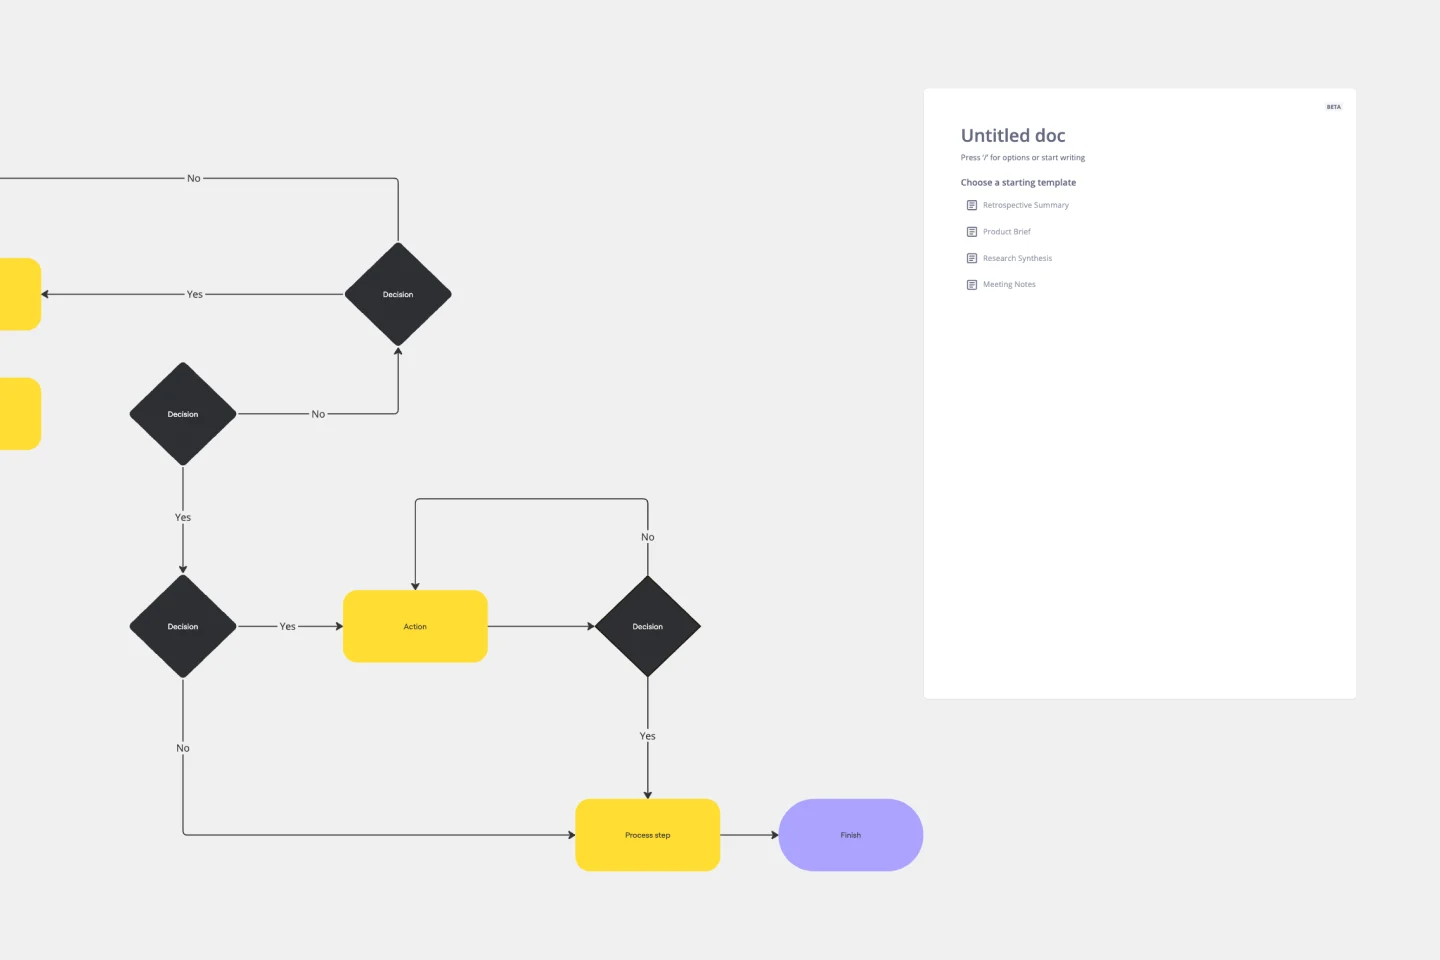
The Current State vs Future State Flowchart Template is designed to allocate tasks to respective departments using swimlanes, which helps to define roles and responsibilities clearly. The template also has layers that allow for dynamic representation of changes between the current and future states. This tool goes beyond just visualizing the process, as it can help teams identify bottlenecks and improve efficiency by streamlining workflows.
How to use the current state vs. future state flowchart template in Miro
Optimize task allocation with swimlanes: Use swimlanes to assign tasks to specific departments, fostering transparency in responsibilities and facilitating streamlined communication.
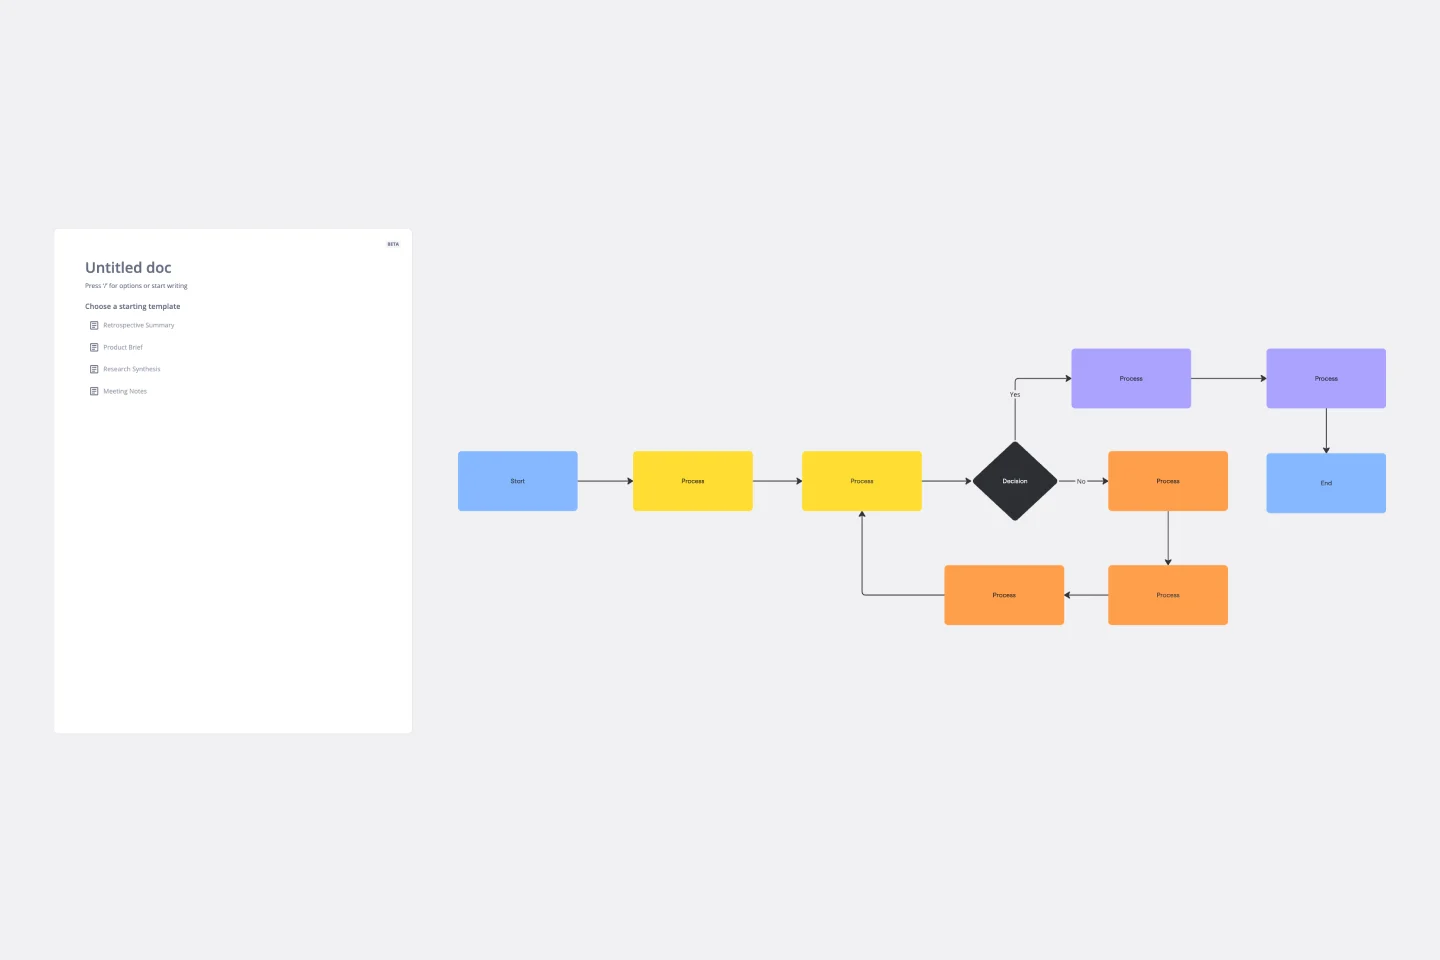
Enhance visualization with layers: Leverage layers to dynamically represent changes between current and future processes, offering a detailed and adaptable perspective on the transformation journey.
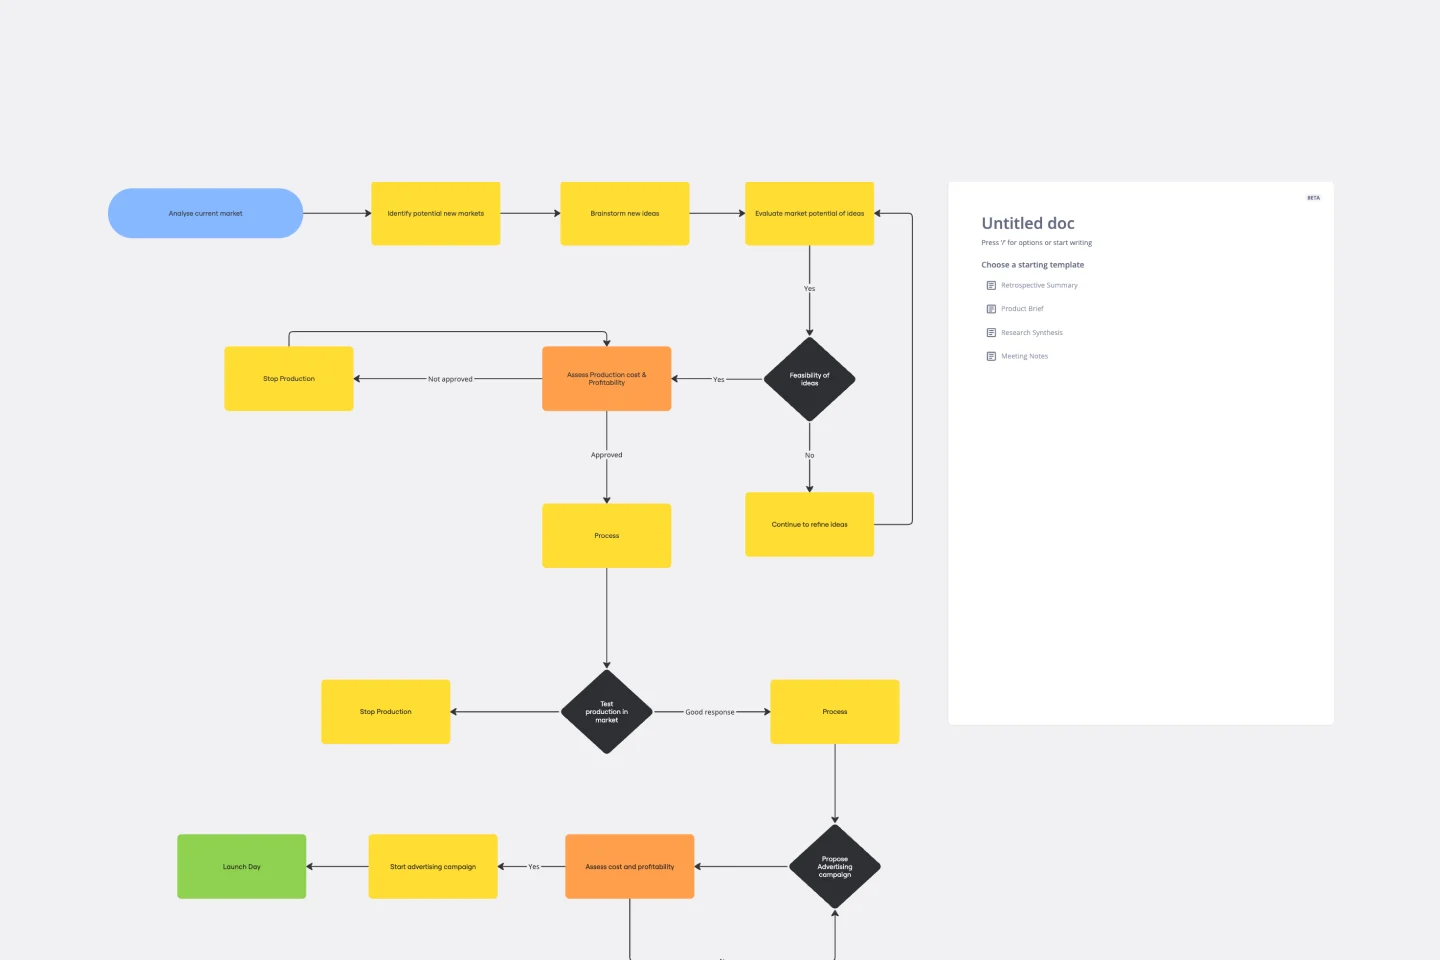
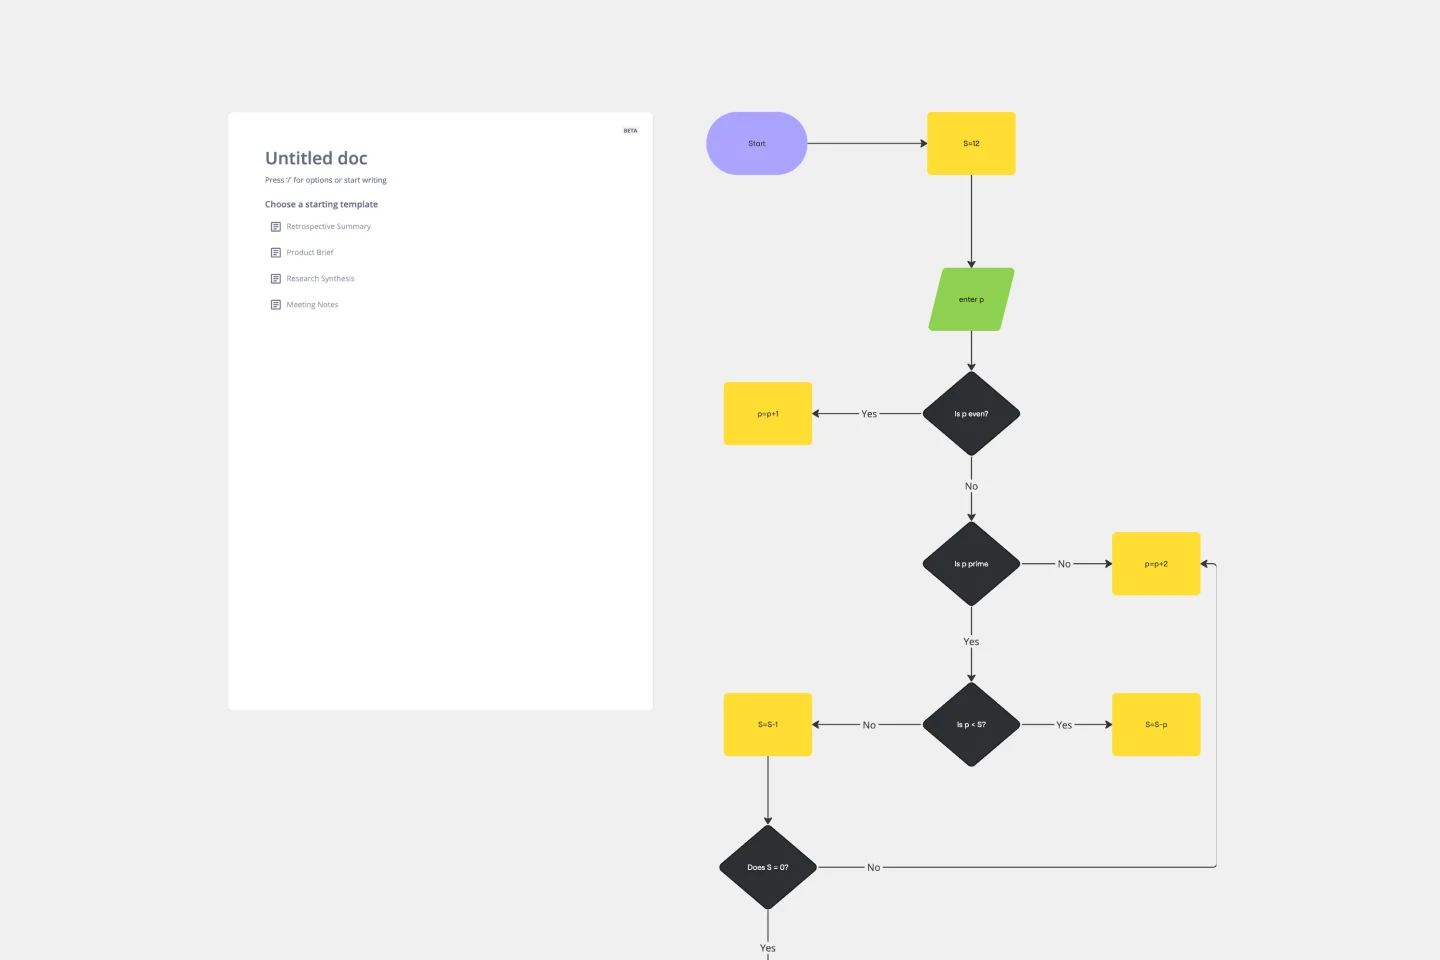
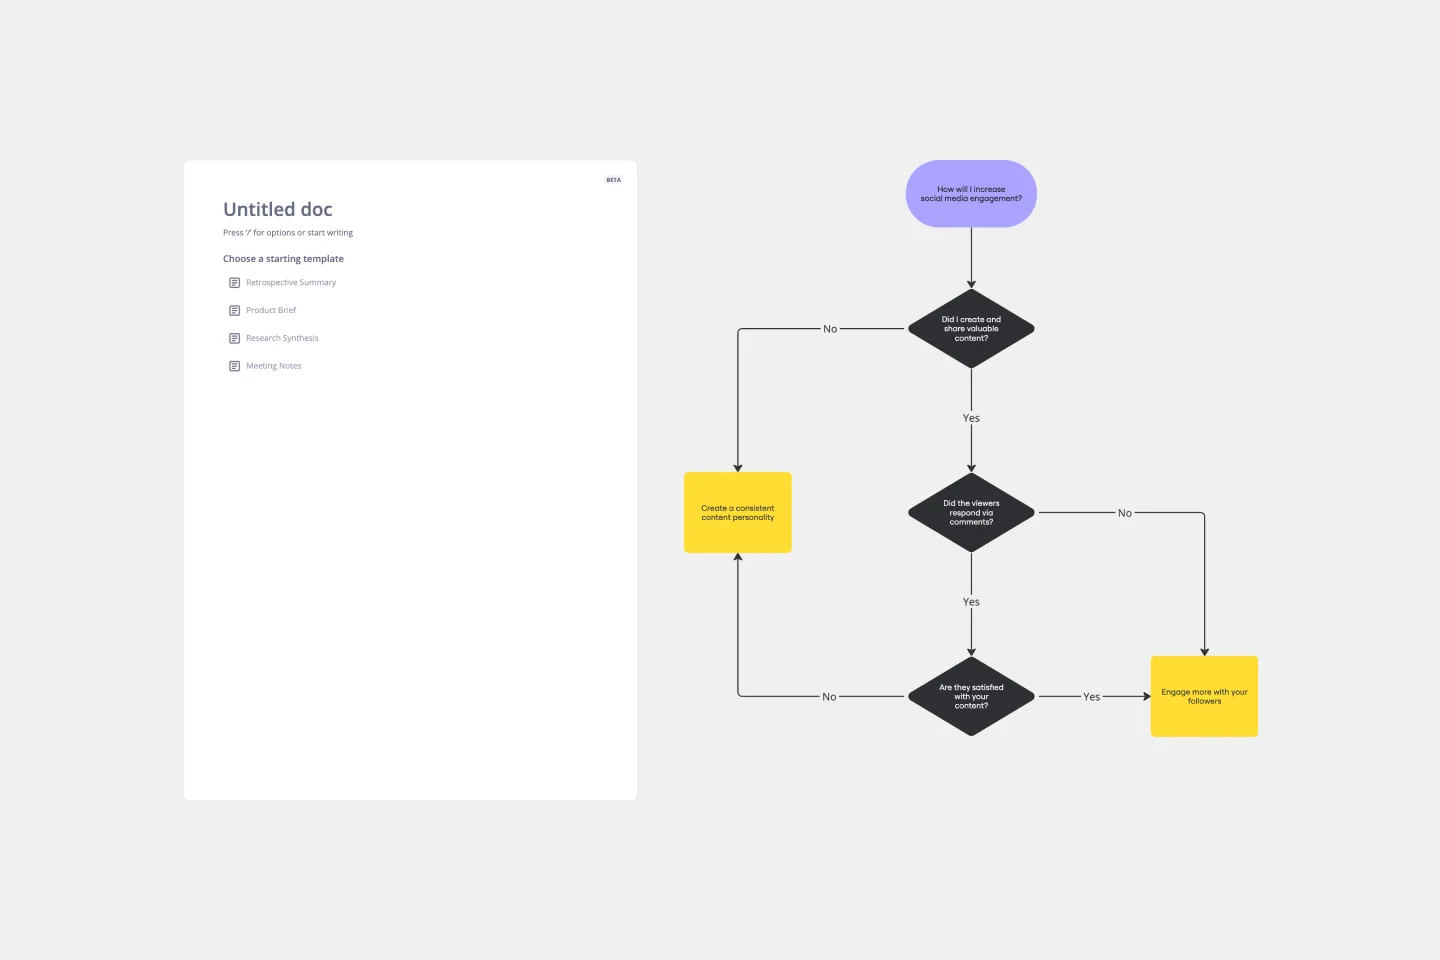
Proactively address bottlenecks: Analyze the flowchart to identify bottlenecks, providing teams with actionable insights to address challenges and optimize workflow efficiency proactively.
Why should you use a current state vs. future state flowchart template?
Precision with swimlanes: Clearly understand and communicate which department is responsible for each task, ensuring accountability and clarity within the team.
Nuanced process visualization: Employ layers to visualize complex changes between current and future processes, offering a comprehensive and adaptable representation of the transformational journey.
Identify bottlenecks: The template serves as a strategic tool, enabling teams to address challenges and optimize workflow efficiency strategically.
Transparent communication: Use swimlanes to precisely define responsibilities, promoting transparent communication and alignment on tasks and objectives.
Efficiency optimization: Pinpointing bottlenecks empowers teams to optimize workflows, enhancing overall efficiency and effectiveness.
If you'd prefer to start from scratch, flowcharting with Miro is easy! You can choose from a wide range of flowchart shapes in Miro's extensive library, so you'll find just what you need.
Can I export the flowchart for external use or presentations?
Miro provides export options, allowing you to save your flowchart as an image or PDF for external sharing or adding to presentations.
Are there any pre-built templates for specific industries or processes?
While the Current State vs Future State Flowchart Template provides a versatile framework, Miro also offers industry-specific templates that can be customized to meet your unique needs.
Get started with this template right now.
AWS Cloud Infrastructure Optimization Template
Works best for:
AWS , Diagramming
The AWS Cloud Infrastructure Optimization Template is part of Miro's Intelligent Templates collection, designed to streamline and enhance the management of your AWS cloud resources. This template leverages Miro's advanced diagramming tools and integrates seamlessly with AWS to provide real-time data visualization, cost analysis, and performance optimization. One key benefit of using this template is its ability to auto-generate detailed diagrams of your current AWS setup, providing a clear visual representation of your architecture. This feature saves time and reduces the manual effort required to visualize and optimize your AWS infrastructure, making it easier to manage and scale your cloud resources effectively.
Venn Diagrams by Dave Westgarth
Works best for:
Venn Diagram
Visualize relationships and intersections clearly with the Collection Venn Diagram template. This tool is perfect for comparing multiple sets of data, identifying commonalities, and showcasing unique elements. Use it in presentations, research, and data analysis to make complex information more digestible. Ideal for educators, researchers, and analysts seeking to present data insights effectively.
Product Development Process Flowchart Template
The Product Development Process Flowchart Template is a strategic tool designed to guide teams through the intricate journey of bringing a new product to market. This template serves as a visual roadmap, outlining each critical step in the product development lifecycle, from initial concept and design to testing, refinement, and eventual launch. It's structured to foster clarity, ensuring that all team members are aligned and aware of their roles and responsibilities at every phase.
Stakeholder Mapping Template
Works best for:
Business Management, Mapping, Workflows
A stakeholder map is a type of analysis that allows you to group people by their power and interest. Use this template to organize all of the people who have an interest in your product, project, or idea in a single visual space. This allows you to easily see who can influence your project, and how each person is related to the other. Widely used in project management, stakeholder mapping is typically performed at the beginning of a project. Doing stakeholder mapping early on will help prevent miscommunication, ensure all groups are aligned on the objectives and set expectations about outcomes and results.
Turtle Diagram for BA
Works best for:
Diagramming
The Turtle Diagram for BA template offers a visual framework for defining and auditing business processes according to ISO 9001 standards. It provides elements for documenting process inputs, outputs, activities, and controls. This template enables organizations to ensure compliance, identify process improvements, and enhance quality management practices. By promoting systematic process documentation and auditability, the Turtle Diagram for BA empowers organizations to achieve and maintain ISO 9001 certification, demonstrating commitment to quality and continuous improvement.
Entity–Relationship Diagram (ERD) HR Management System Template
Works best for:
ERD
The Entity–Relationship Diagram (ERD) HR Management System Template in Miro is designed to streamline the management of employee-related information and processes within an organization. This template allows for the visualization and organization of complex HR systems, making it easier to understand relationships and processes. It enables users to map out departments, positions, and employee details, including attendance records, payroll, and performance reviews.