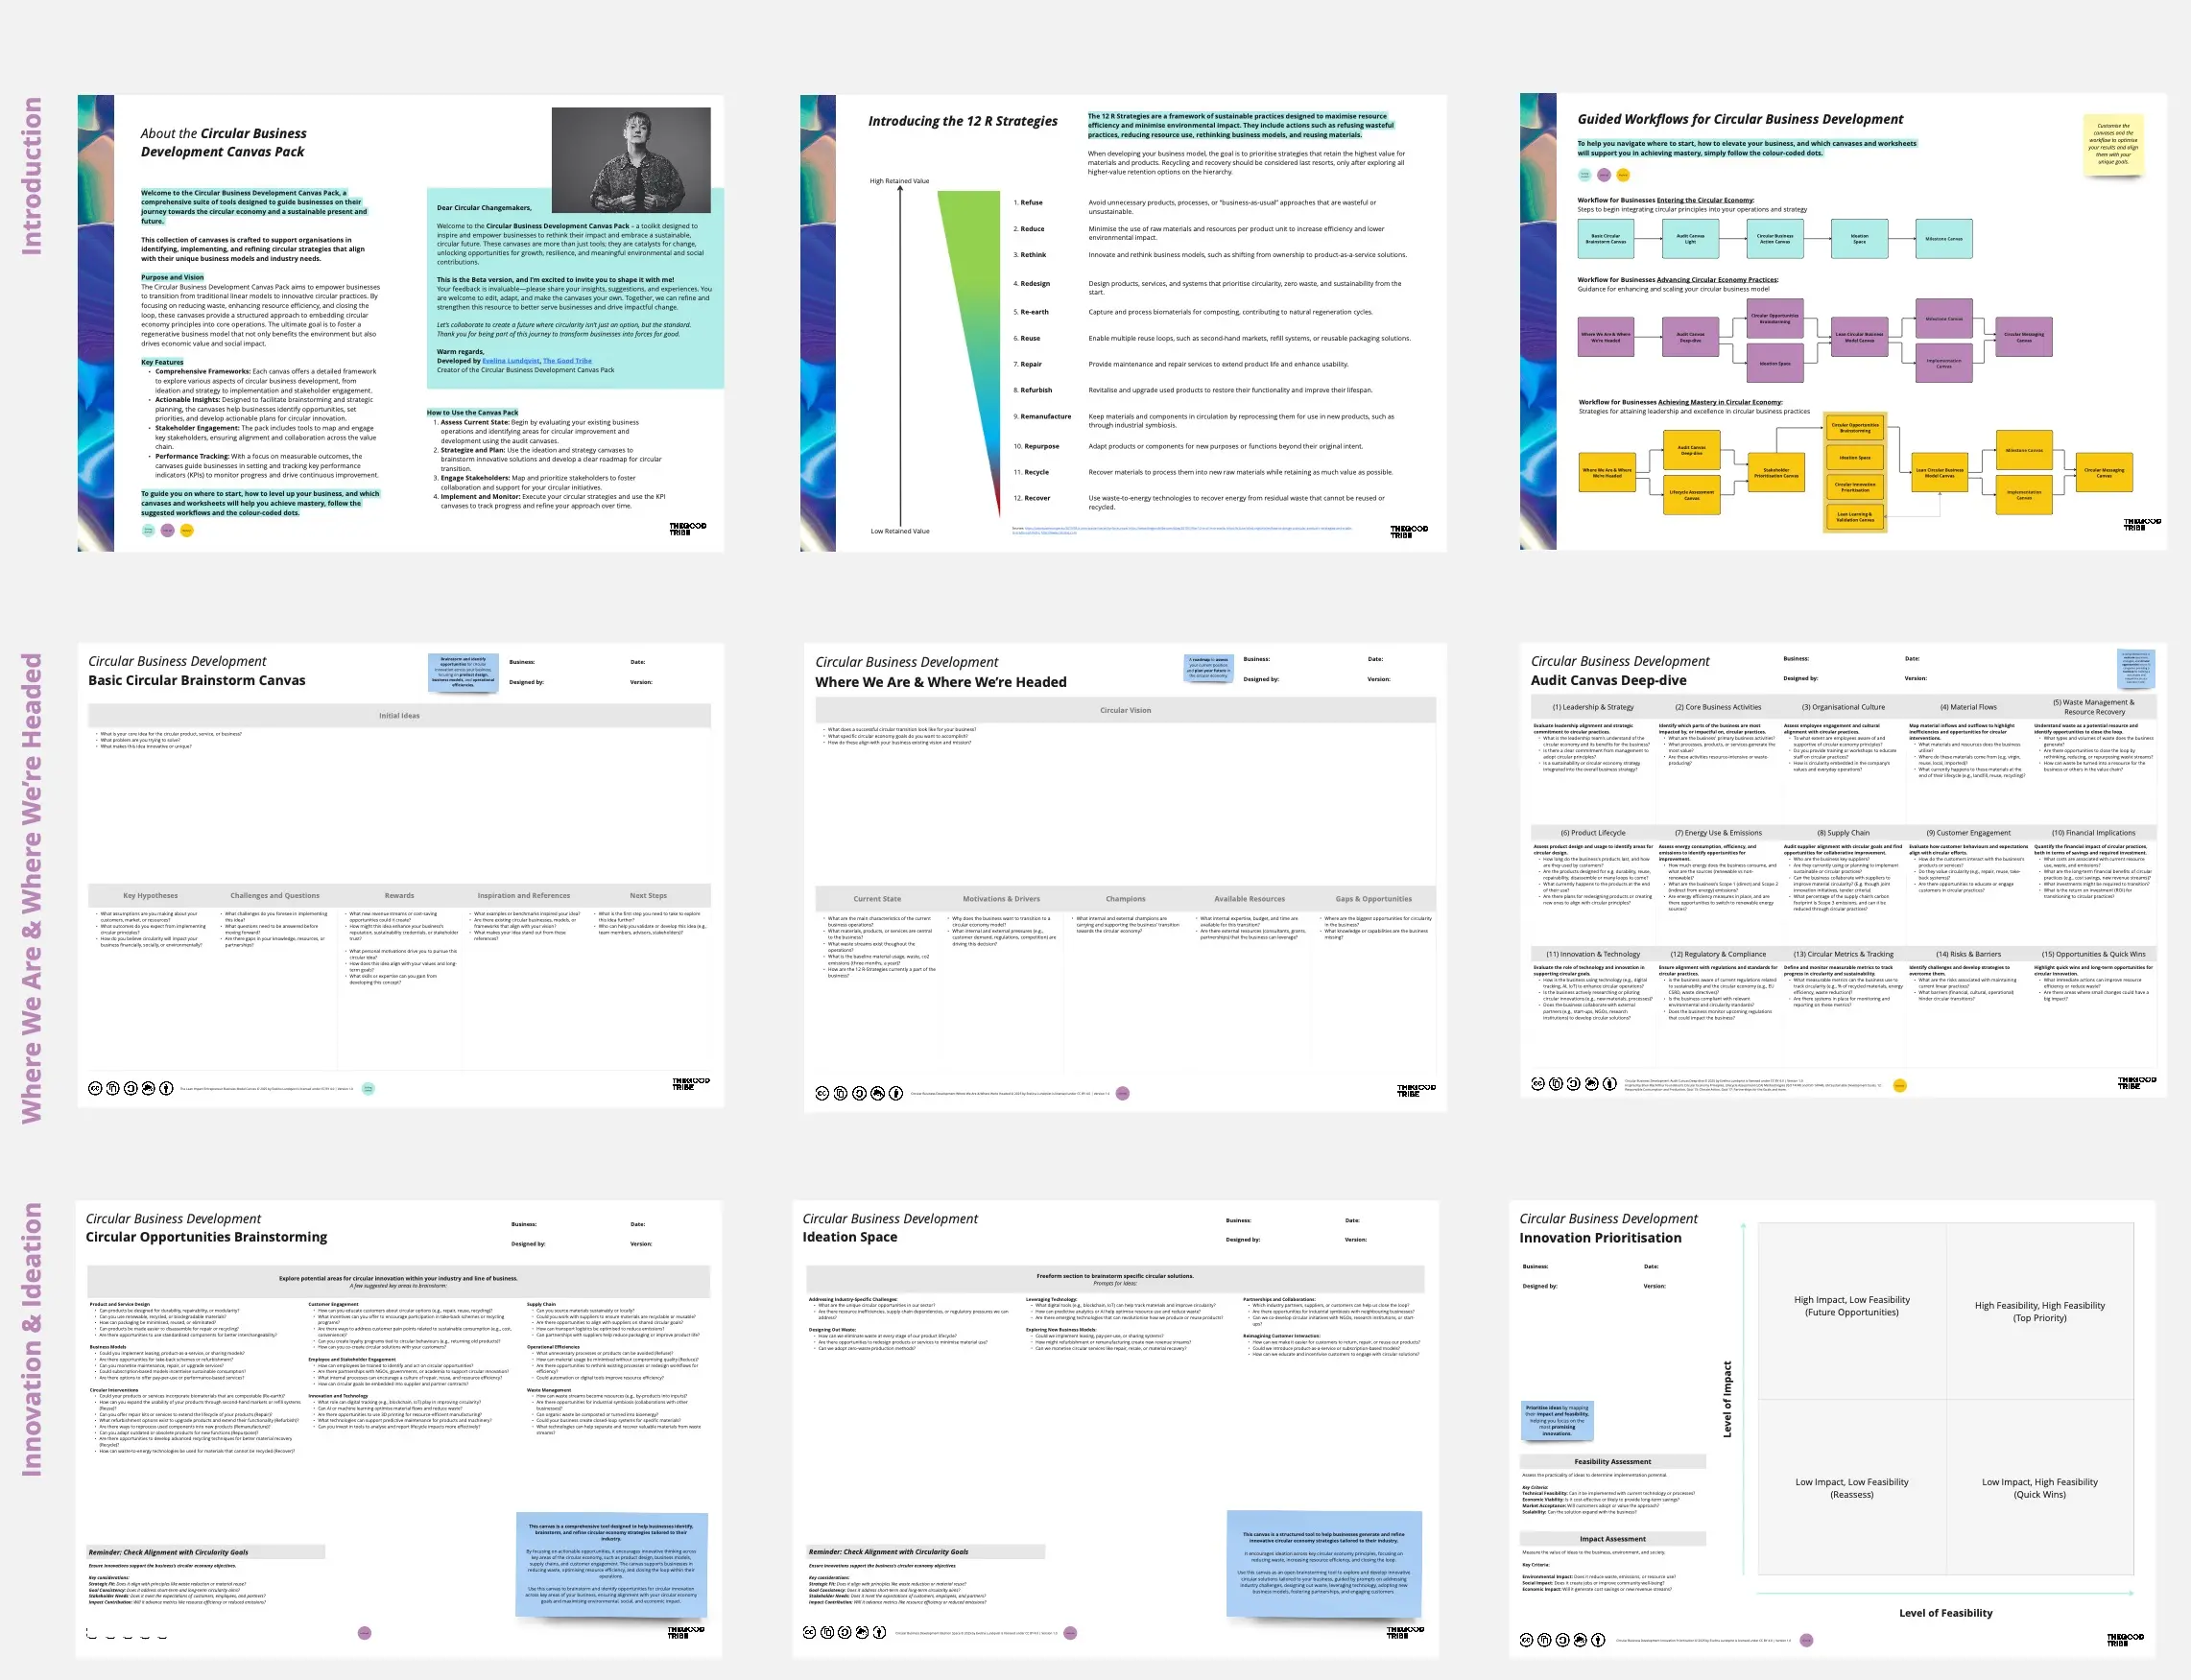
The Cost Benefit Analysis Charts template is a visual decision-making tool that helps you compare project costs with expected benefits at a glance. By combining simple charts with key project information, it makes it easy to communicate value, identify trade-offs, and support informed investment decisions.
Who is it for?
Ideal for project managers, business leaders, consultants, sustainability teams, entrepreneurs, and anyone preparing a business case or evaluating a new initiative.
How to use it
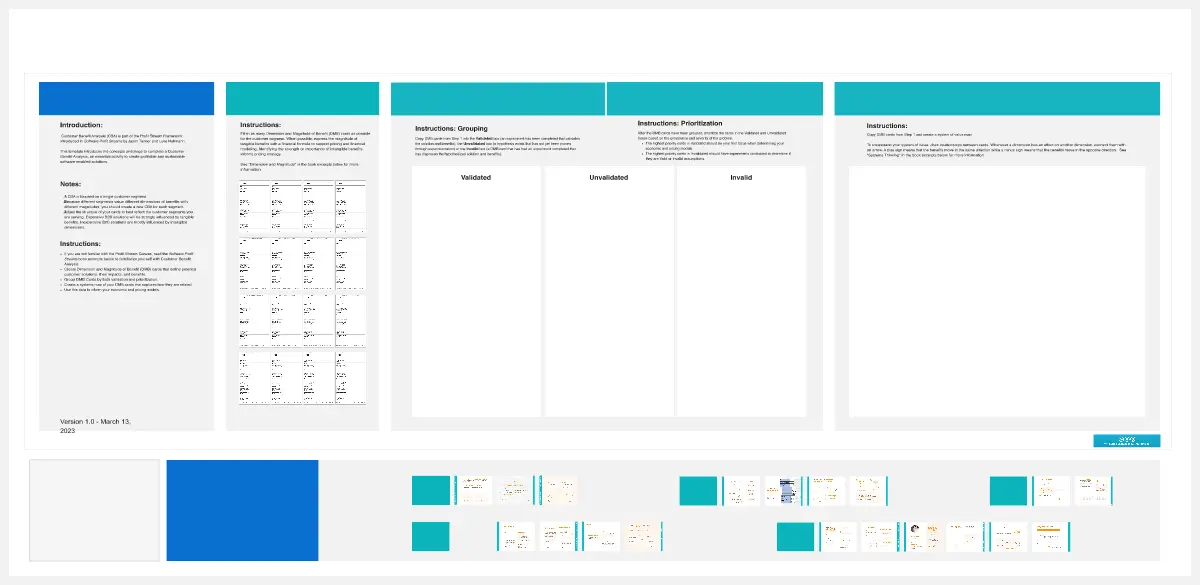
Start by defining your project goal, then list and quantify all expected costs and benefits. Update the totals as you refine your estimates and use the charts to visualise the overall balance between investment and value. The template is designed to make complex information easy to understand and presentation-ready.
Workshop suggestions
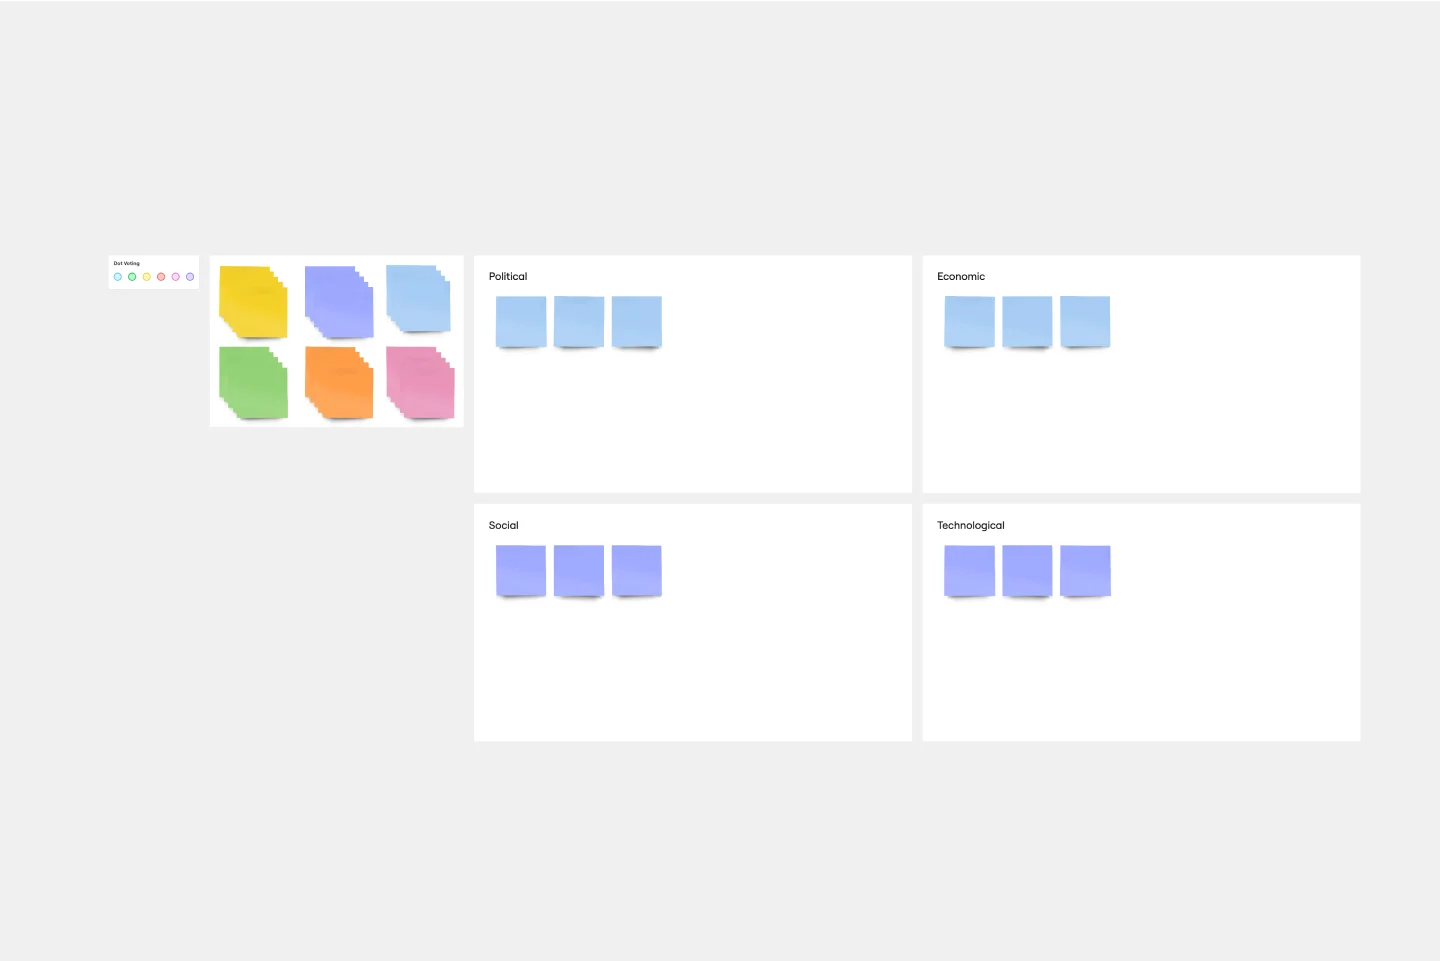
Use this template during business case development, project planning, investment reviews, sustainability workshops, or stakeholder meetings. Invite participants to brainstorm costs and benefits using sticky notes before grouping and transferring them into the charts. Discuss assumptions, compare different scenarios, and agree on the strongest path forward.
What is the output?
By the end of the exercise, you’ll have a clear visual summary of your project’s expected costs and benefits, a stronger foundation for decision-making, and presentation-ready charts that help communicate the business case to stakeholders.