ERD diagram
411 templates
Influence Diagram Template
1 likes91 uses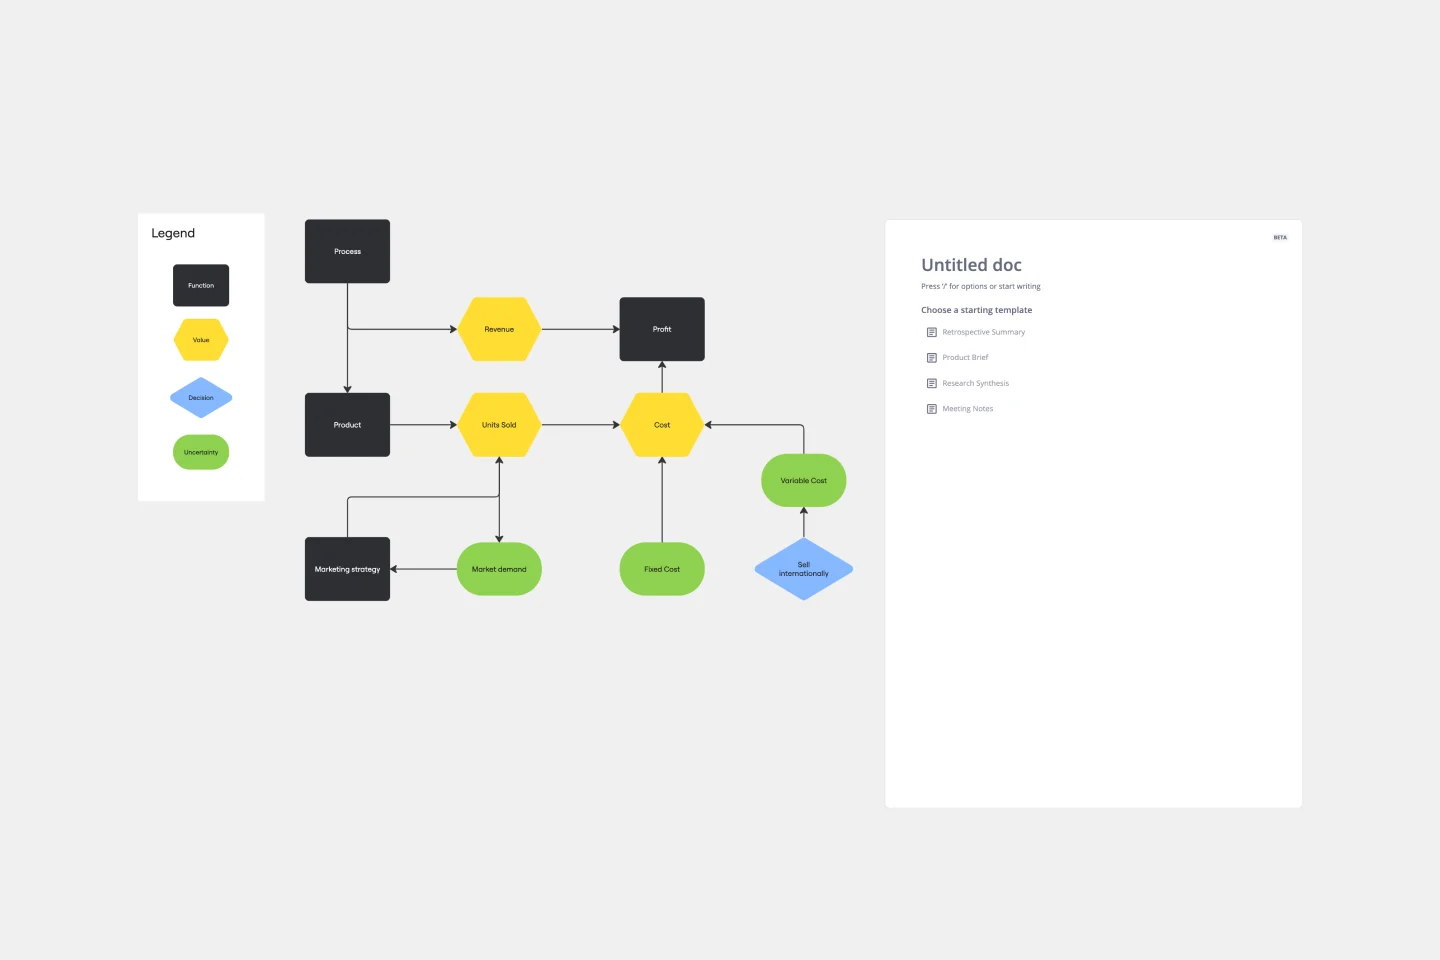
Influence Diagram Template
See the big picture of any business decision with this Influence Diagram Template. You’ll define the decision you have to make and brainstorm everything that could impact it. When you build connections between these factors, you’ll be able to put the right amount of weight into each one as you make your decision.
Driver Diagram Template
0 likes59 uses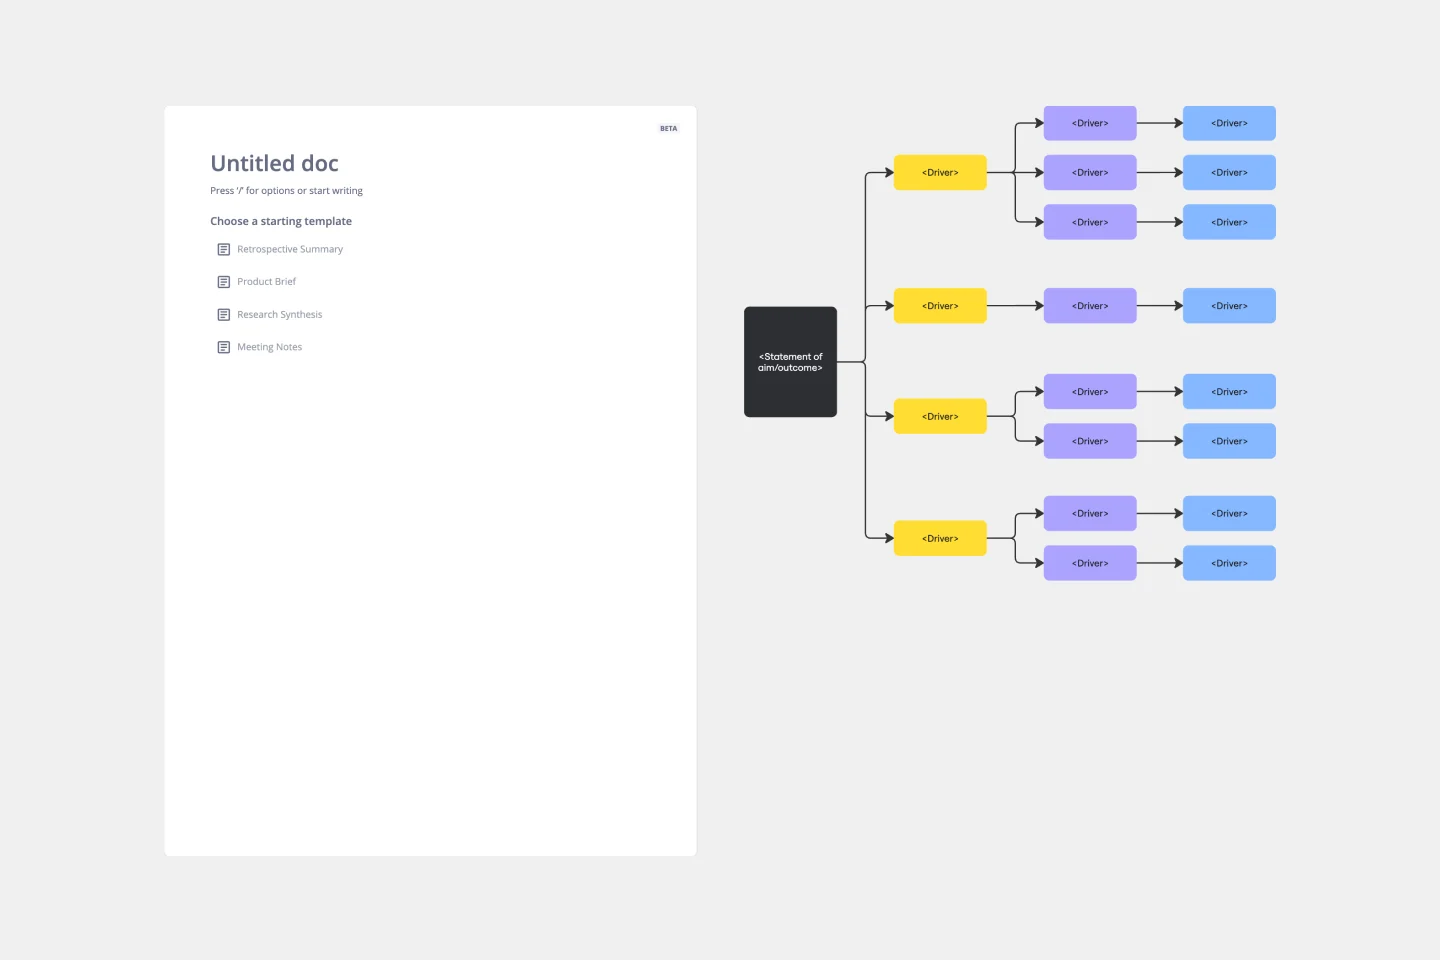
Driver Diagram Template
The driver diagram template is a strategic visual tool that helps teams map out their primary objectives and break them down into actionable components. It presents goals, drivers, and specific change ideas in a coherent and interconnected format, ensuring clarity of objective. By doing so, every team member is aligned towards a common endpoint, fostering unified efforts. The visual nature of the template simplifies complex objectives, making it easier for teams to stay on track and measure their progress effectively.
Tree Diagram Template
4 likes456 uses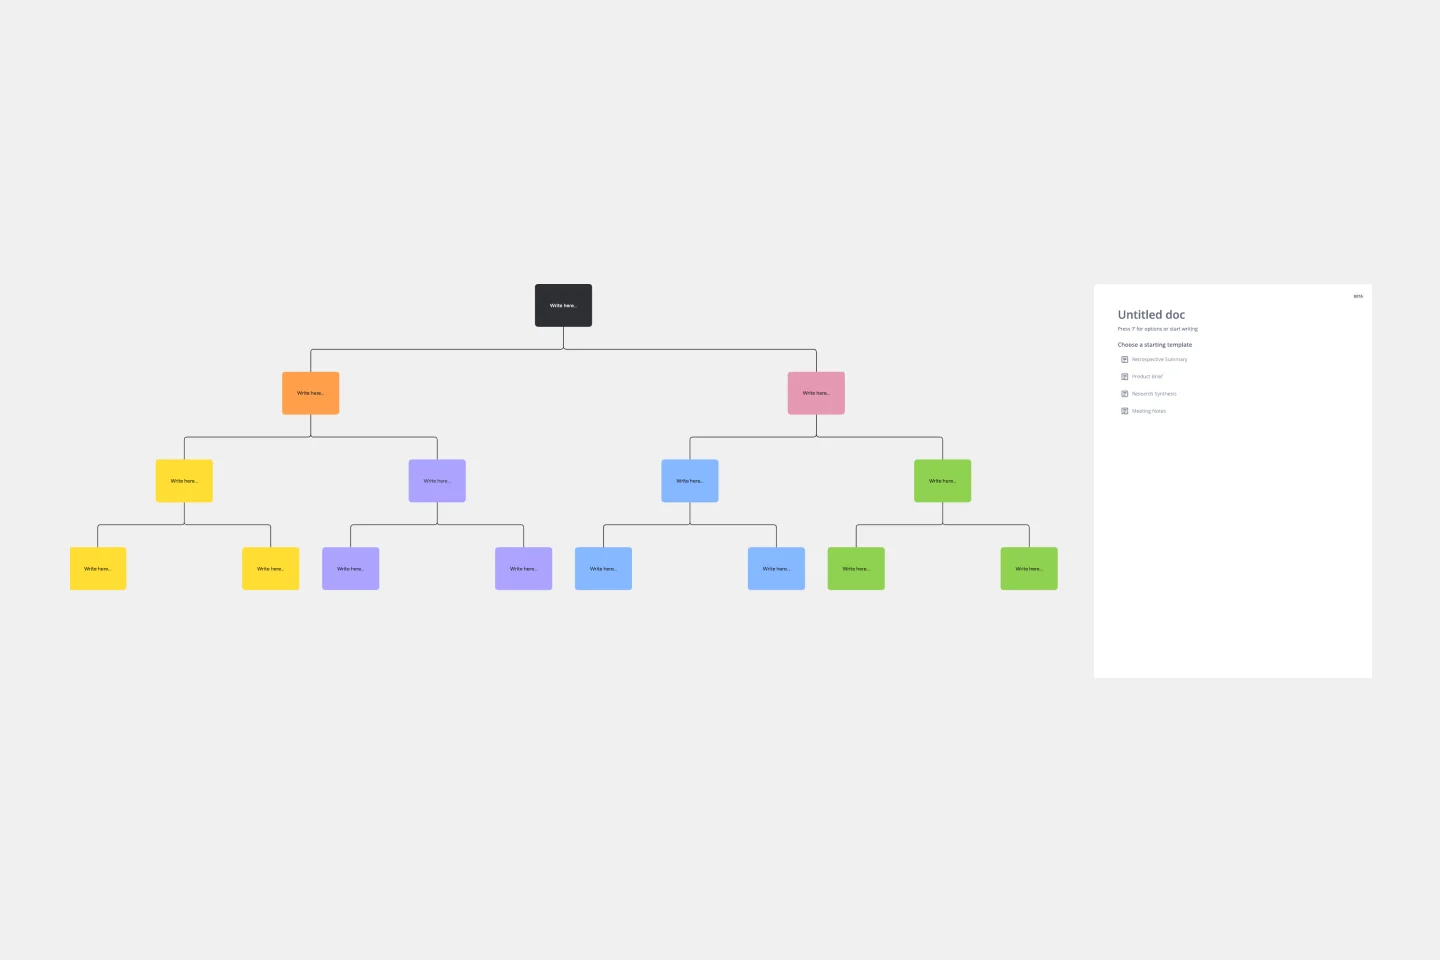
Tree Diagram Template
The tree diagram template helps you organize and present complex information. One of its key benefits is its ability to provide unparalleled visual clarity. It enables you to simplify complicated ideas into a structured, hierarchical format, making it easier to understand and communicate. This template enhances brainstorming sessions, project planning, and decision-making processes by mapping out relationships and dependencies clearly and effortlessly. You can now say goodbye to information overload and immerse yourself in a visual journey that simplifies complexity with the tree diagram template.
Spaghetti Diagram Template
2 likes420 uses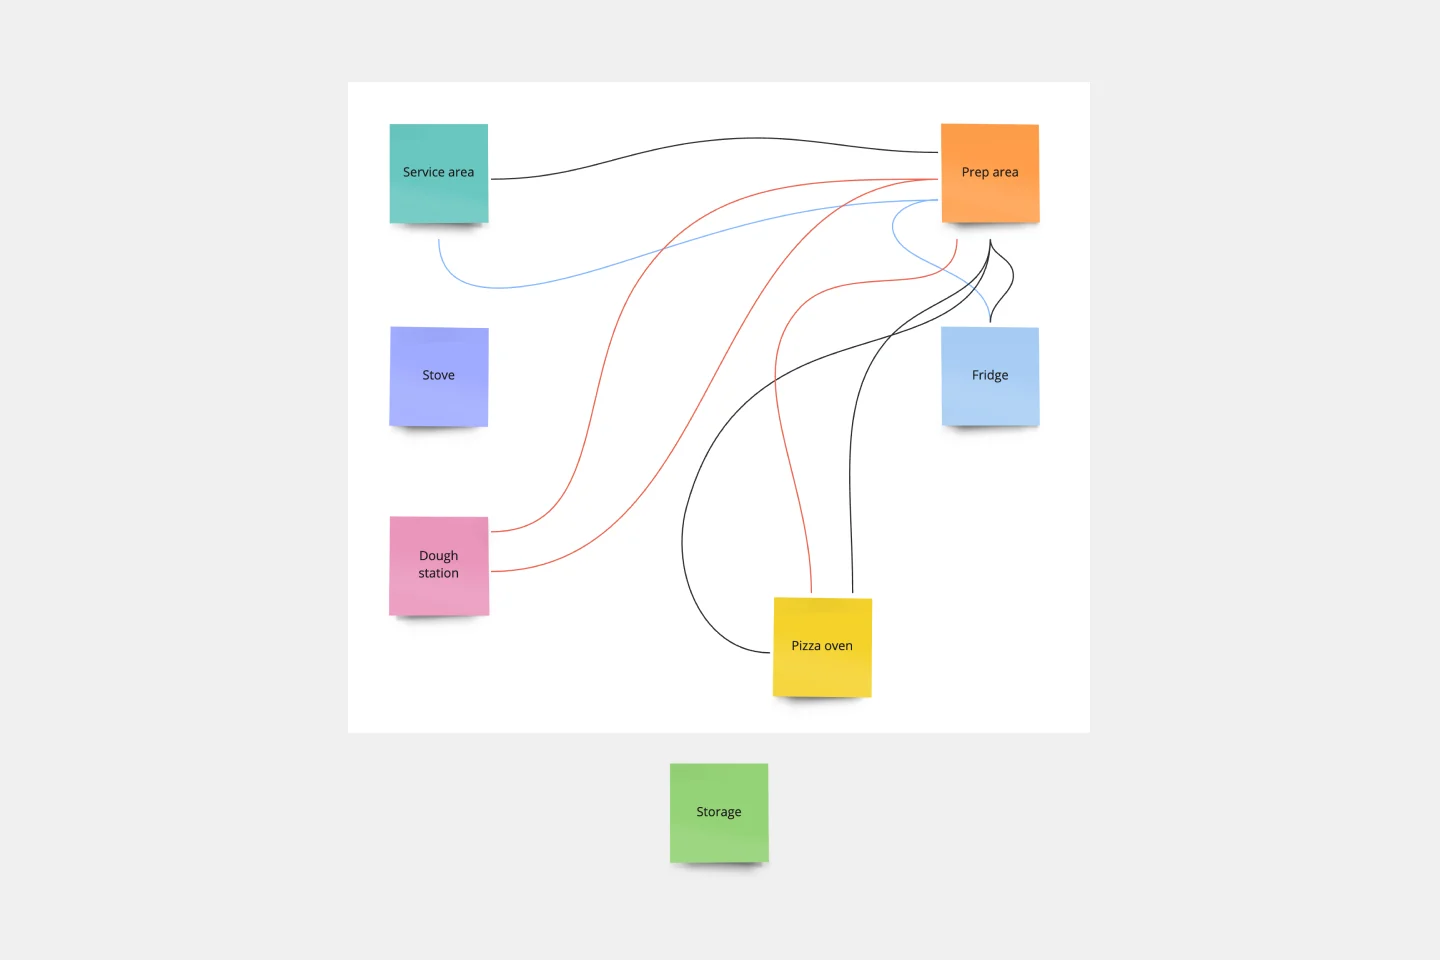
Spaghetti Diagram Template
Spaghetti diagrams are valuable for finding connections between assets, services, and products, as well as identifying dependencies in a visual way. Use this template to get an overview of a process and quickly find areas of improvement.
Cluster Diagram Template
8 likes545 uses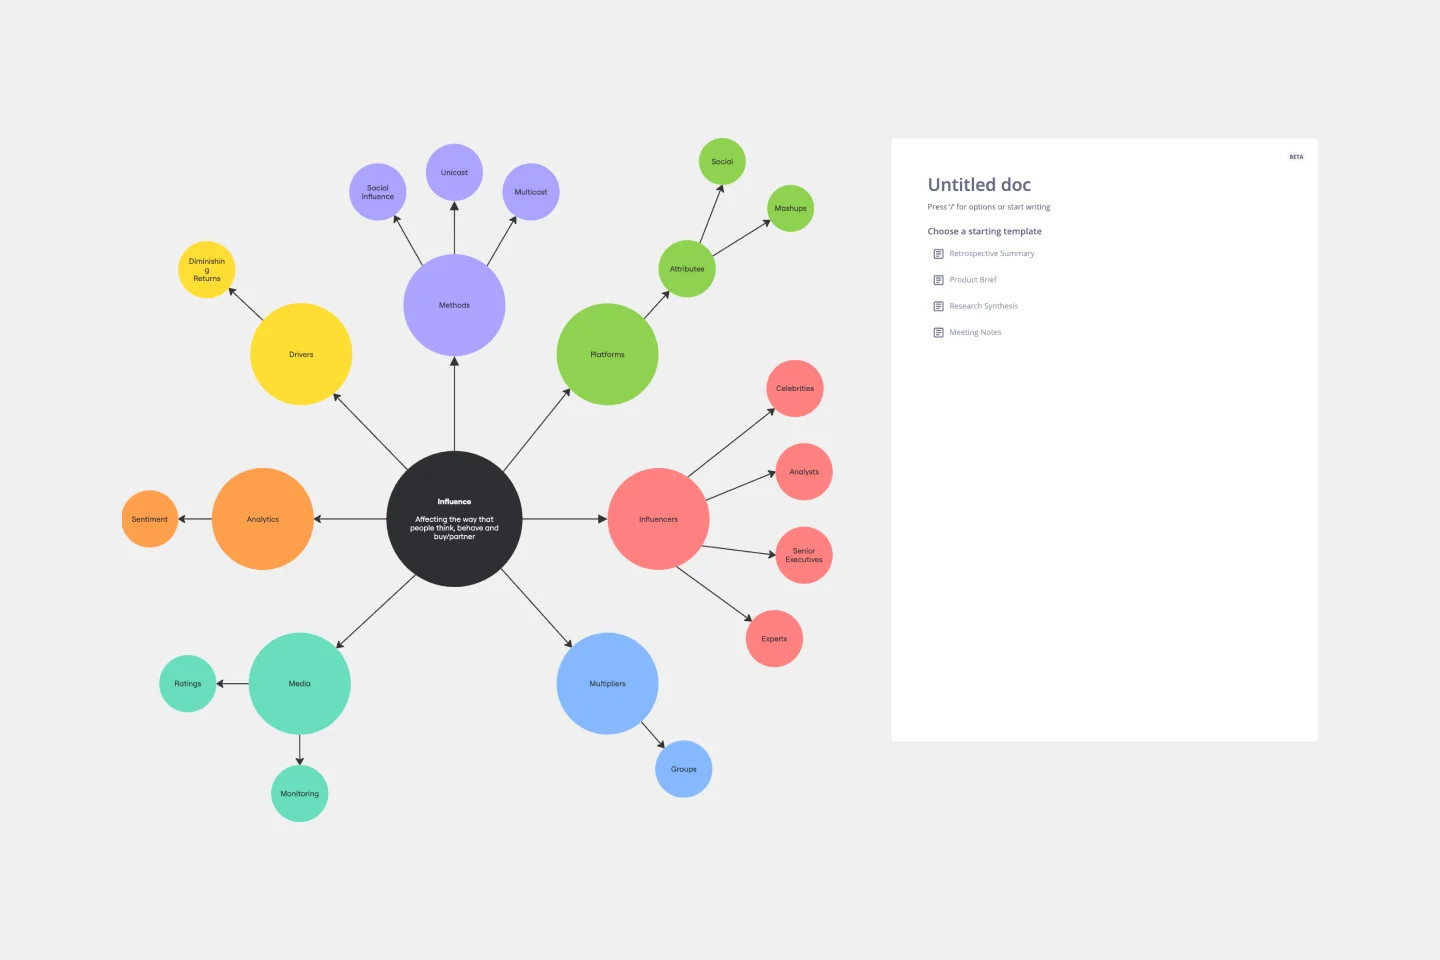
Cluster Diagram Template
The Cluster Diagram Template is a valuable tool for organizing and connecting ideas, concepts, and information in a visually compelling and coherent manner. The template's design centers on grouping related ideas around a core concept, creating a transparent and hierarchical structure. This clustering not only aids in breaking down complex information into manageable segments but also significantly enhances the process of idea generation and brainstorming. A structured yet flexible visual framework encourages deeper engagement and more precise understanding, making it an essential asset for teams and people looking to bring order to their creative and analytical processes.
Turtle Diagram Template
3 likes163 uses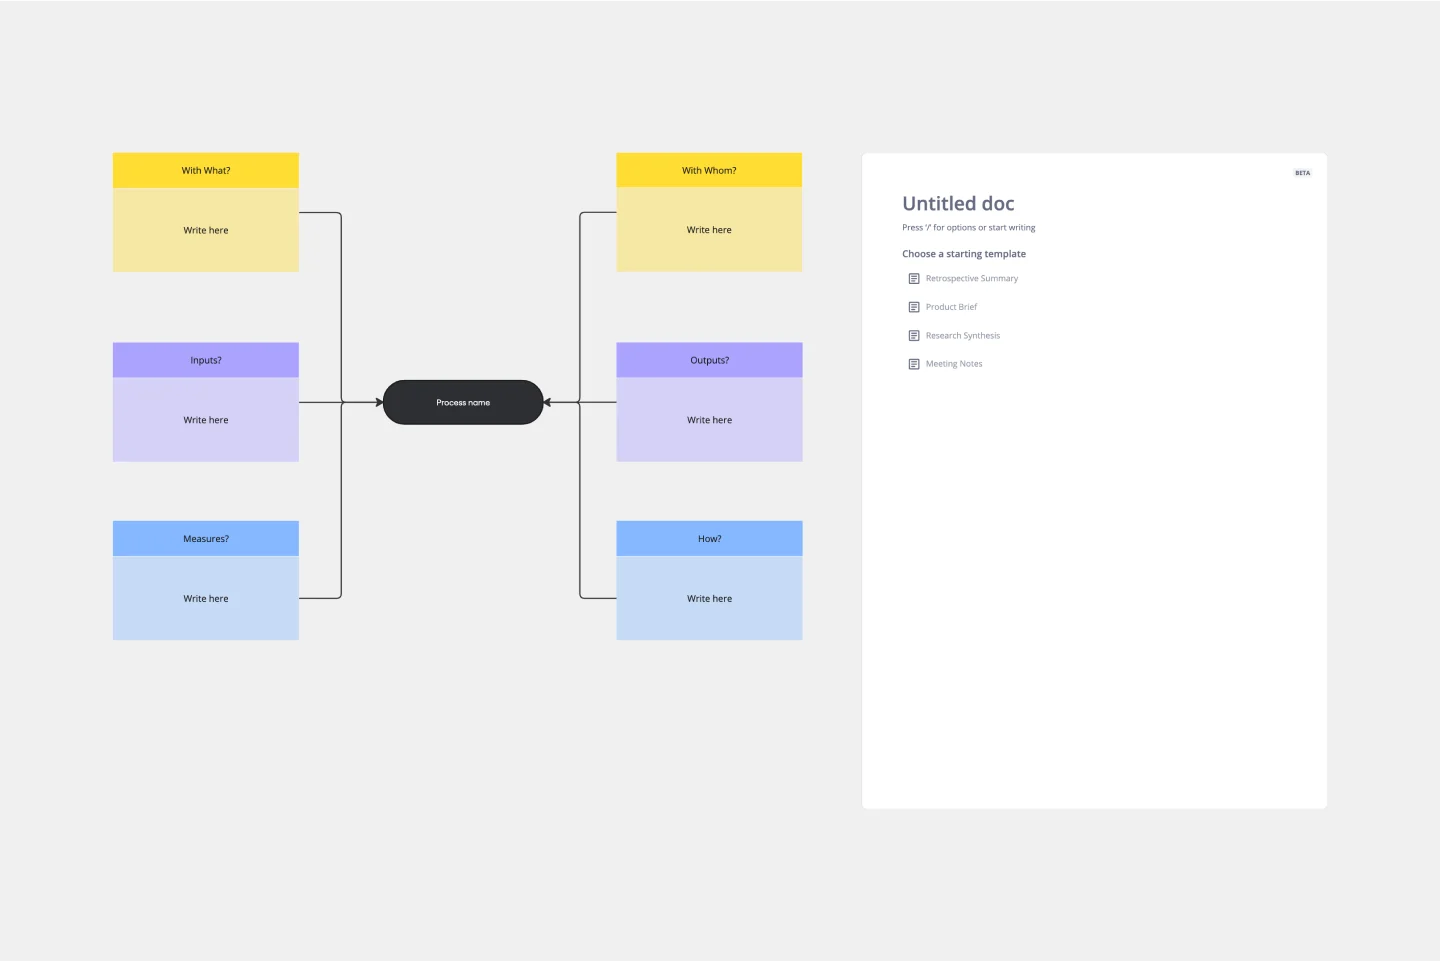
Turtle Diagram Template
The Turtle Diagram Template is an essential tool for capturing the essence of a process. It offers many benefits, but one stands out: it fosters clear and comprehensive communication within teams. By breaking down processes into digestible components, the template creates a common ground for discussion. It helps team members unfamiliar with certain processes or from different departments collaborate effectively by ensuring everyone's on the same page about the inputs, outputs, roles, resources, and procedures. This is crucial for organizations that aim to maintain coherence in quality management practices and drive collective efforts toward operational excellence.
Workflow Diagram Template
0 likes117 uses
Workflow Diagram Template
The Workflow Diagram Template maps out and represents processes or systems using standardized symbols and shapes. By delineating the various steps or stages in a process, it ensures that tasks flow seamlessly from initiation to completion. One of the standout benefits of using this template is its clarity. By translating processes into a visual format, all participants can gain a comprehensive understanding at a glance, eliminating confusion and ensuring everyone is on the same page. This clarity not only promotes efficient task execution but also fosters collaboration among team members.
Swimlane Diagram Template
13 likes1.7K uses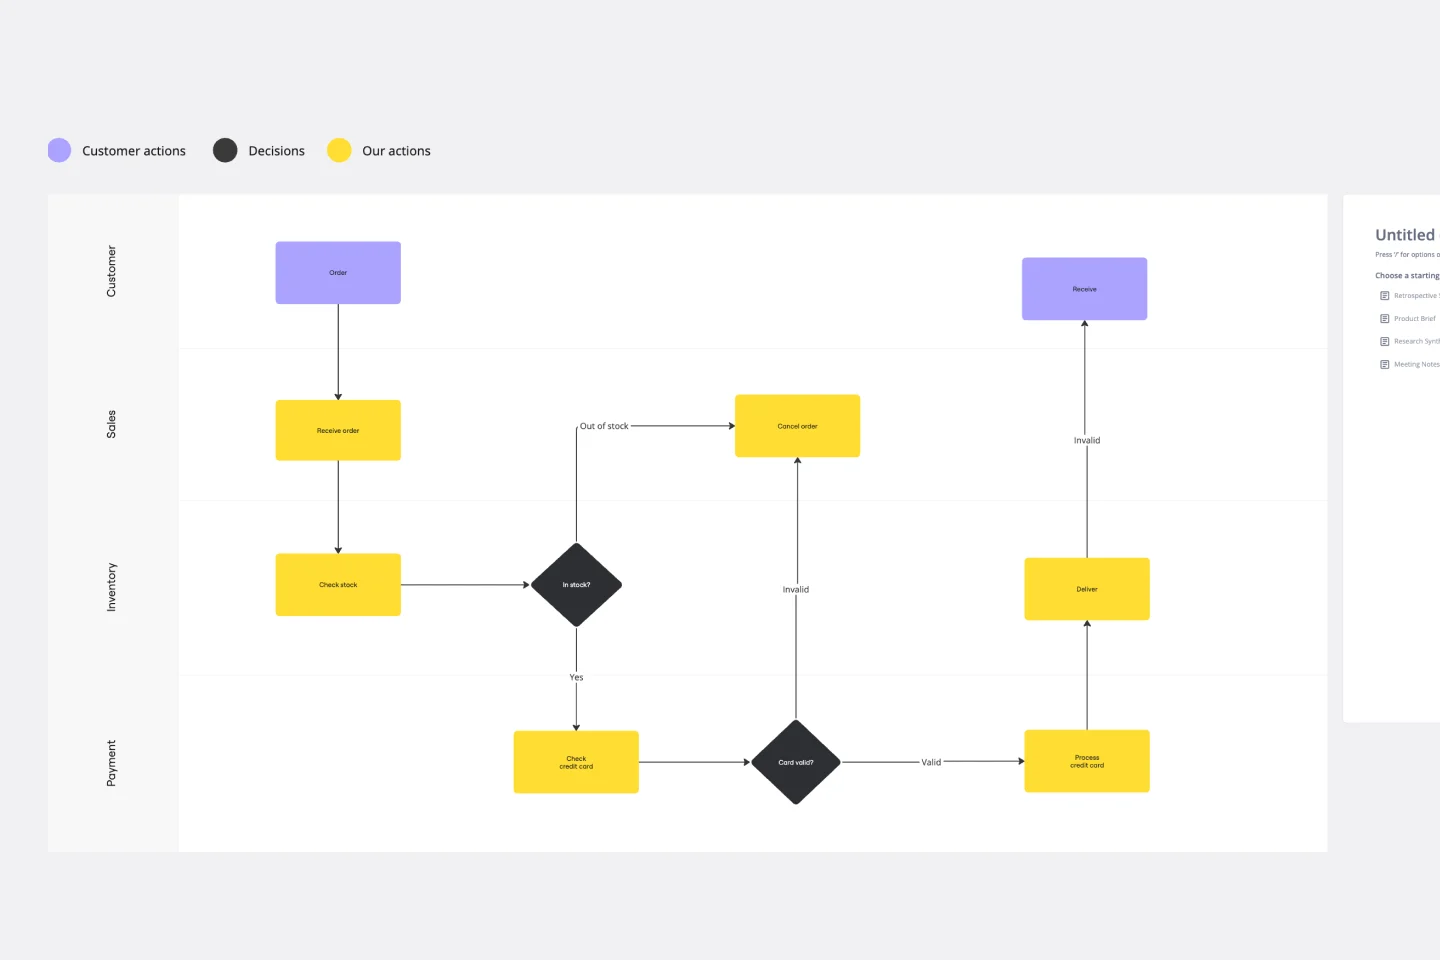
Swimlane Diagram Template
A swimlane diagram shows you which stakeholders are responsible for each area of your critical processes. You can use it to understand current processes or plan new ones.
Pyramid Diagram Template
0 likes685 uses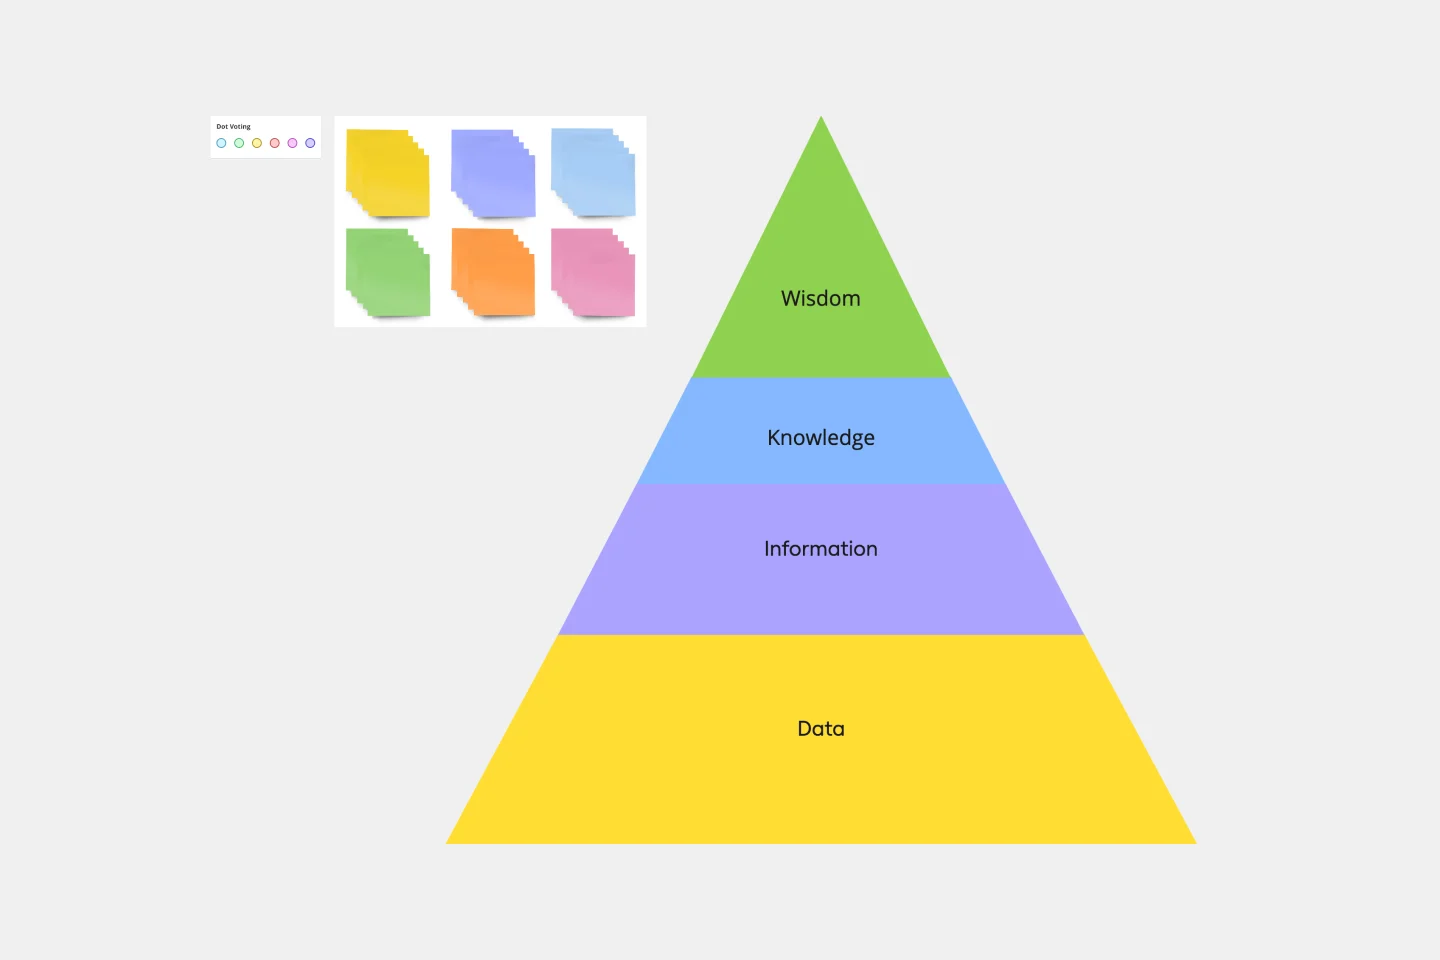
Pyramid Diagram Template
A pyramid diagram is a perfect tool for demonstrating concepts that can be broken down into a layered hierarchy. Each level of the pyramid builds on the one before it, clearly illustrating how certain actions lead to specific results. The Miro Pyramid Diagram template is your tool for any and all pyramid illustrations.
Block Diagram Template
1 likes195 uses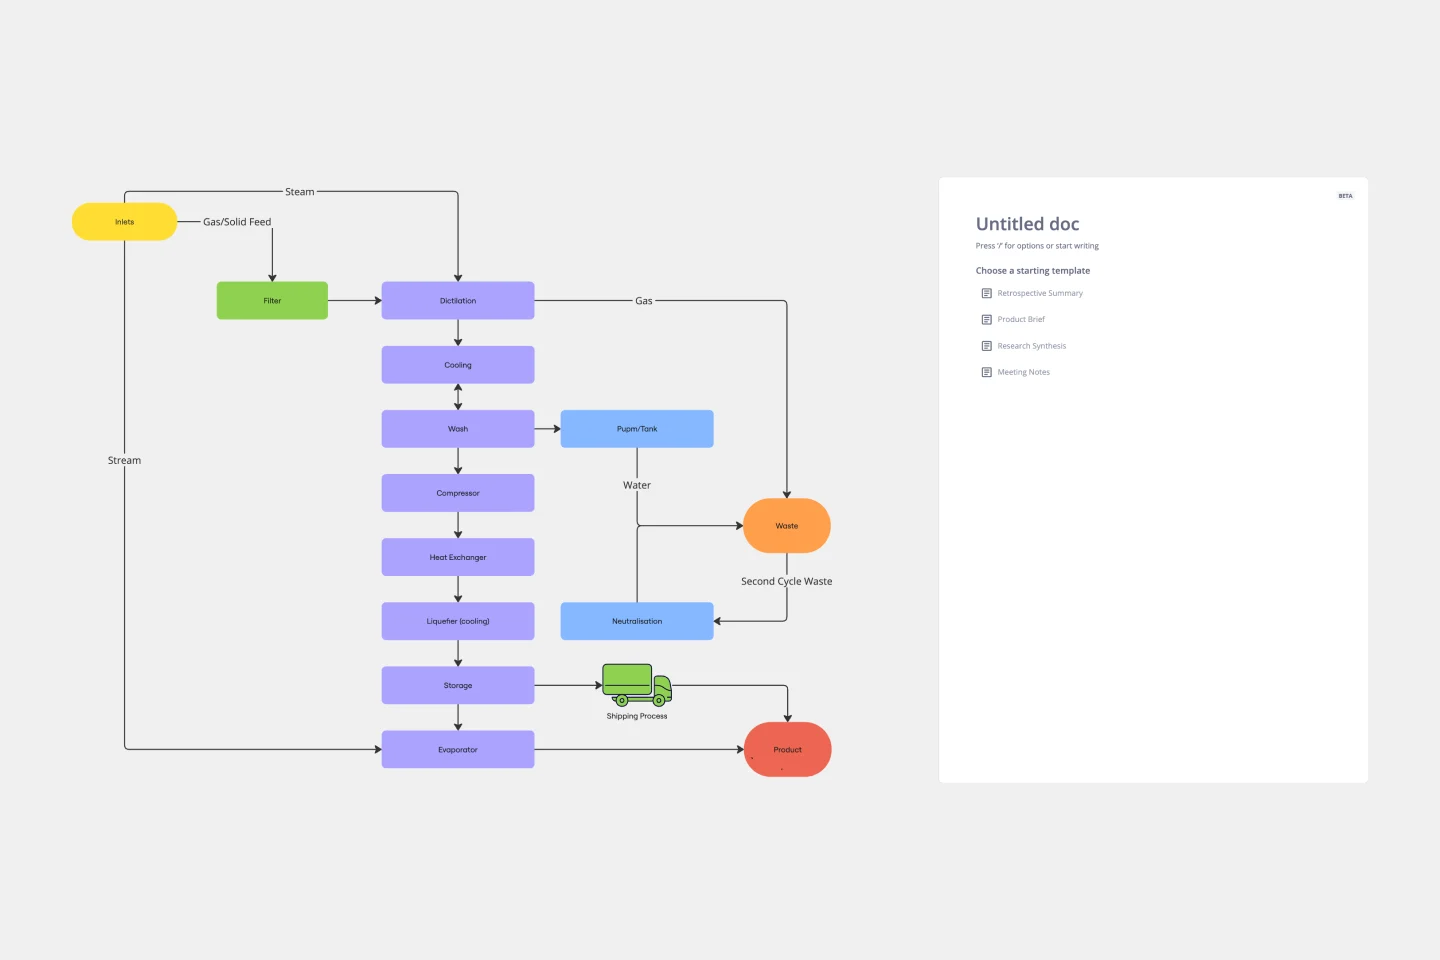
Block Diagram Template
Use this template to illustrate technical systems. Blocks represent important objects in the system, and arrows demonstrate how the objects relate to each other. Perfect for engineers, workflow managers, or anyone trying to build a better process.
Cisco Network Diagram Template
1 likes206 uses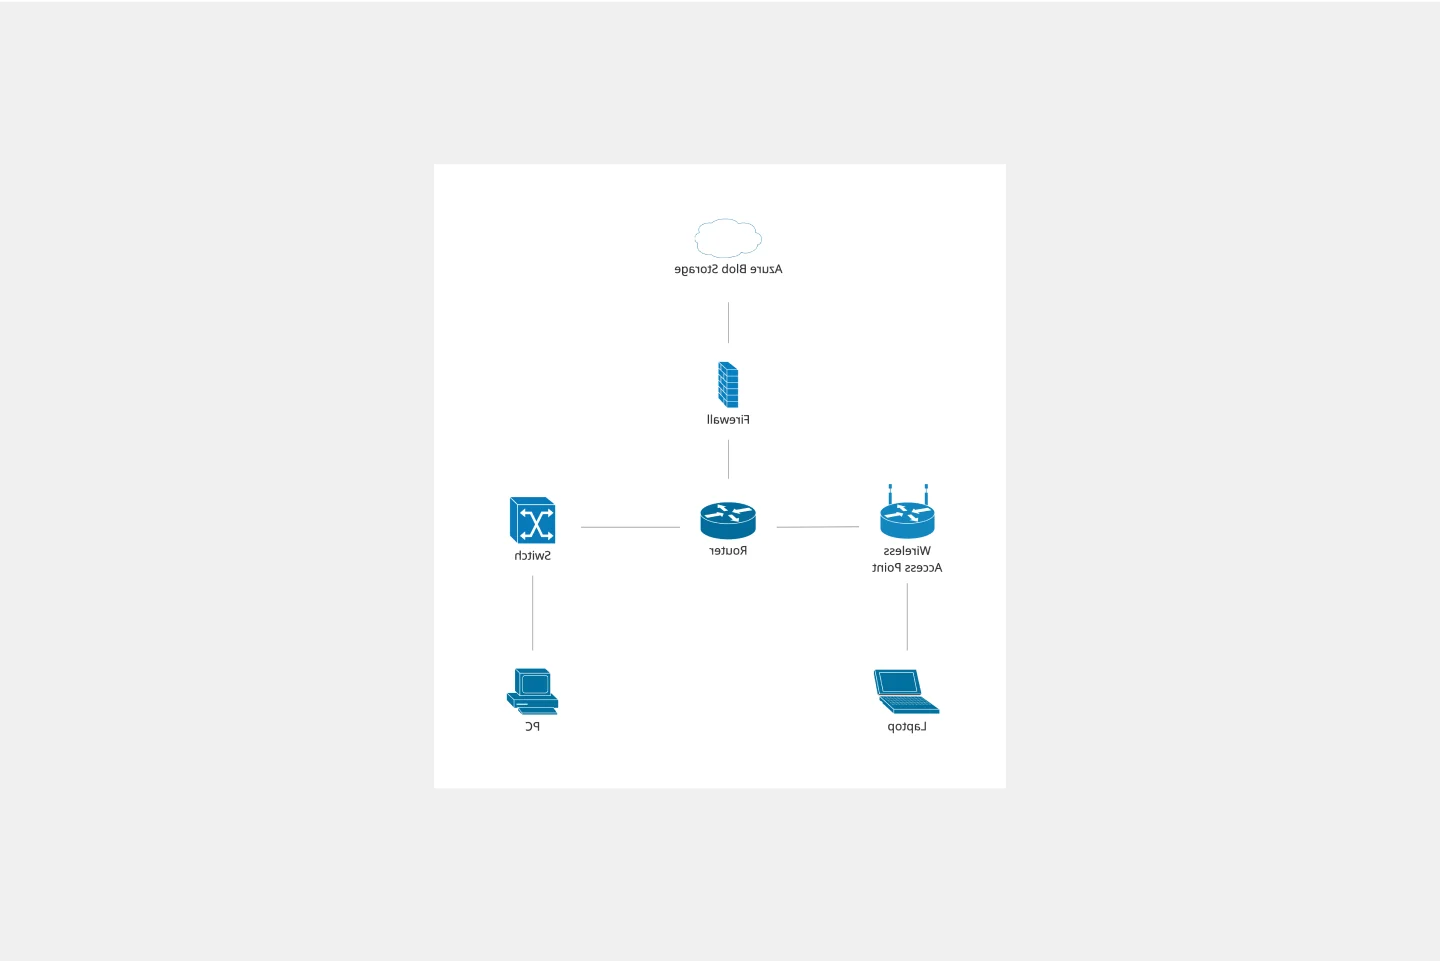
Cisco Network Diagram Template
Cisco offers data center and access networking solutions built for scale with industry-leading automation, programmability, and real-time visibility. The Cisco Data Network Diagram uses Cisco elements to show the network design of Cisco Data Networks visually.
Spider Diagram Template
1 likes190 uses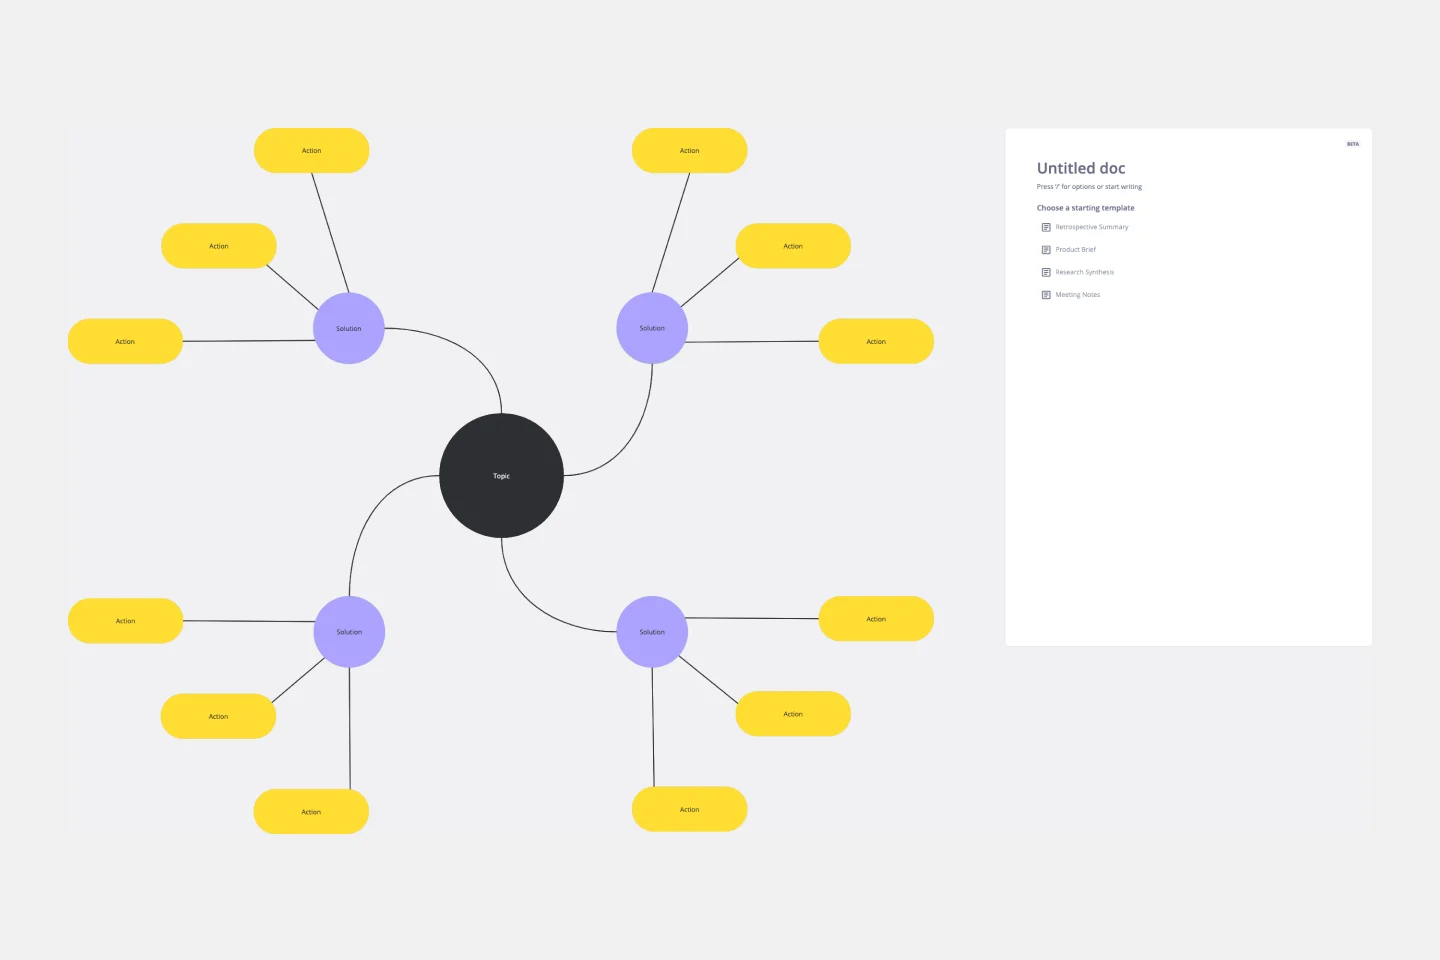
Spider Diagram Template
Perfect for brainstorming sessions, project planning, or simply organizing thoughts, the Spider Diagram Template allows you to create 'legs' branching out from a central idea, representing related topics or subtopics.
UML Use Case Diagram
16 likes429 uses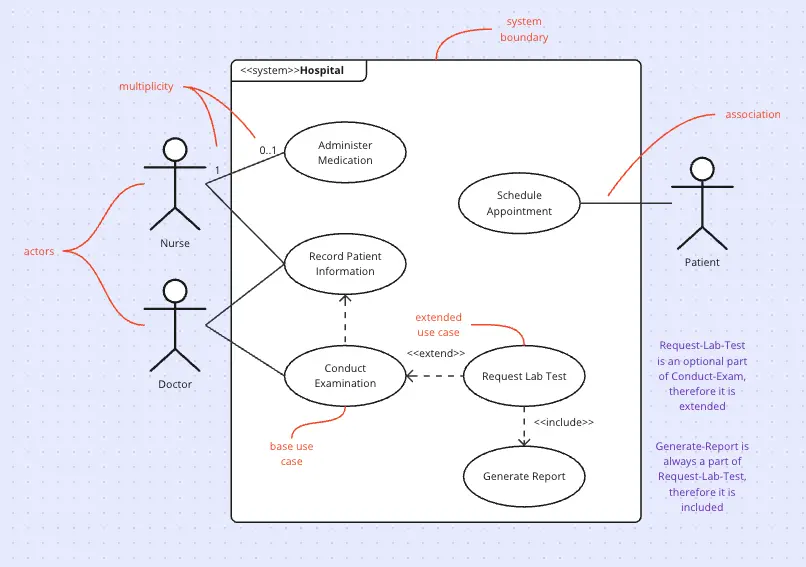
UML Use Case Diagram
Visualize system interactions with the UML Use Case Diagram. This template helps you map out user interactions and system processes, providing a clear overview of functional requirements. Ideal for software developers, business analysts, and project managers, it supports planning and communicating system functionalities. Use it to ensure all user scenarios are considered and to facilitate better design and implementation of software systems.
UML Sequence Diagram Template
4 likes647 uses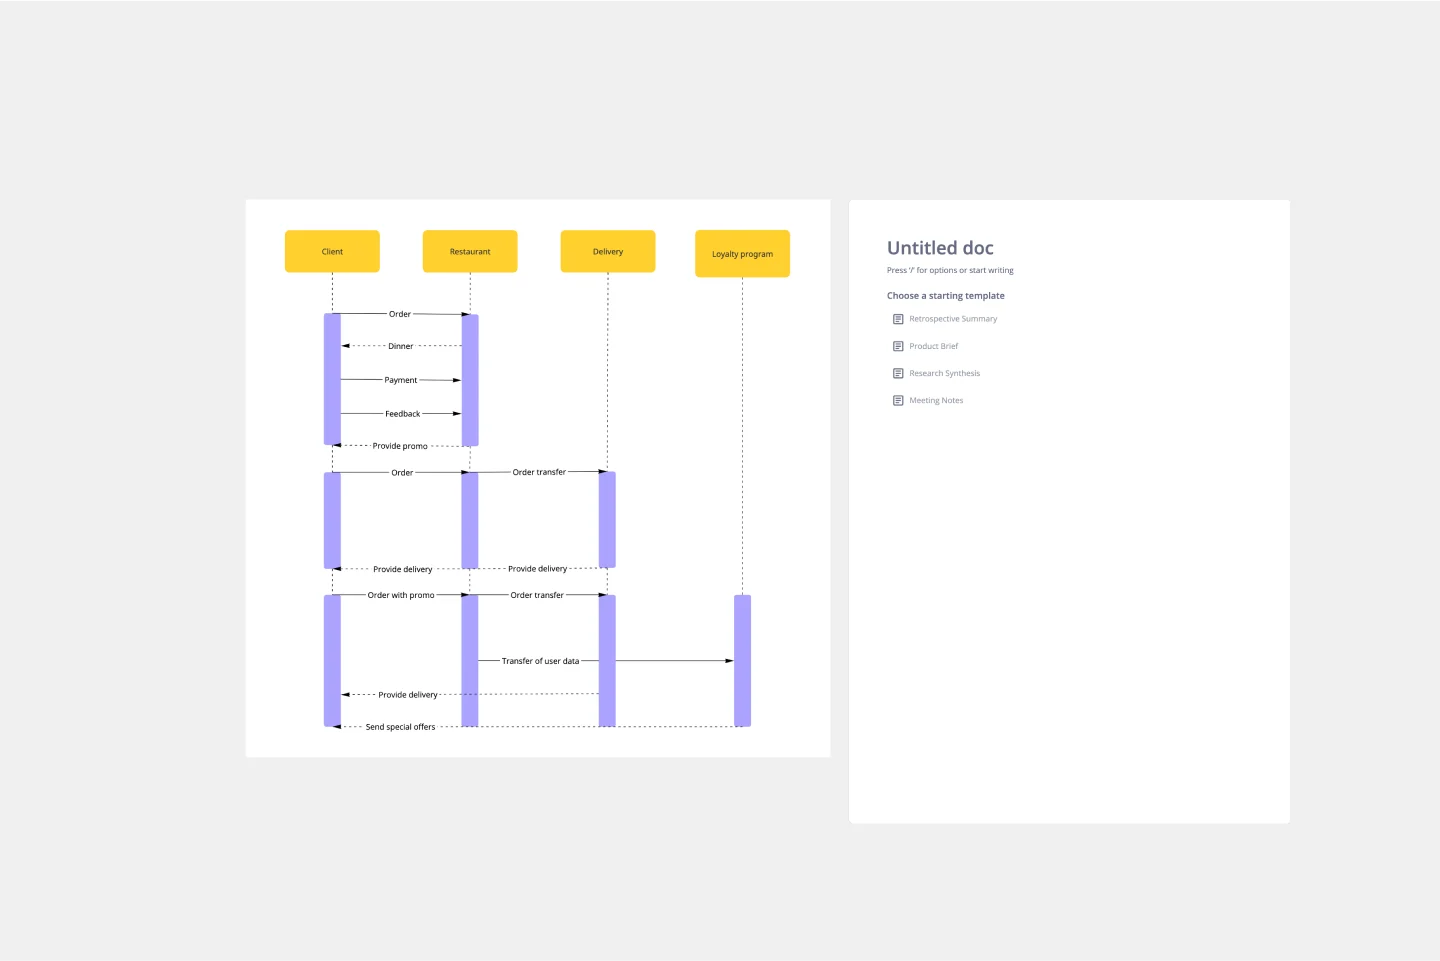
UML Sequence Diagram Template
Analyze and showcase how external entities interact with your system using a sequence diagram. Get a bird’s-eye view of your work processes, business functions, and customer interactions using this diagram. Also, identify any potential problems early and solve them before implementation.
Enterprise Diagramming Toolkit
38 likes93 usesUML Class Diagram Template
1 likes283 uses
UML Class Diagram Template
Get a template for quickly building UML class diagrams in a collaborative environment. Use the UML class diagram template to design and refine conceptual systems, then let the same diagram guide your engineers as they write the code.
Kubernetes Architecture Diagram Template
3 likes111 uses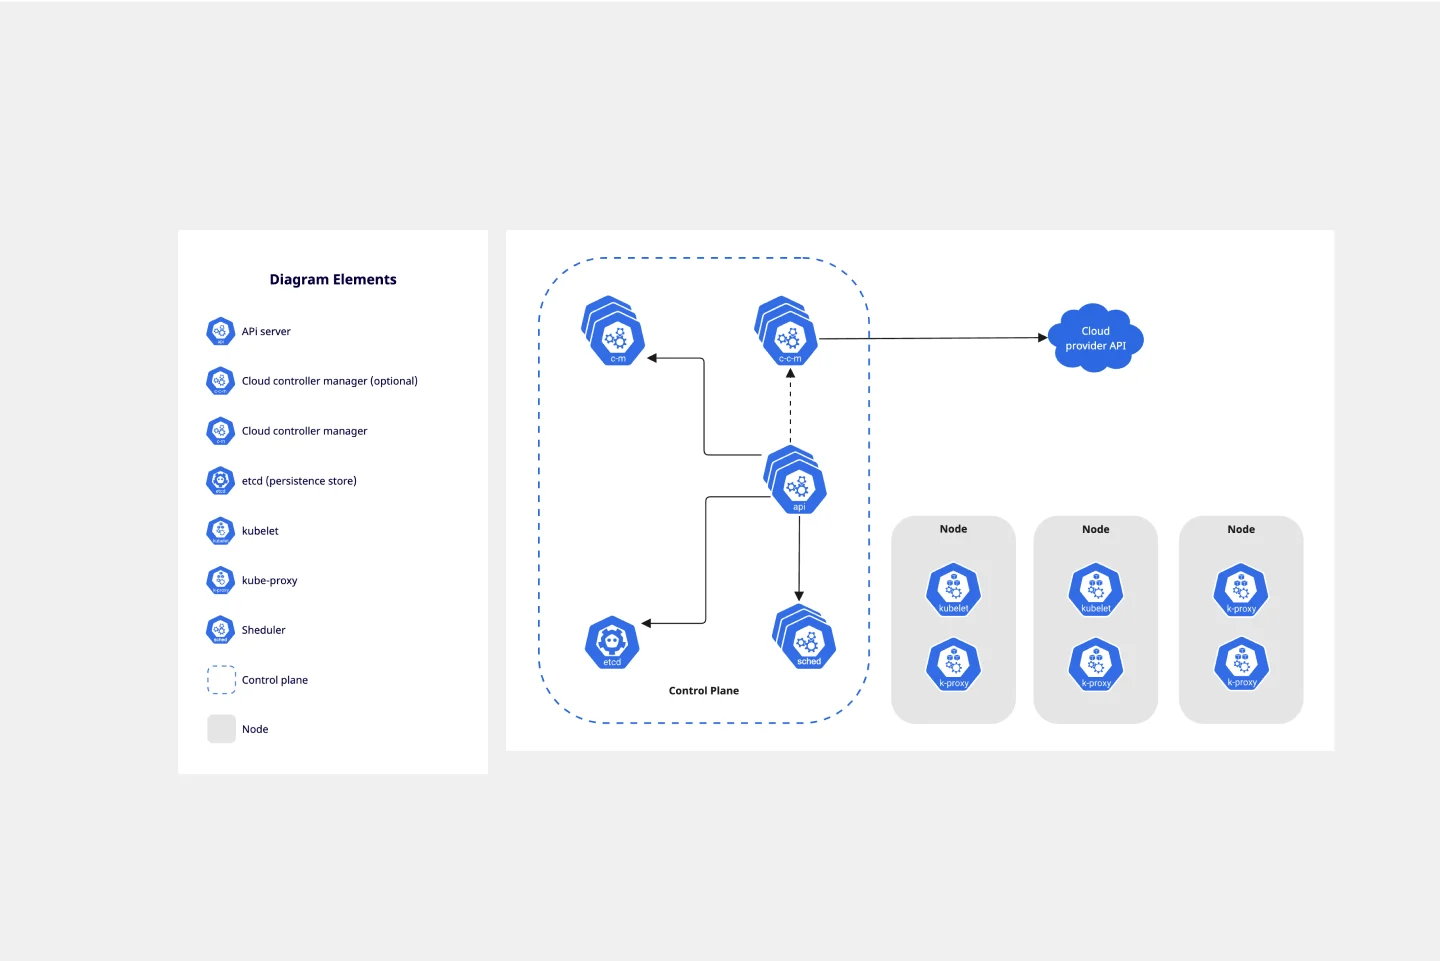
Kubernetes Architecture Diagram Template
Use the Kubernetes Architecture Diagram template to manage your containerized applications better and bring your apps’ deployment, management, and scalability to the next level. This template helps you lower the downtime in production and allows you to have a more agile app production. Improve the deployment of your apps by visualizing every step of the process with the Kubernetes Architecture template. Try it out, and see if it works for you and your team.
Azure Architecture Diagram Template
5 likes273 uses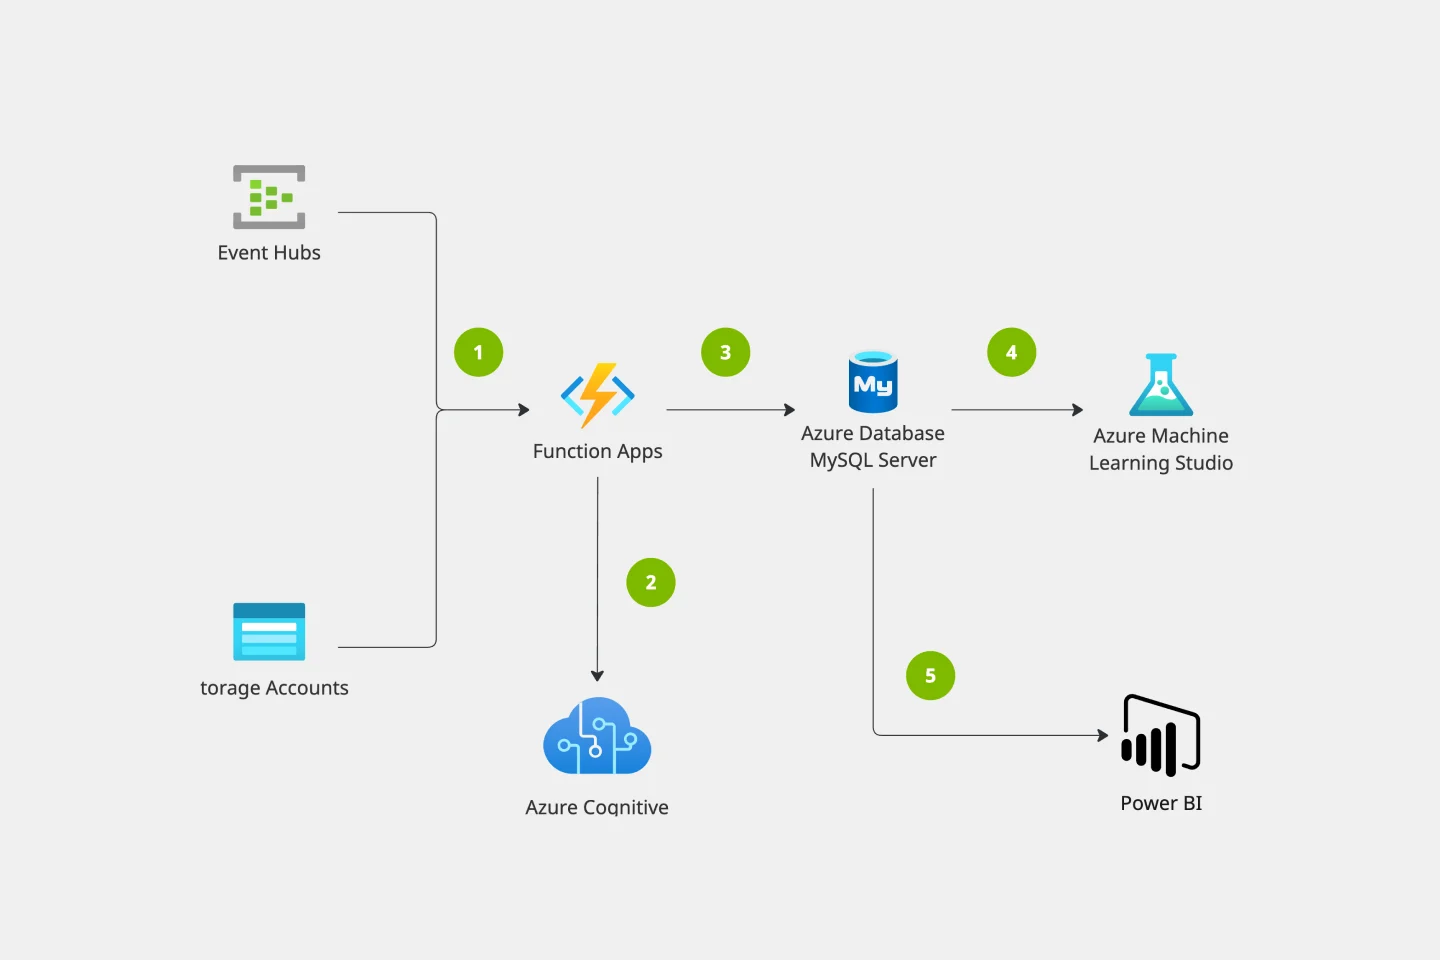
Azure Architecture Diagram Template
The Azure Architecture Diagram Template is a diagram that will help you visualize the combination of any data and build and deploy custom machine learning models at scale. Azure is Microsoft’s cloud computing platform, designed to provide cloud-based services such as remote storage, database hosting, and centralized account management. Use Azure Architecture Diagram template to build sophisticated, transformational apps.
AWS Architecture Diagram Template
10 likes1.5K uses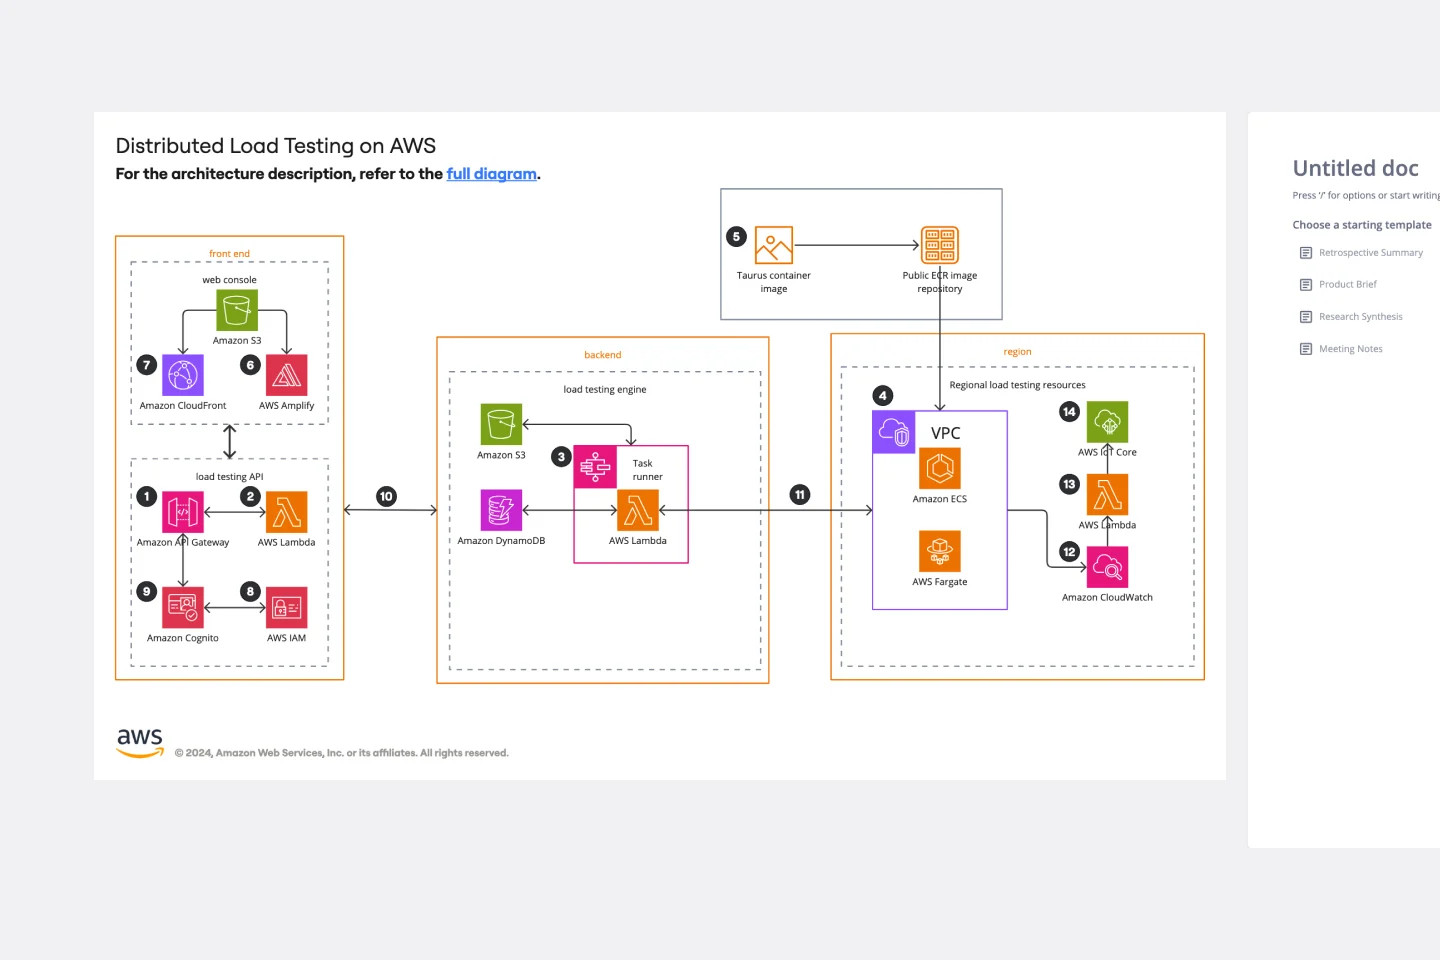
AWS Architecture Diagram Template
The AWS Architecture Diagram is a visual representation of the AWS framework, and it also translates the best practices when using Amazon Web Services architecture. You can now have an overview of your AWS architecture with Miro’s AWS Architecture Diagram Template, track your cloud solutions easily, and optimize processes like never before.
UML Communication Diagram Template
1 likes56 uses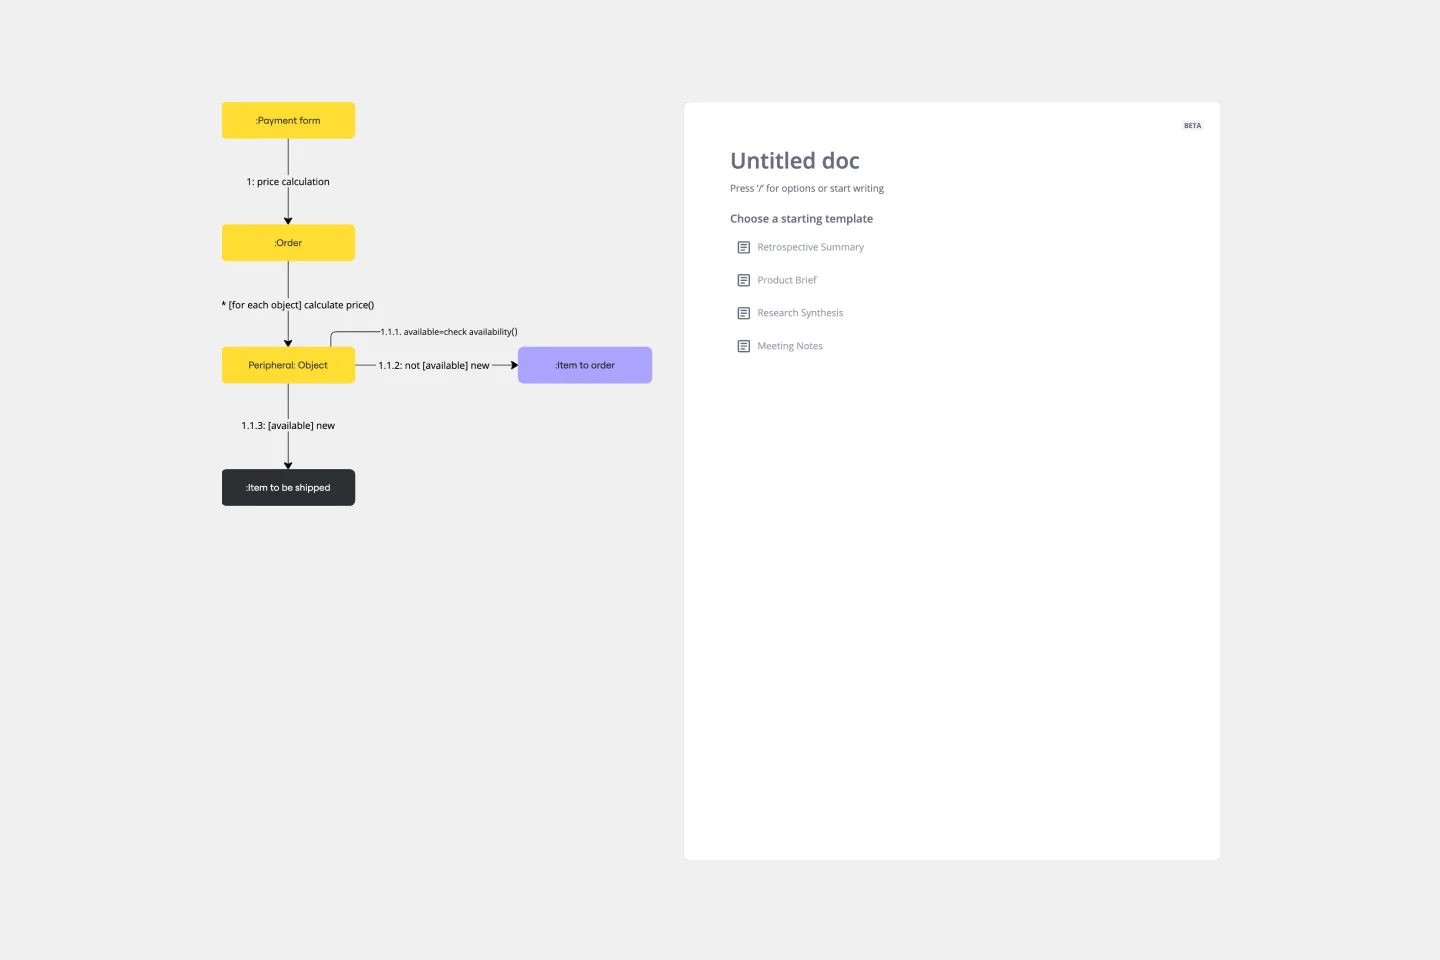
UML Communication Diagram Template
Most modern programs consist of many moving parts working to a precise set of instructions. With a communication diagram, you can visualize exactly how those parts work together, giving you a clearer understanding of your program as a whole. What’s more, the diagram leaves spaces for expanding the network of relationships as your product grows and evolves. A communication diagram is a vital tool in any software designer’s arsenal.
Supply Chain Diagram Template
0 likes314 uses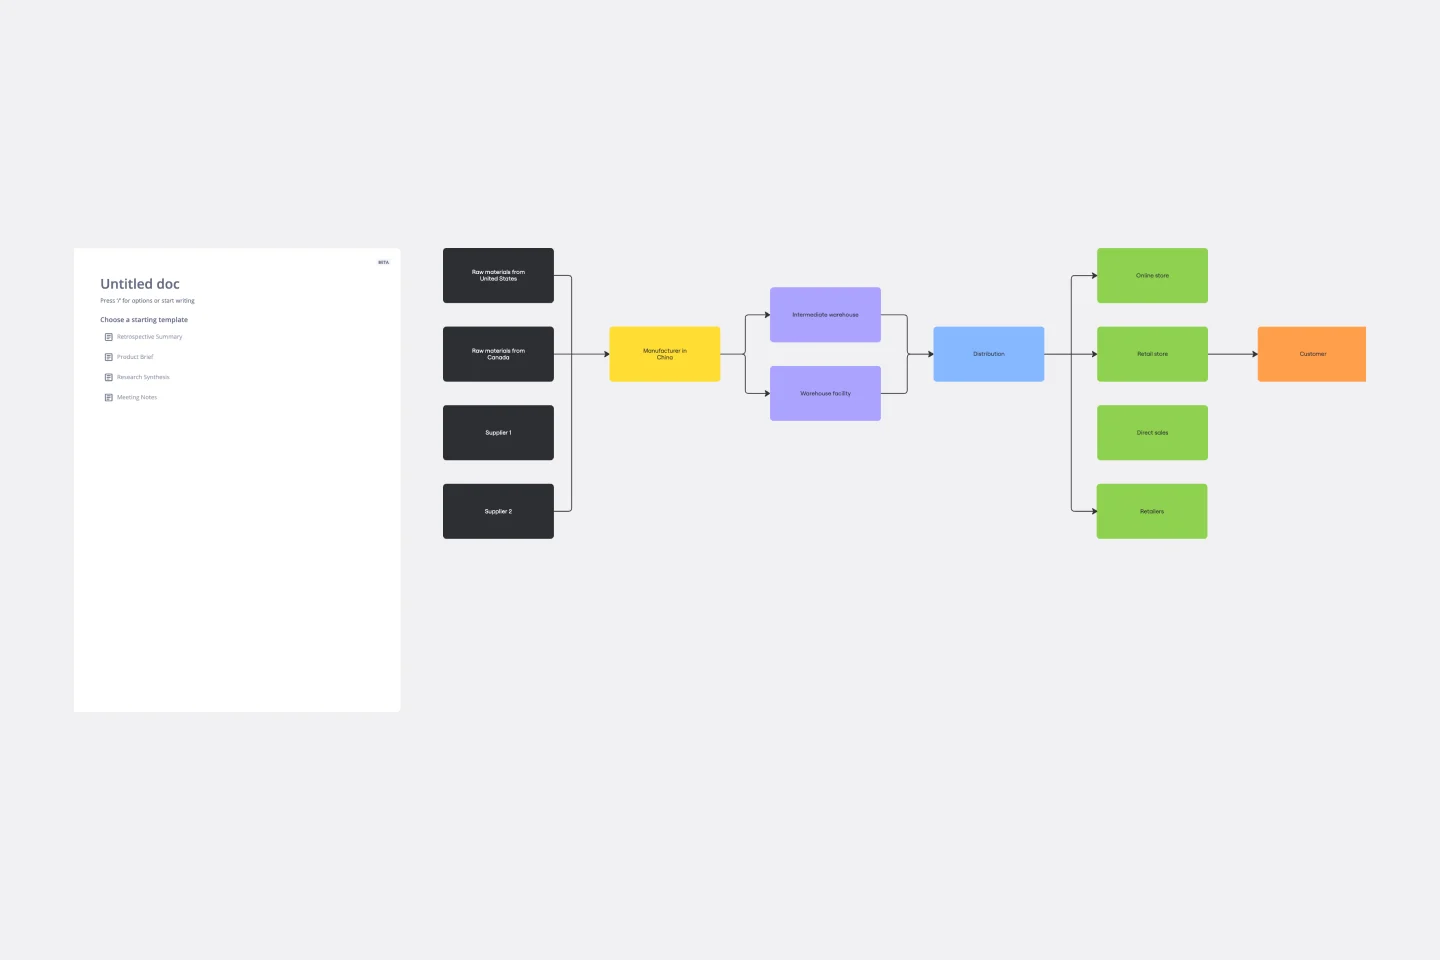
Supply Chain Diagram Template
The Supply Chain Diagram Template is great for businesses to streamline and enhance their supply chain processes. This template lets you visualize the entire supply chain, from sourcing raw materials to delivering finished products. Its intuitive layout simplifies complex networks, making identifying key areas and potential bottlenecks easier. One of the standout benefits of using this template is its clarity. It bridges the gap between complex processes and strategic decision-making by presenting a clear, visual supply chain representation. This clarity enables teams to pinpoint inefficiencies and implement more effective management strategies, which optimizes operations and facilitates better communication and understanding across different departments within an organization.
Innovation Diagram - S.PSS
15 likes84 uses
Innovation Diagram - S.PSS
The Innovation Diagram_S.PSS template offers a visual framework for mapping out the innovation process using the S.PSS (Service Product System Strategy) approach. It provides elements for defining service components, product features, and system interactions. This template enables teams to visualize and communicate their innovation strategy, facilitating alignment and collaboration across stakeholders. By promoting systematic innovation and holistic thinking, the Innovation Diagram_S.PSS empowers organizations to drive sustainable growth and competitive advantage through service and product innovation.
Venn Diagram for Learning and Education
21 likes62 uses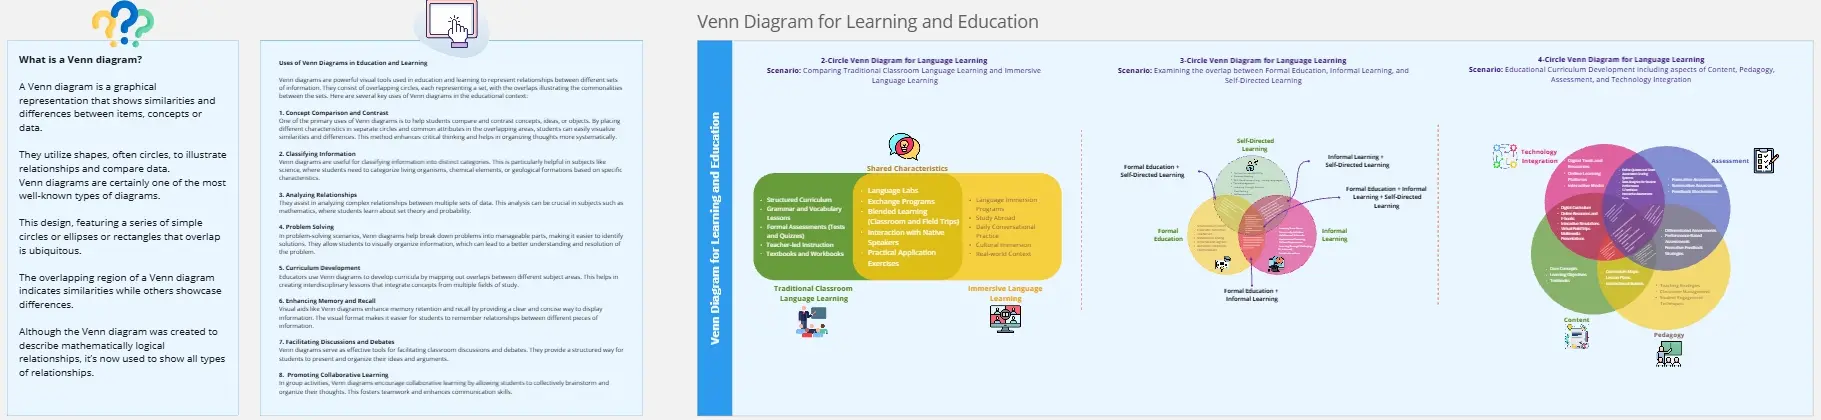
Venn Diagram for Learning and Education
Enhance learning and teaching with the Venn Diagram for Learning and Education template. Use it to compare concepts, illustrate relationships, and facilitate discussions. This template helps students and educators organize information visually, making complex ideas easier to understand and retain. It's an excellent tool for classrooms, study groups, and professional training sessions, promoting deeper understanding and active learning.
UML Activity Diagram Template
0 likes355 uses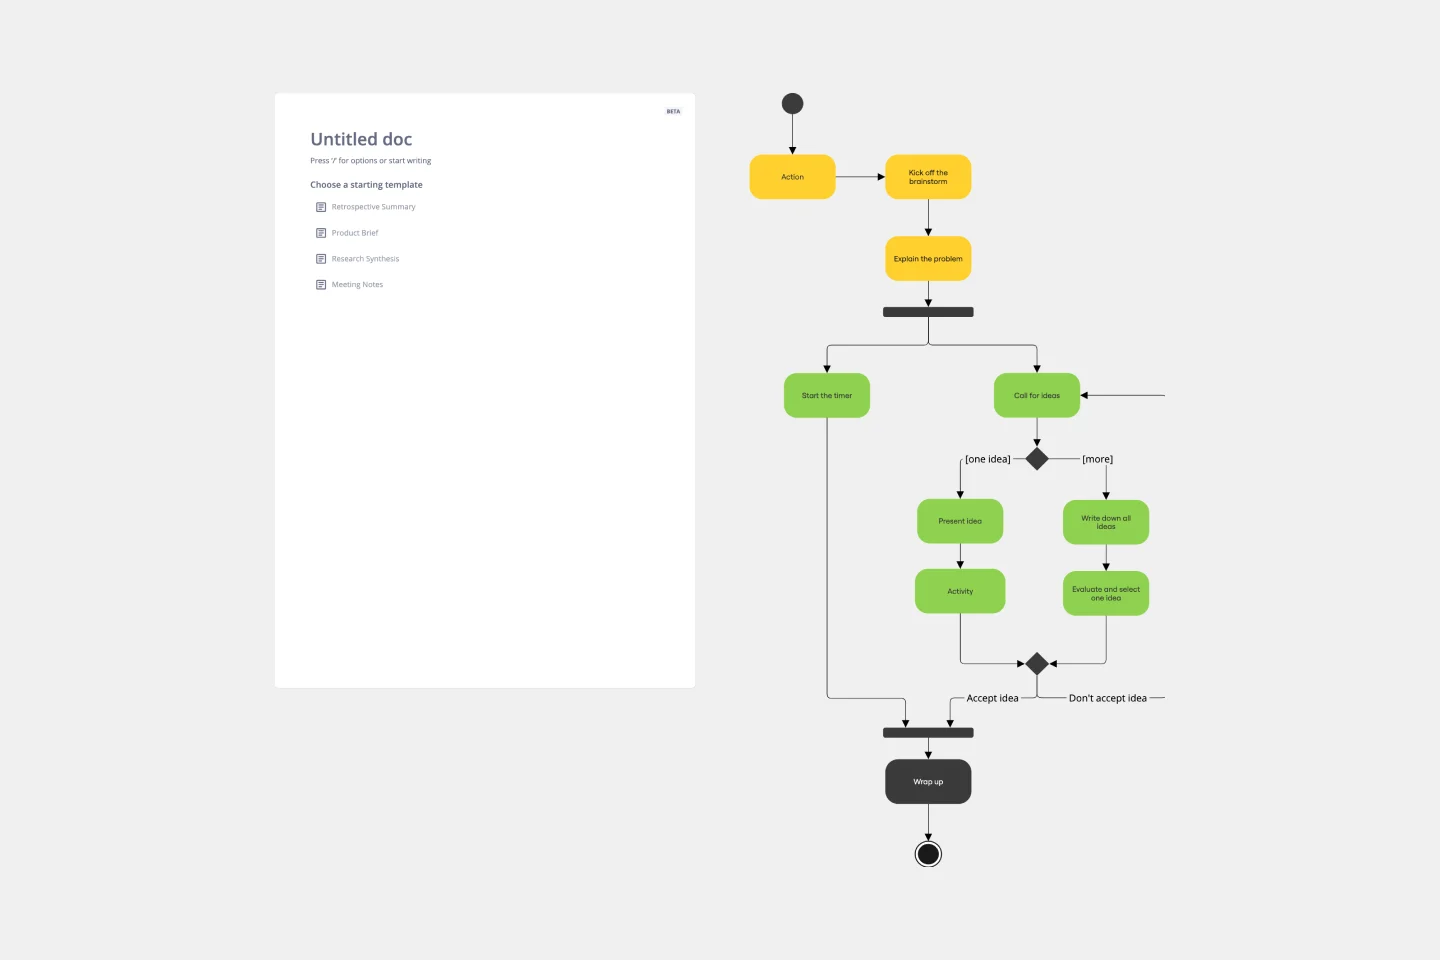
UML Activity Diagram Template
Use our Activity Diagram template to break down activities into smaller decisions and subprocesses. Improve and optimize systems and processes in I.T., business management, and more.
3-Circle Venn Diagram
2 likes509 uses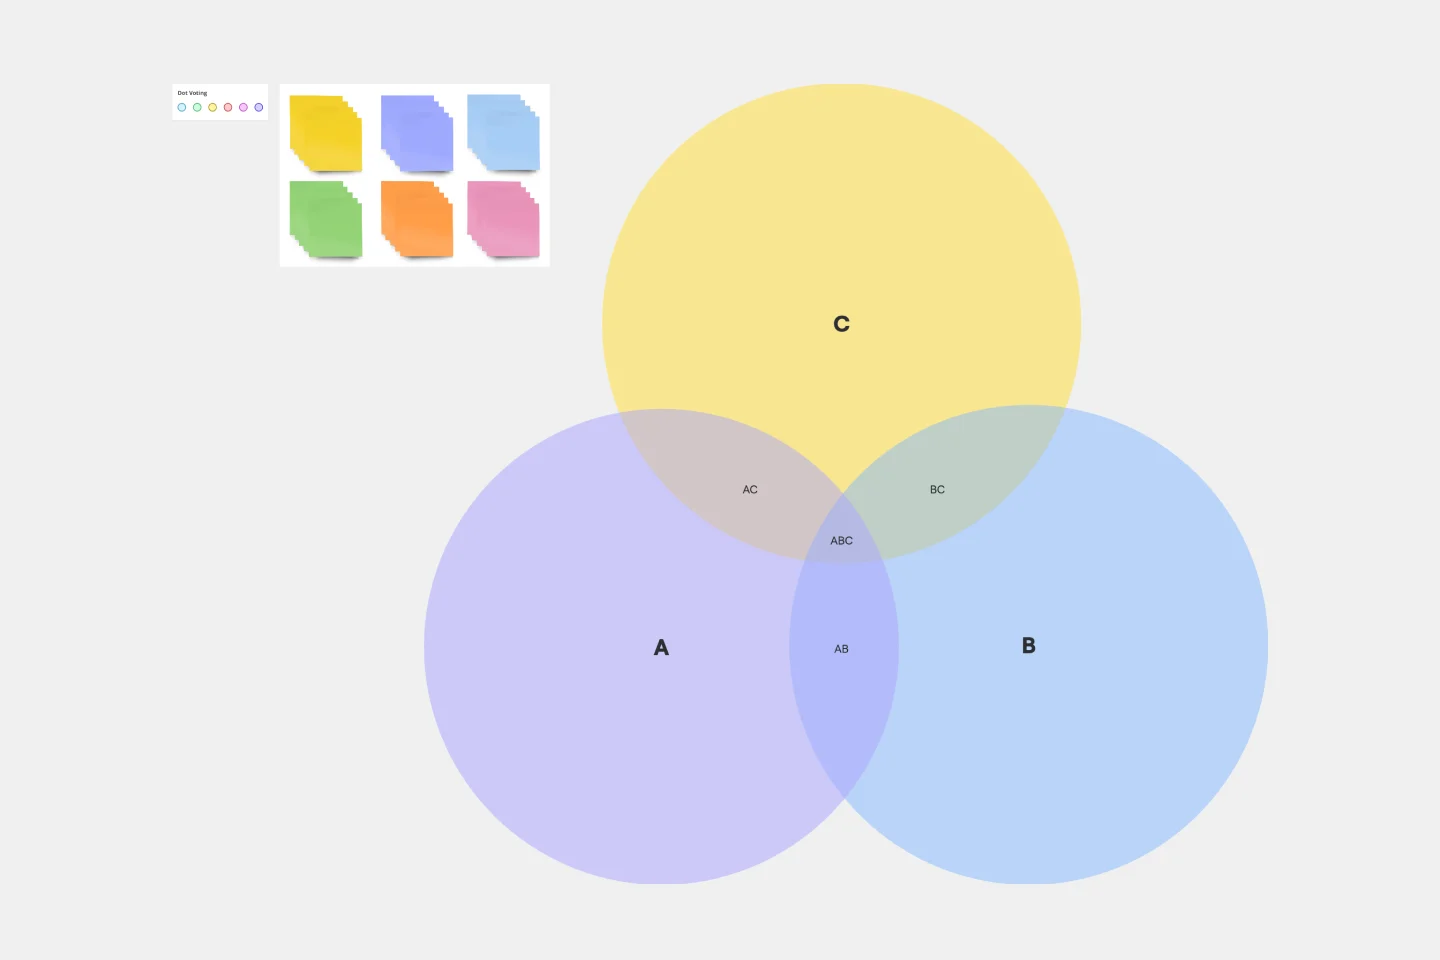
3-Circle Venn Diagram
Venn diagrams have been a staple of business meetings and presentations since the 1800s, and there’s a good reason why. Venn diagrams provide a clear, effective way to visually showcase relationships between datasets. They serve as a helpful visual aid in brainstorming sessions, meetings, and presentations. You start by drawing a circle containing one concept, and then draw an overlapping circle containing another concept. In the space where the circles overlap, you can make note of the concepts’ similarities. In the space where they do not, you can make note of their differences.
Turtle Diagram for BA
2 likes71 uses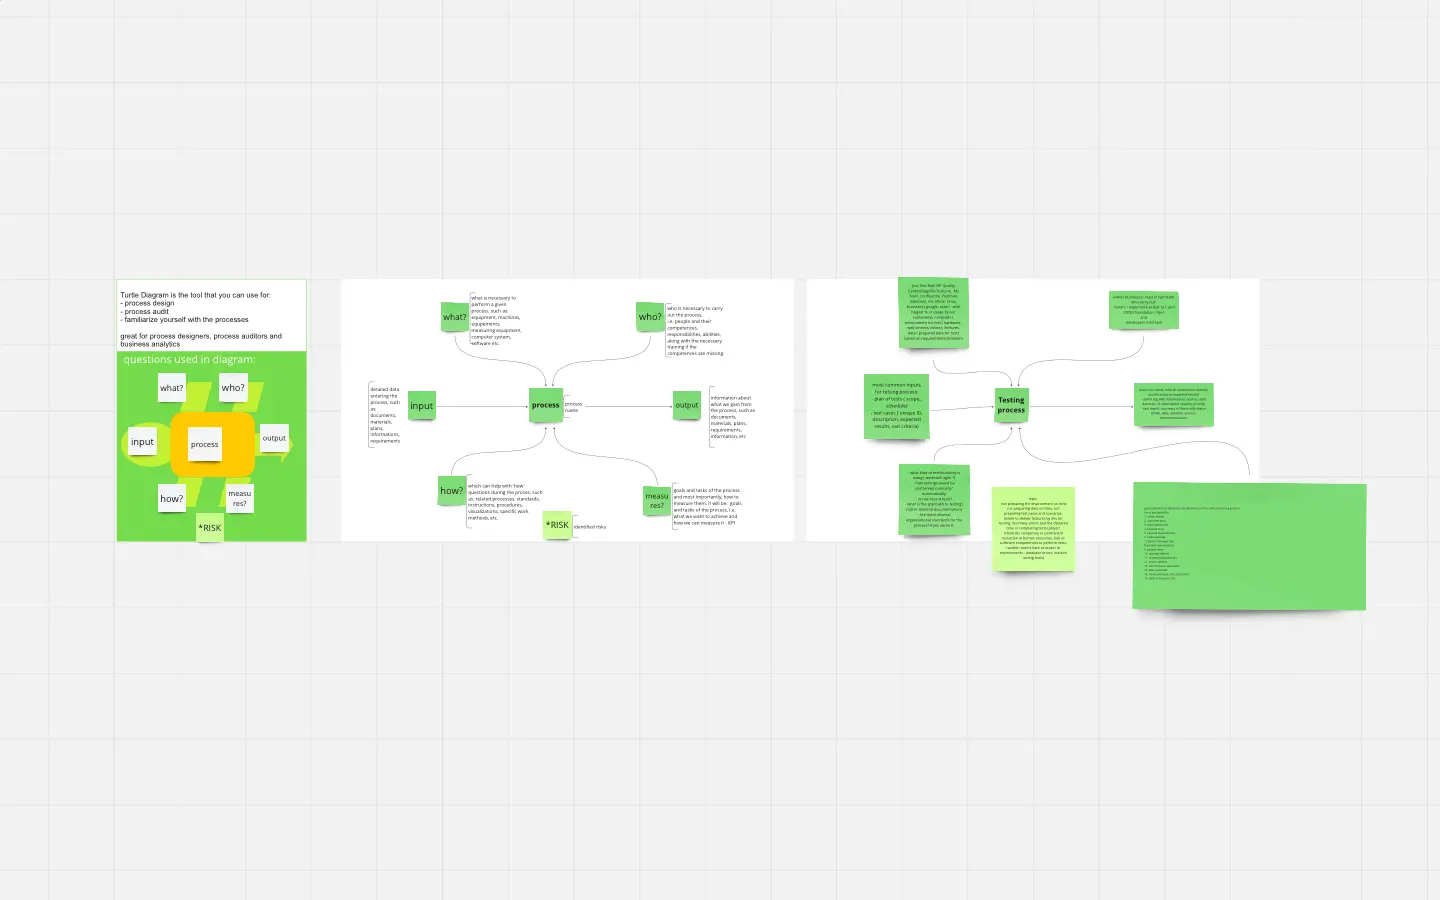
Turtle Diagram for BA
The Turtle Diagram for BA template offers a visual framework for defining and auditing business processes according to ISO 9001 standards. It provides elements for documenting process inputs, outputs, activities, and controls. This template enables organizations to ensure compliance, identify process improvements, and enhance quality management practices. By promoting systematic process documentation and auditability, the Turtle Diagram for BA empowers organizations to achieve and maintain ISO 9001 certification, demonstrating commitment to quality and continuous improvement.
Fishbone Diagram for Manufacturing
1 likes28 uses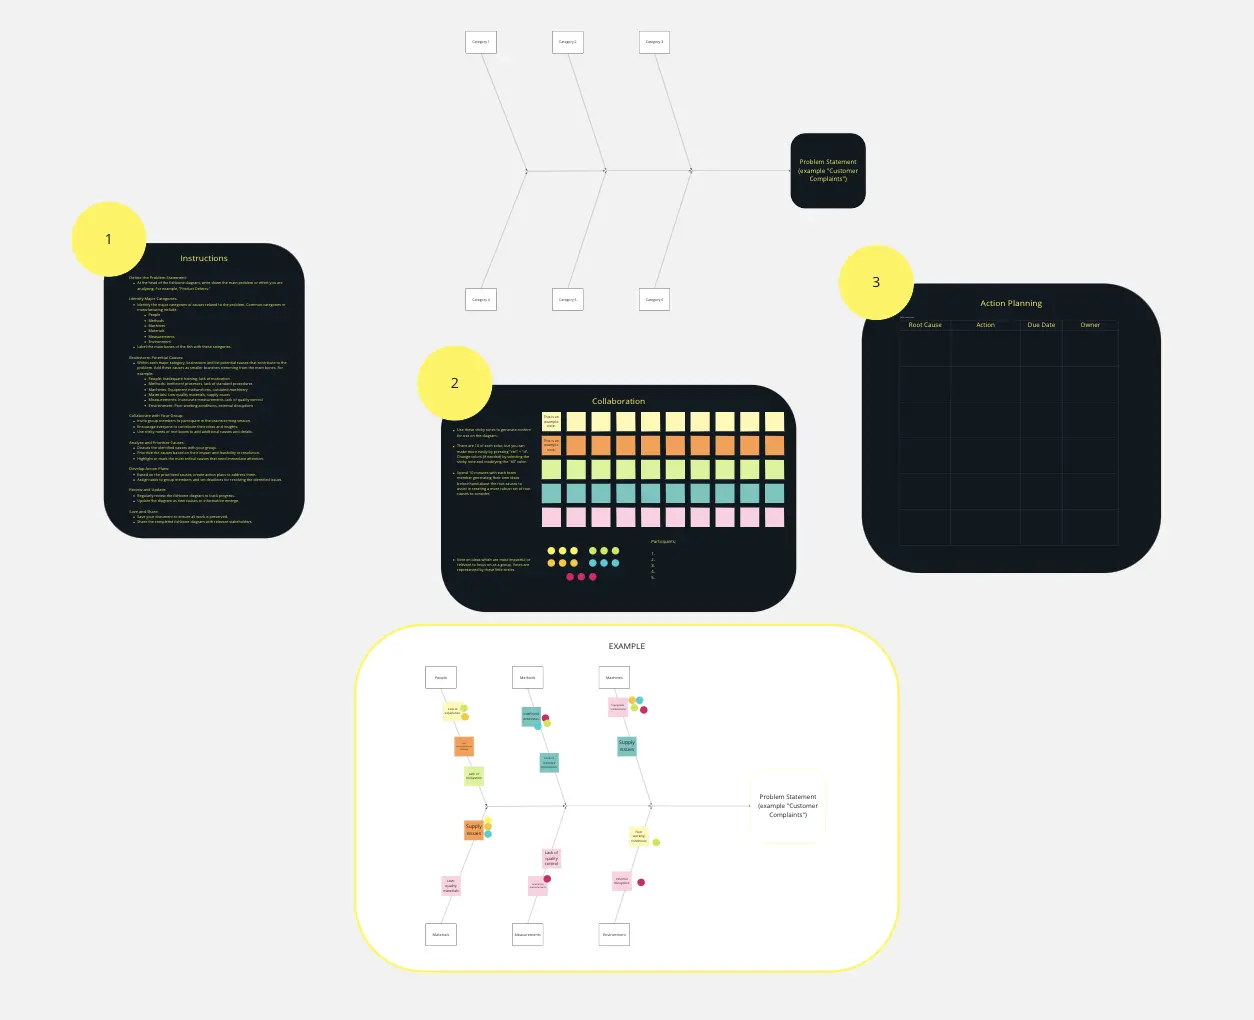
Fishbone Diagram for Manufacturing
In manufacturing, pinpointing the root causes of defects and inefficiencies is crucial. The Fishbone Diagram for Manufacturing template helps you systematically investigate issues related to production. Categorize potential causes into areas such as machinery, methods, materials, and manpower. This structured approach enables your team to collaboratively identify and address underlying problems, improving processes and enhancing manufacturing quality.
Data Flow Diagram Template
5 likes651 uses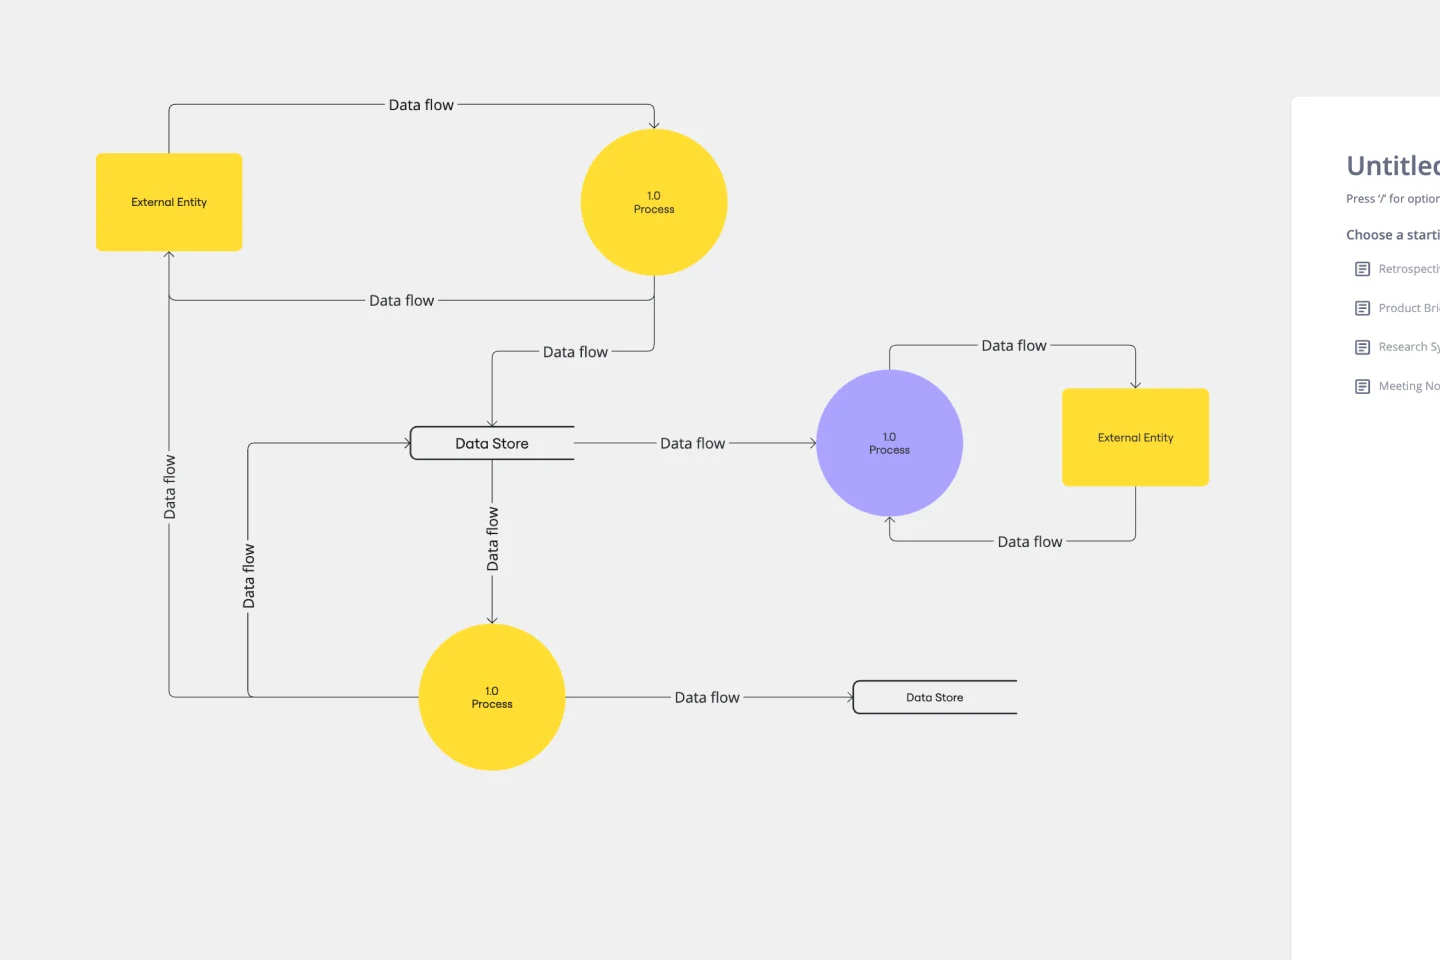
Data Flow Diagram Template
Any process can get pretty complex, especially when it has multiple components. Get a better grasp of your process through a data flow diagram (DFD). DFDs create a simple visual representation of all components in the flow of data and requirements in an entire system. They’re most often used by growth teams, data analysts, and product teams, and they’re created with one of three levels of complexity—0, 1, or 2. This template will help you easily build the best DFD for your process.
Causal Loop Diagram Template
2 likes676 uses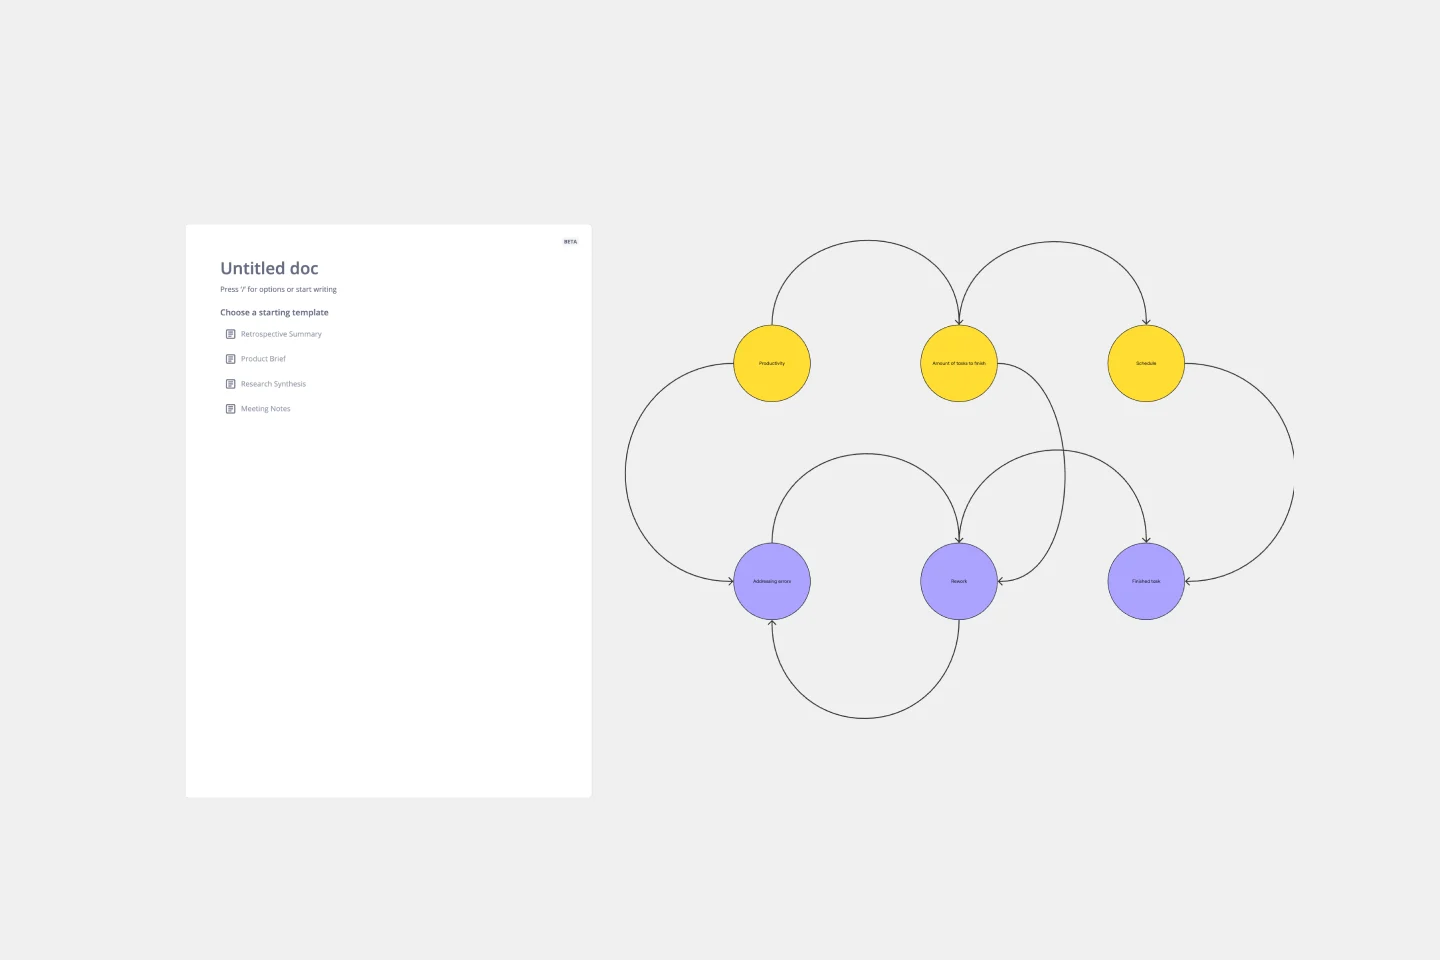
Causal Loop Diagram Template
The Causal Loop Diagram Template offers a structured framework to visualize the intricate interconnections within any system. Its standout benefit is the ability to provide a holistic perspective, ensuring that users don't just see isolated issues but understand the entire web of relationships, ultimately leading to more informed and strategic decision-making.
UML Class Diagram
99 likes1.7K uses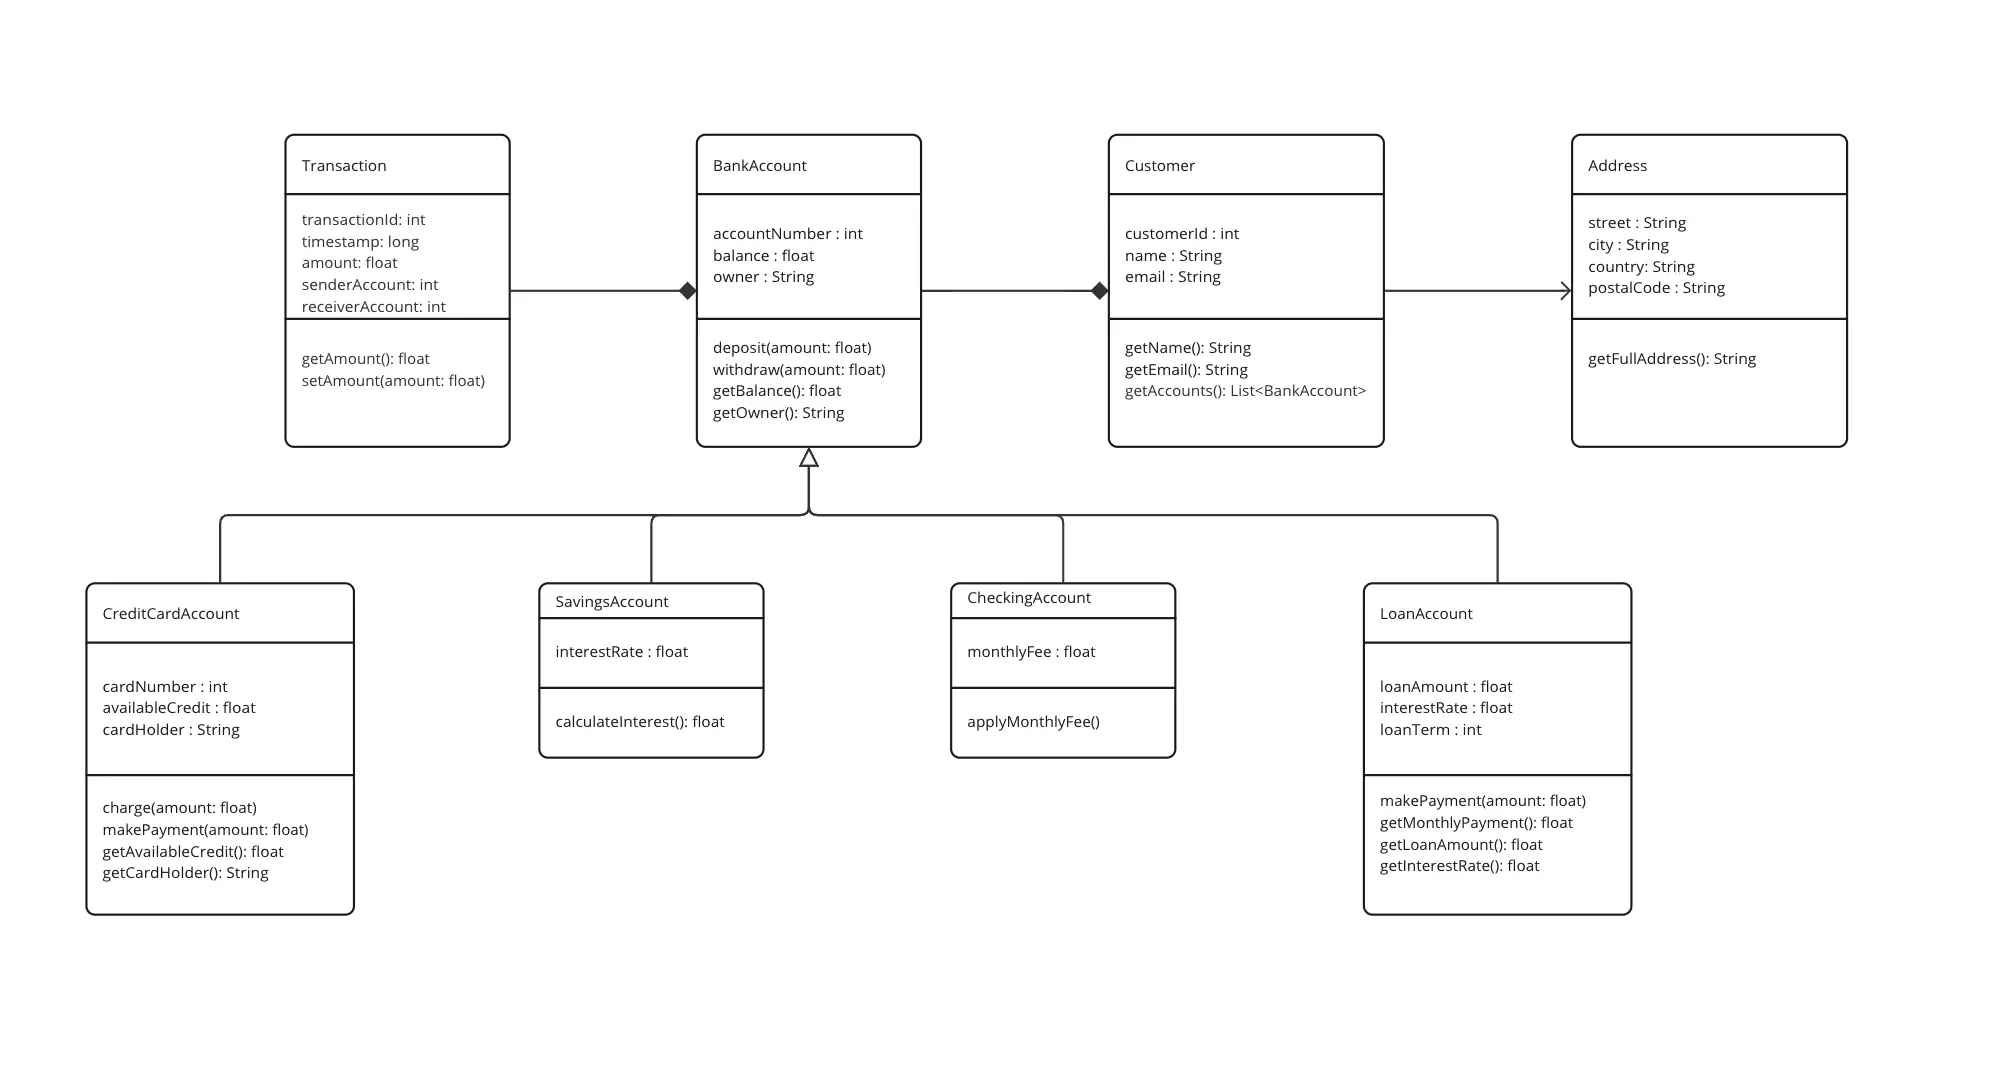
UML Class Diagram
A UML (Unified Modeling Language) Class diagram is a visual representation that shows the structure and relationships of classes in a system or software application.
UML Component Diagram Template
0 likes217 uses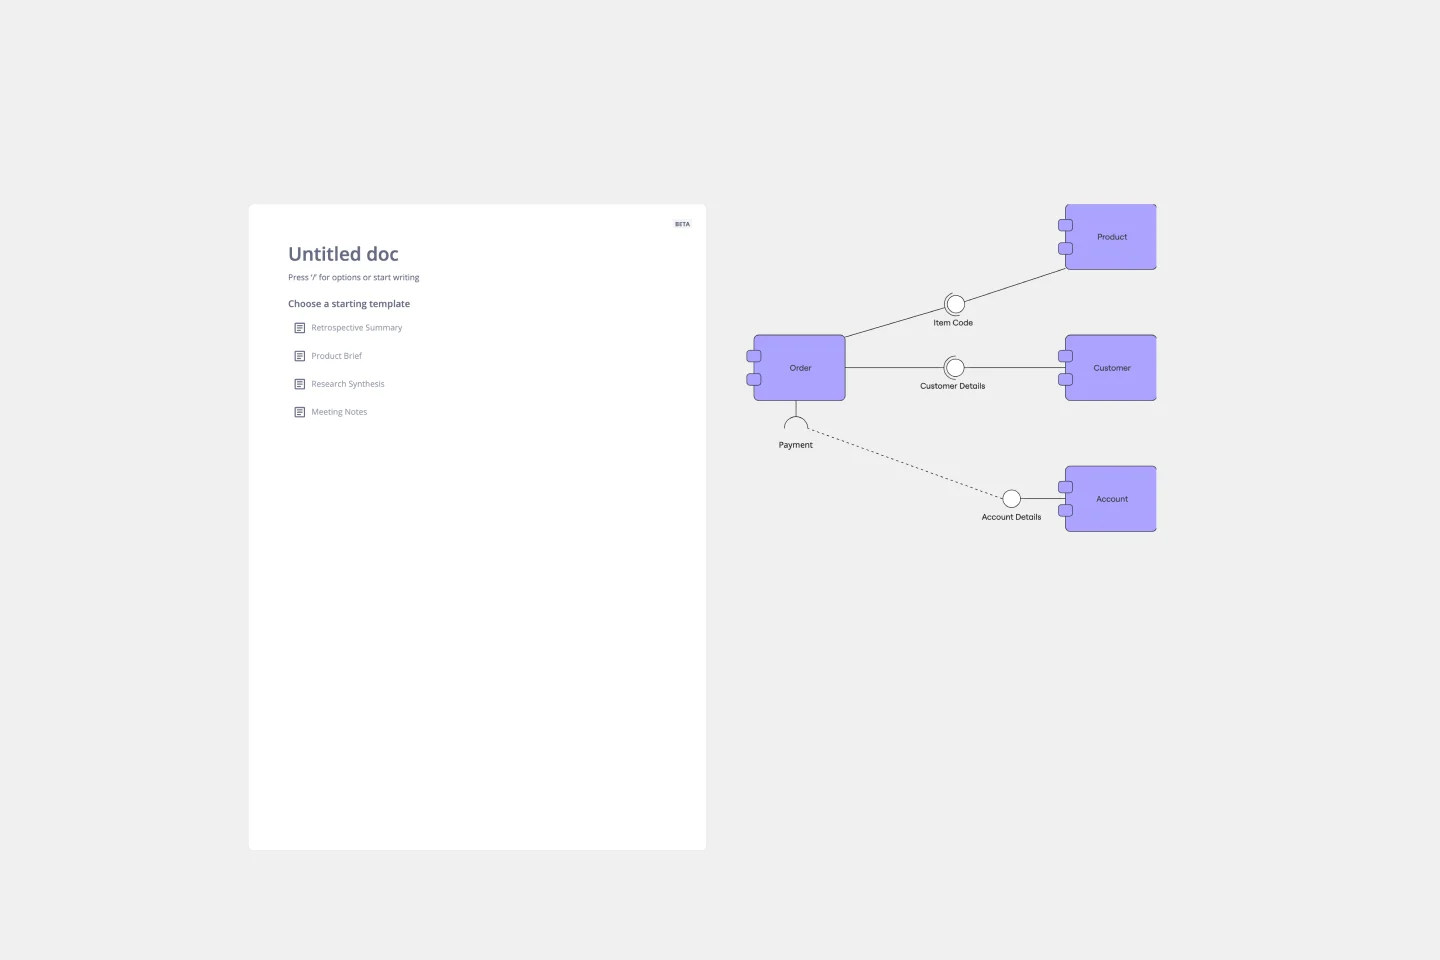
UML Component Diagram Template
Use our Component Diagram template to show how a system’s physical components are organized and wired together. Visualize implementation details, make sure planned development matches system needs, and more — all in a collaborative environment.
Four-Circle Venn Diagram
3 likes41 uses
Four-Circle Venn Diagram
The Four Circle Venn Diagram template is designed for comparing four sets of data. Use this tool to identify commonalities and differences across multiple categories. This template is ideal for complex data analysis, strategic planning, and academic research. It helps you visually organize information, making it easier to understand and communicate insights. Perfect for educators, researchers, and professionals in need of detailed comparison tools.
Task Analysis Diagram Template
1 likes200 uses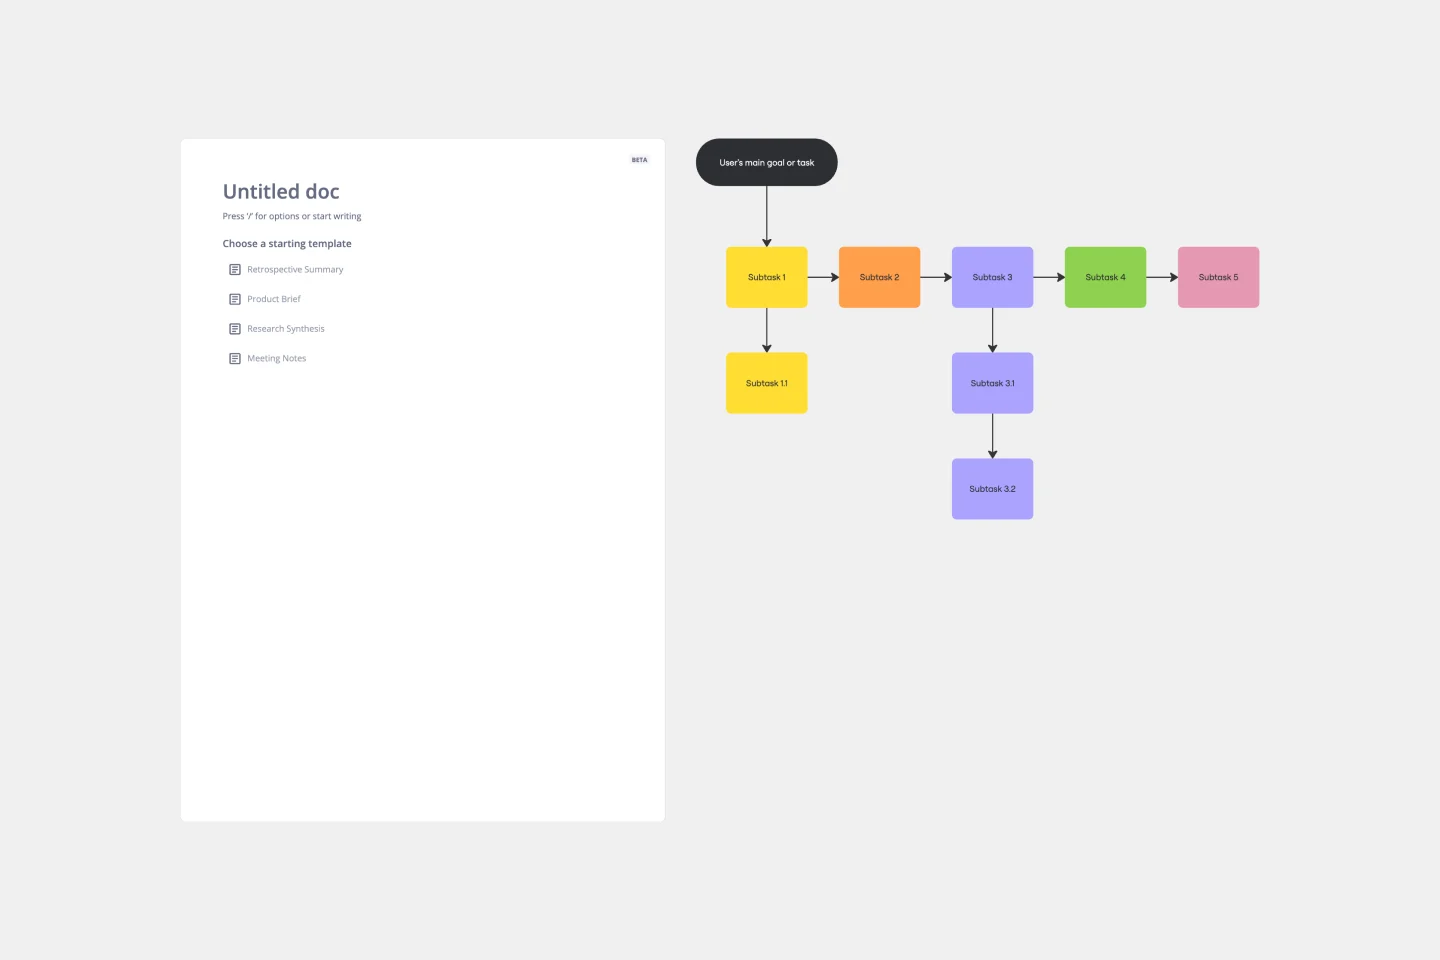
Task Analysis Diagram Template
The Task Analysis Diagram Template is a helpful tool that simplifies complex tasks by breaking them down into smaller, more manageable steps. This strategic approach brings clarity and ensures a systematic method for tackling complex user paths. The template's most significant advantage is its precision, as it maps out every detail of a task to guarantee that nothing is missed. This results in more efficient operations.
Four-Circle Venn Diagram
3 likes196 uses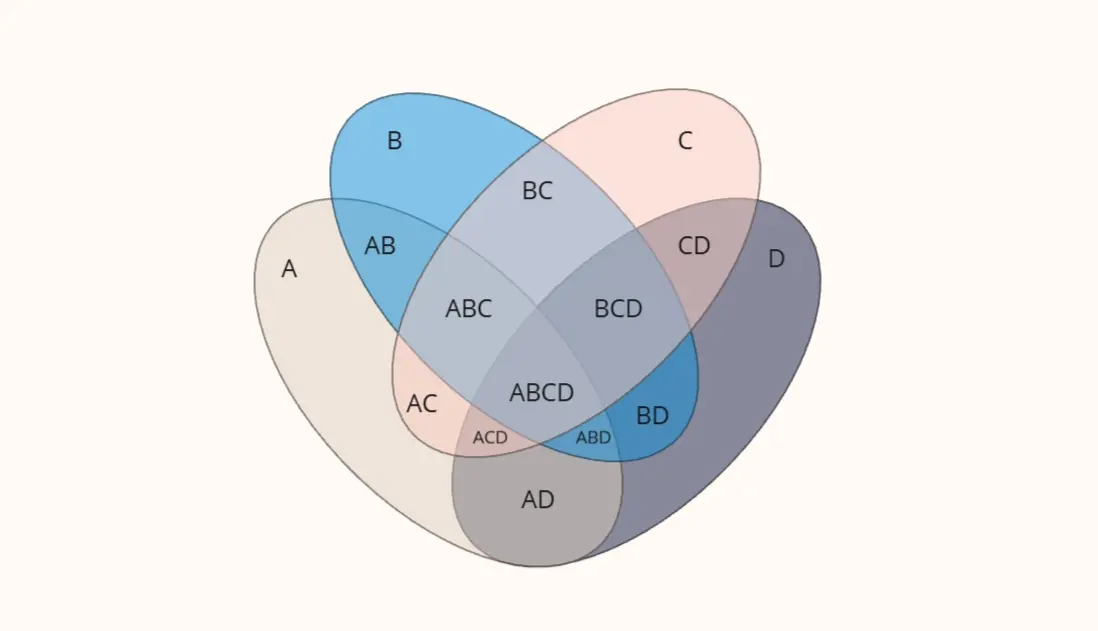
Four-Circle Venn Diagram
The Four Circle Venn Diagram template offers a robust tool for detailed data comparison involving four sets. Use it to identify common and unique attributes across multiple categories. This template is perfect for complex analysis in research, strategic planning, and education. It helps visualize relationships clearly, making it easier to draw insights and communicate findings. Ideal for professionals and educators needing advanced comparative tools.
Fishbone Diagram for Marketing
11 likes357 uses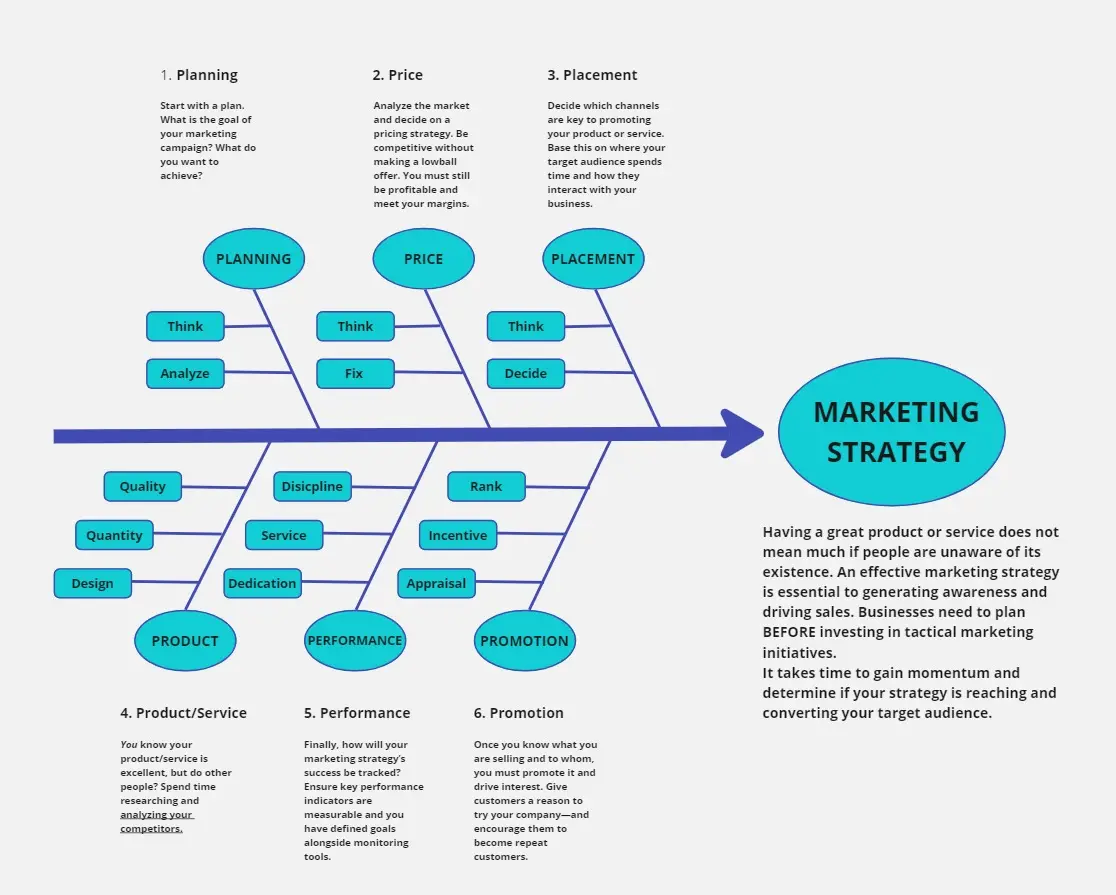
Fishbone Diagram for Marketing
Identifying the root causes of marketing challenges is essential for effective strategy development. The Fishbone Diagram for Marketing template helps you systematically explore factors affecting your marketing efforts. Categorize potential causes into areas such as market research, product positioning, promotional strategies, and distribution channels. This structured analysis enables your team to pinpoint and address issues, optimizing marketing campaigns.
Fishbone Diagram for Healthcare
6 likes53 uses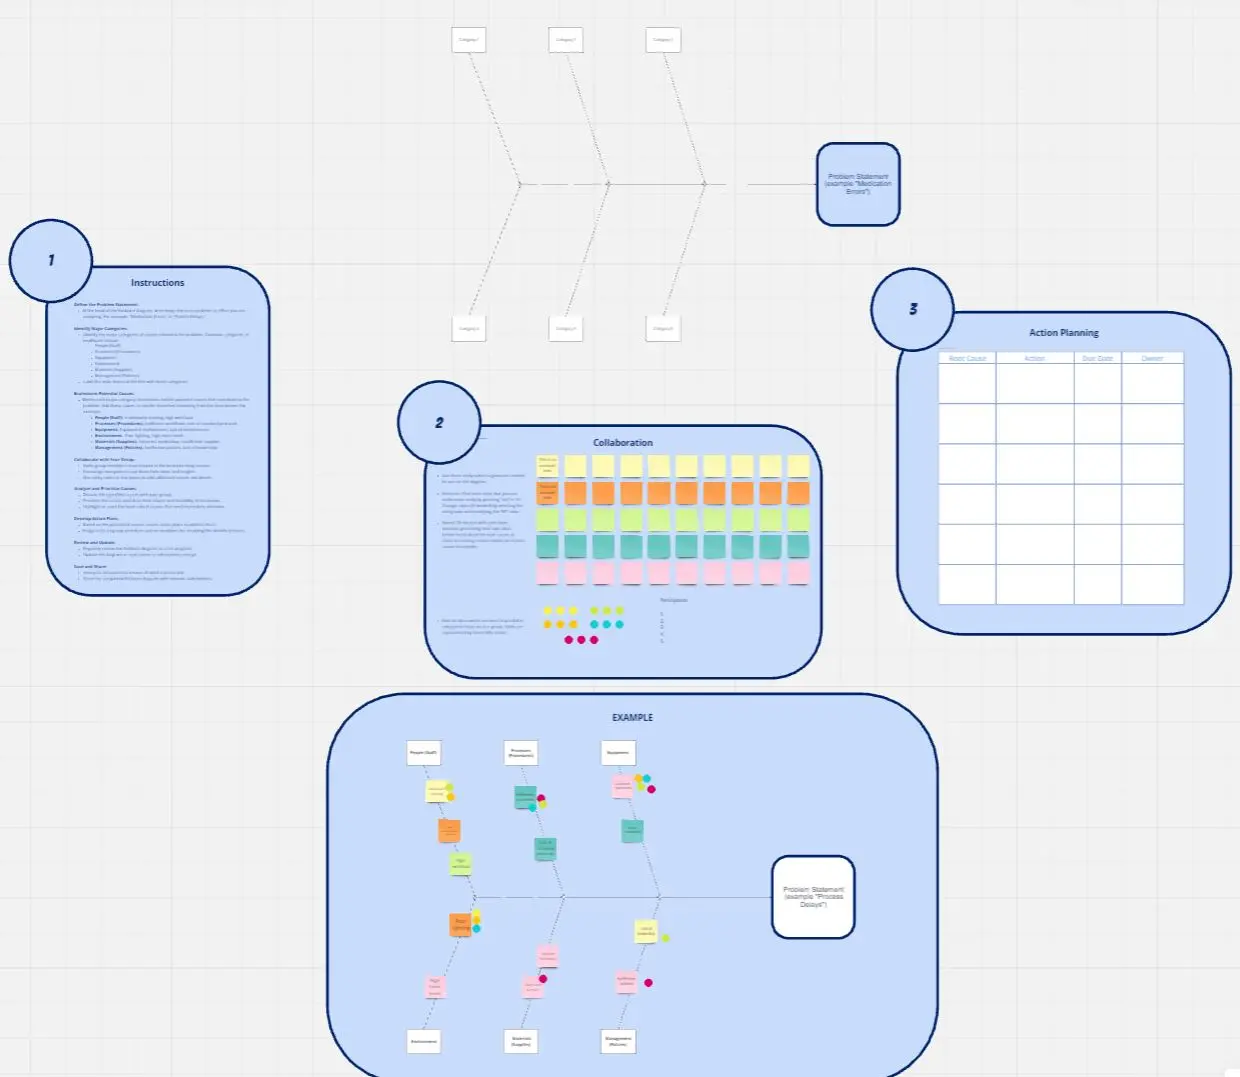
Fishbone Diagram for Healthcare
Ensuring high-quality care in healthcare settings requires a thorough understanding of root causes behind issues. The Fishbone Diagram for Healthcare template helps you analyze potential causes of problems in areas like patient care, staff performance, and administrative processes. This structured approach facilitates comprehensive analysis and collaborative problem-solving, ultimately leading to improved healthcare outcomes and patient satisfaction.