Task Analysis Diagram Template
Analyze your user path by mapping out their tasks in a systematic way with the task analysis diagram template.
Trusted by 65M+ users and leading companies
About the Task Analysis Diagram Template
The task analysis diagram template is a visual tool that helps capture, organize, and categorize a user's tasks while interacting with a product. It is designed to break down user tasks and their interactions, making it easier to bridge the gap between planning and action. This template is perfect for anyone wanting to unravel a process's complexities and turn them into actionable steps.
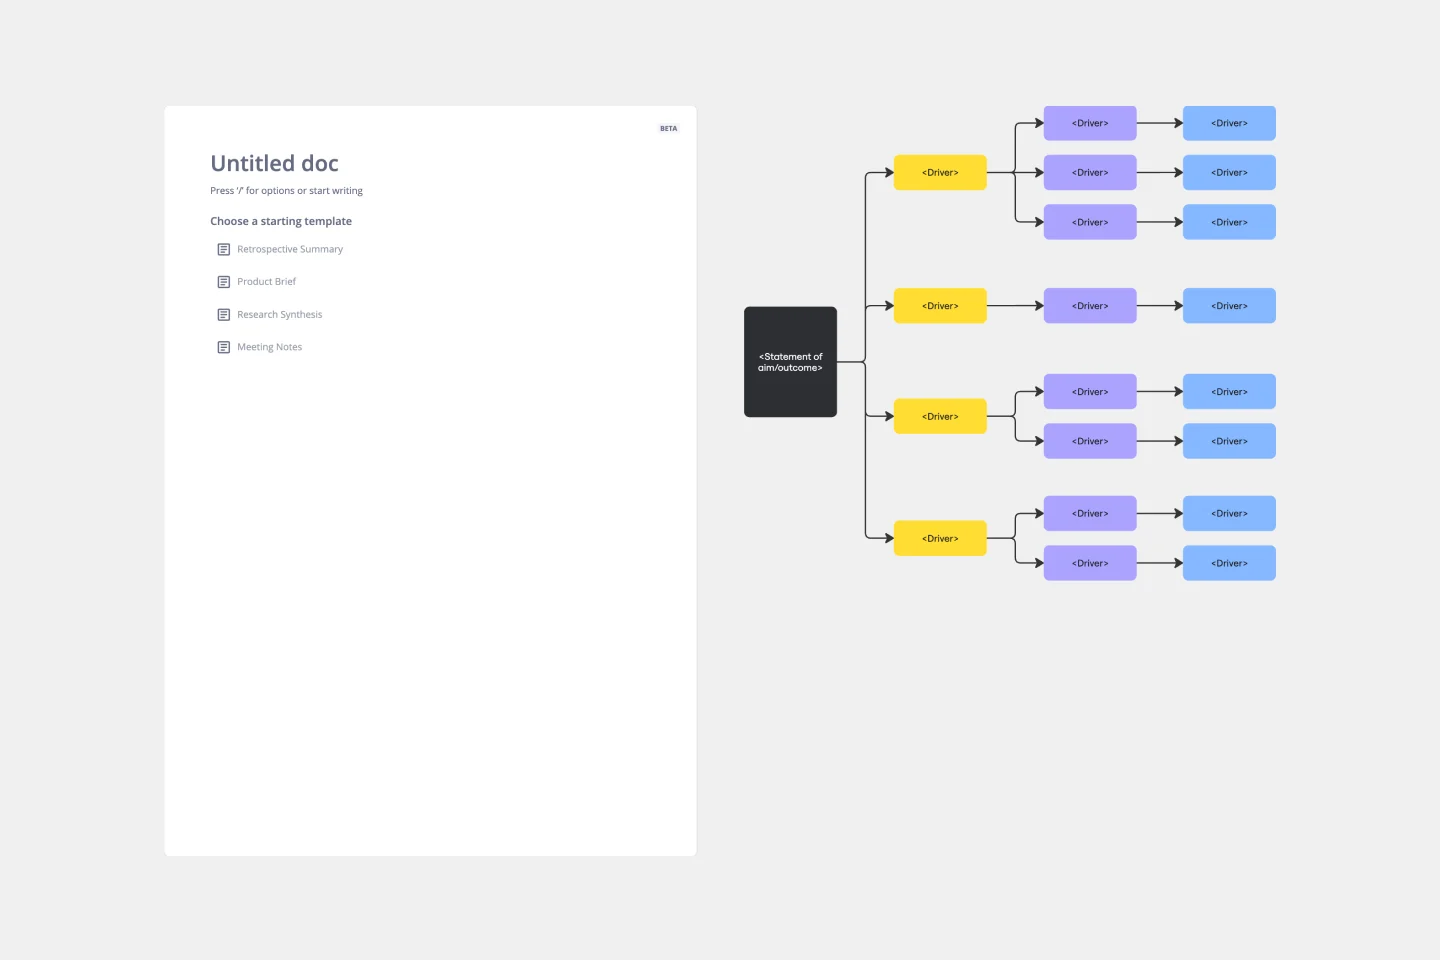
The template presents each task in a sequential and hierarchical order, which makes it easier to understand the flow of the user's journey and identify dependencies and potential issues. It is like creating a map of the user's journey, where each step and action is detailed, ensuring a clear understanding of the entire process.
How do you use the task analysis diagram template?
Follow these four simple steps to get started:
Edit the template: Change the template to suit your needs with just a few clicks. You can add tasks, delete redundancies, or change the flow of the diagram. The template is designed to be user-friendly and easy to edit.
Expand: Need to expand the diagram? Miro’s automated diagramming features let you quickly add more shapes and connector lines while maintaining the diagram's structure.
Add contextual information: Make your diagram more comprehensive by adding relevant artifacts, such as documents, links, or images, for additional information.
Why should you use the task analysis diagram template?
Clear visualization: The template provides a clear, concise, and visual representation of all tasks and their interactions, making it easier to understand and follow than textual explanations.
Process identification: Using the template helps identify redundant tasks, potential bottlenecks, or gaps that might have been overlooked, which can be addressed to improve the overall process.
Enhanced collaboration: Team members can collaboratively view, discuss, and edit the diagram, ensuring everyone is on the same page and making it easier to work together.
User-centric design: Understanding the tasks a user undergoes helps design or change products to better suit user needs and preferences, resulting in better user experiences.
Structured approach: The template gives a structured approach to task analysis, ensuring no task or detail is overlooked and making the process more organized and efficient.
If you'd prefer to start from scratch, diagramming with Miro is easy! You can choose from a wide range of diagramming shapes in Miro's extensive library, so you'll find just what you need.
What if I need to add more tasks than the template provides?
No worries! The template is expandable. You can effortlessly add more shapes and connectors to accommodate additional tasks.
Can multiple team members collaborate on the same diagram?
Absolutely. The template is designed for collaborative efforts, ensuring multiple people can view, comment, or edit in real time.
Is there a way to integrate other information or links directly into the diagram?
Yes, you can seamlessly add any artifact onto the board, be it a document, image, or hyperlink, to provide richer context and information.
Get started with this template right now.
Genogram Template
Works best for:
Diagramming
The Genogram Template maps out family structures and relationships with exceptional depth and detail. Unlike traditional family trees, this template provides a comprehensive perspective by encapsulating familial connections, emotional ties, and significant life events. Create a genogram to unearth patterns and trends within a family, whether hereditary or environmental. Professionals across different domains can gain a holistic understanding of familial dynamics by showing deep insights into the nuances of relationships, facilitating better communication and problem-solving.
Web Diagram Template
Miro's Web Diagram Template simplifies complex project organization and promotes effective communication. It allows users to easily connect elements and gain a comprehensive understanding of complex relationships, making it a versatile and invaluable asset for diverse projects.
Login Sequence Diagram Template
Works best for:
Diagramming, Technical Diagramming
The UML Sequence Login Diagram Template is a valuable tool for visualizing user authentication processes. It breaks down complex login sequences into clear, visual components, facilitating collaborative understanding among team members, regardless of their technical expertise. This shared understanding is crucial for ensuring all stakeholders, from developers to project managers, are on the same page, leading to efficient decision-making and a smoother development process. The template's ability to translate technical details into an accessible format streamlines communication and significantly reduces the likelihood of misinterpretation or oversight, making it an essential asset in any software development project.
Inverted Org Chart Template
Works best for:
Diagramming, Org Charts, Organizational Design
The Inverted Org Chart Template is a tool that reimagines the traditional hierarchical model by placing frontline employees at the top of the organizational structure. This innovative approach highlights the crucial role played by those who interact with customers directly, ensuring that their insights and contributions are not only recognized but also celebrated. One of the key advantages of this template is that it fosters a feedback-driven environment. Prioritizing frontline workers promotes a culture where valuable insights from the ground can quickly reach the top of the hierarchy, streamlining decision-making processes and ensuring that strategies are based on real-world experiences.
Fault Tree Analysis Template
Works best for:
Diagramming
The Fault Tree Analysis Template visually breaks down potential system malfunctions, highlighting complex causal relationships between faults. One of its standout benefits is its ability to enhance clarity in complex scenarios, allowing professionals to swiftly pinpoint root causes and prioritize interventions, ensuring a more streamlined approach to problem-solving.
Business Intelligence Architecture Template
Works best for:
Diagramming
The Business Intelligence Architecture Diagram Template in Miro visually maps the complex landscape of business intelligence systems. With elements encompassing data sources, warehouses, ETL processes, tools, and end-user interfaces, the template enables users to communicate complex concepts with clarity. One standout feature is the template's dynamic adaptability, empowered by Miro's automated diagramming capabilities. This feature ensures that the diagram remains up-to-date with minimal effort, allowing users to effortlessly incorporate changes in data structures and processes, thus maintaining the relevance and accuracy of their visual representations over time.