What is a UML Sequence Diagram Template?
A UML Sequence Diagram template is a behavioral diagram that depicts object interactions arranged in time sequence. it is used to visualize the scenario-based logic of a system, showing the exchange of messages between different "Lifelines" (actors or objects) to complete a specific function. This is the primary tool for developers to map out complex API calls, database queries, and user interface responses.
The "Interaction" Audit: 3 Ways to Map Complex Logic
A sequence diagram is only effective if it captures the "Real-Time" nature of the system. Before finalizing your board, apply these three expert "health checks":
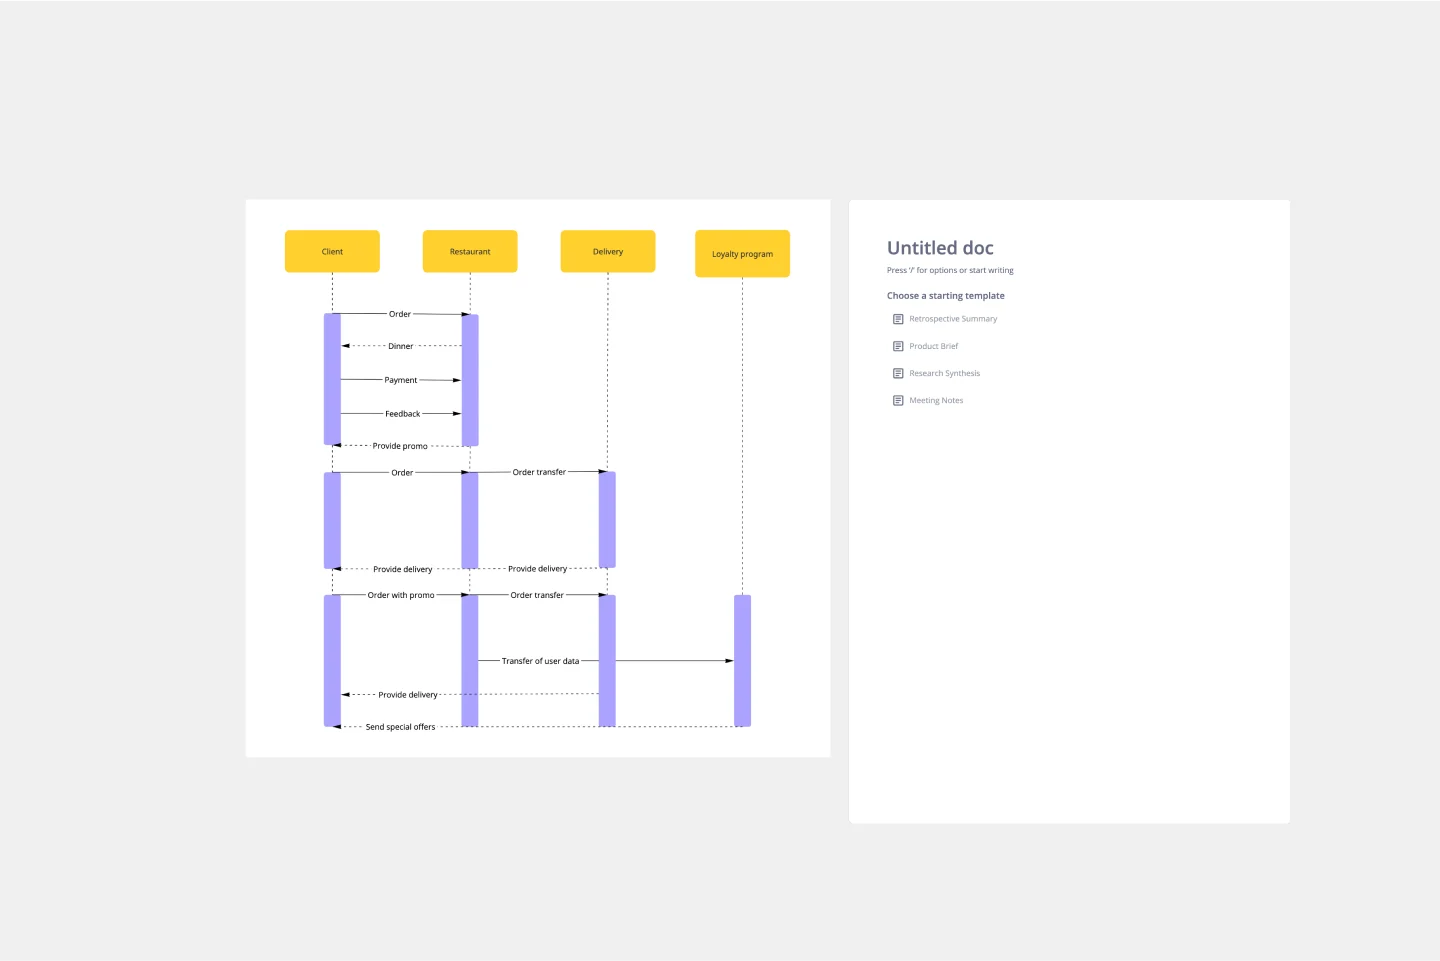
1. The "Activation" Timing Audit
The Audit: Are your messages floating in space without a clear start and end? The Fix: Audit your Activation Bars (the thin rectangles on the lifelines). These represent the period during which an element is performing an operation. If an object is "Waiting" for a response, the bar should be broken or thin; if it is "Processing," the bar should be solid. This helps developers identify "Blocked" states in the code.
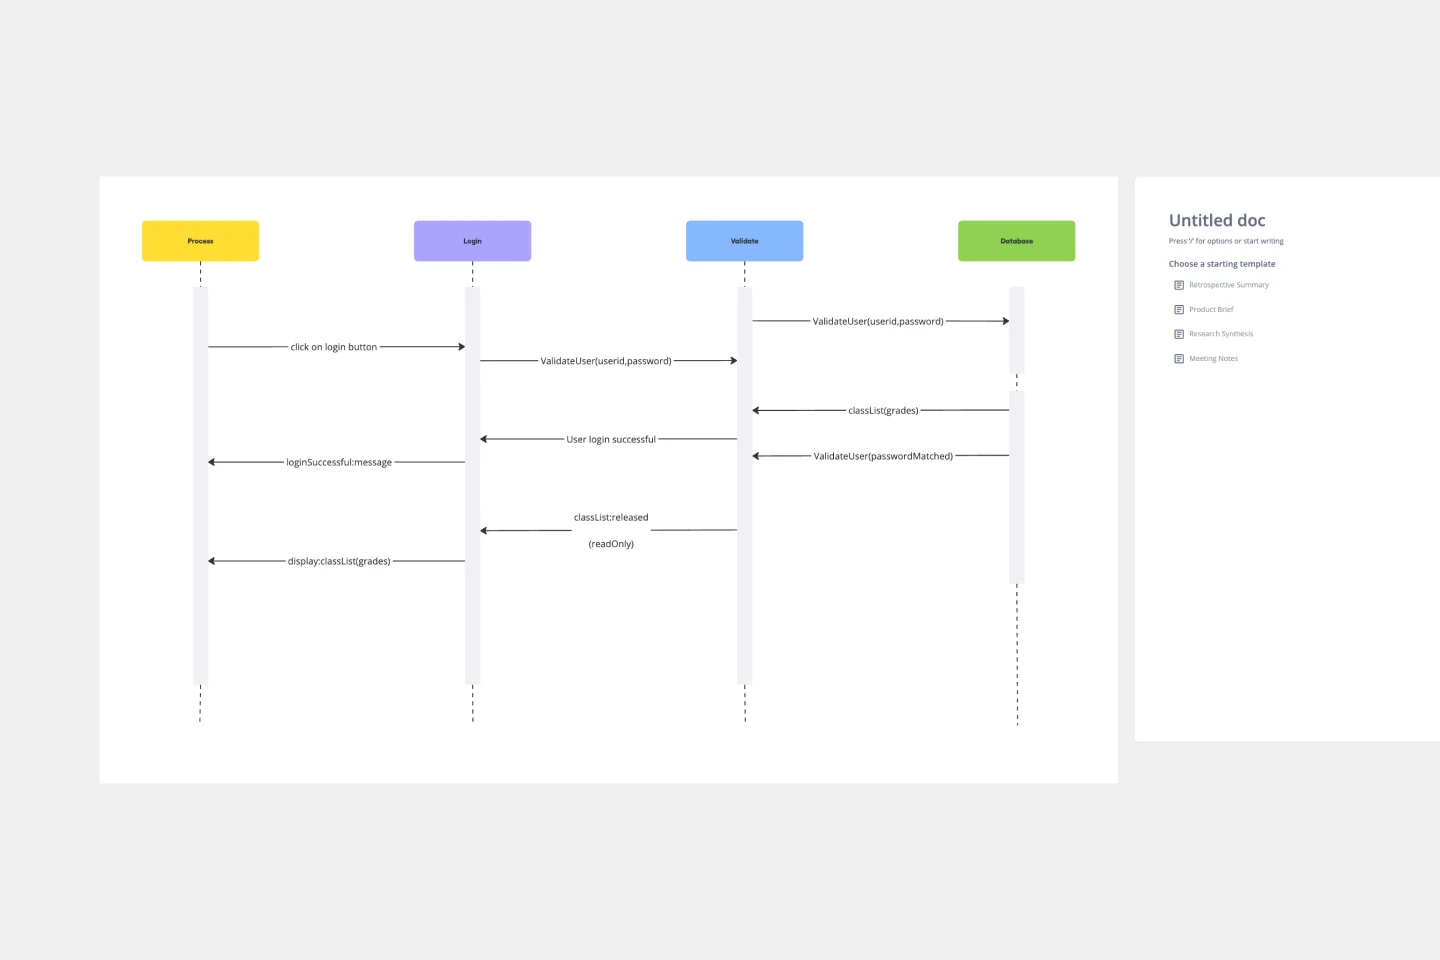
2. The "Synchronous vs. Asynchronous" Test
The Audit: Are you using the same arrow style for every message? The Fix: Audit your Arrowheads.
Solid Arrowhead (Synchronous): The sender waits for a response before continuing (e.g., a standard function call).
Open Arrowhead (Asynchronous): The sender continues without waiting (e.g., a message queue or a background task).
Dashed Line (Return Message): Used to show the data being sent back to the requester.
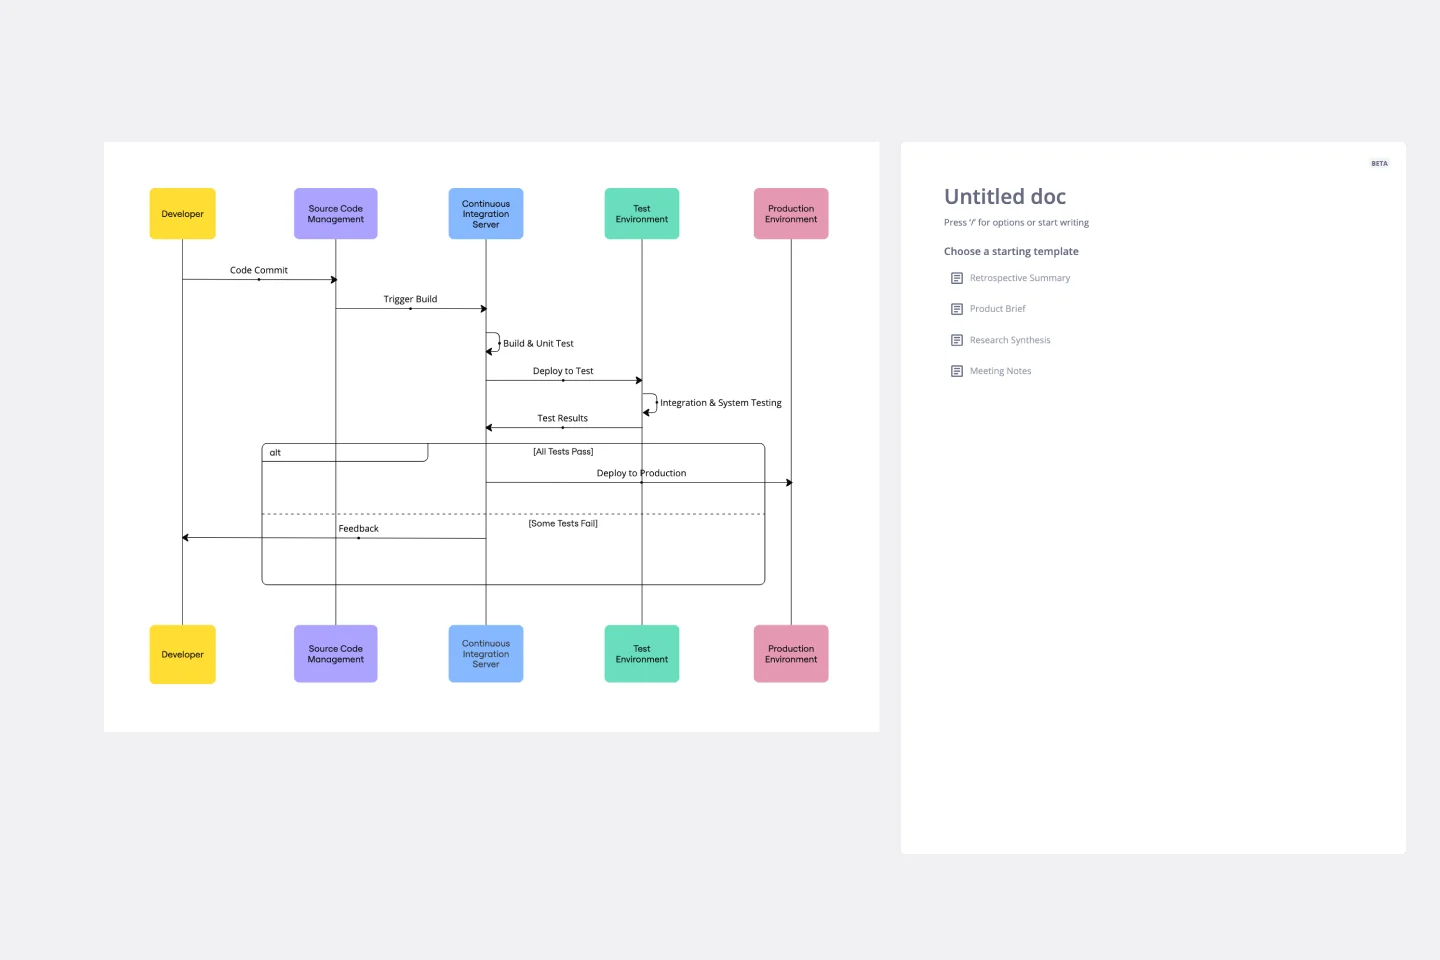
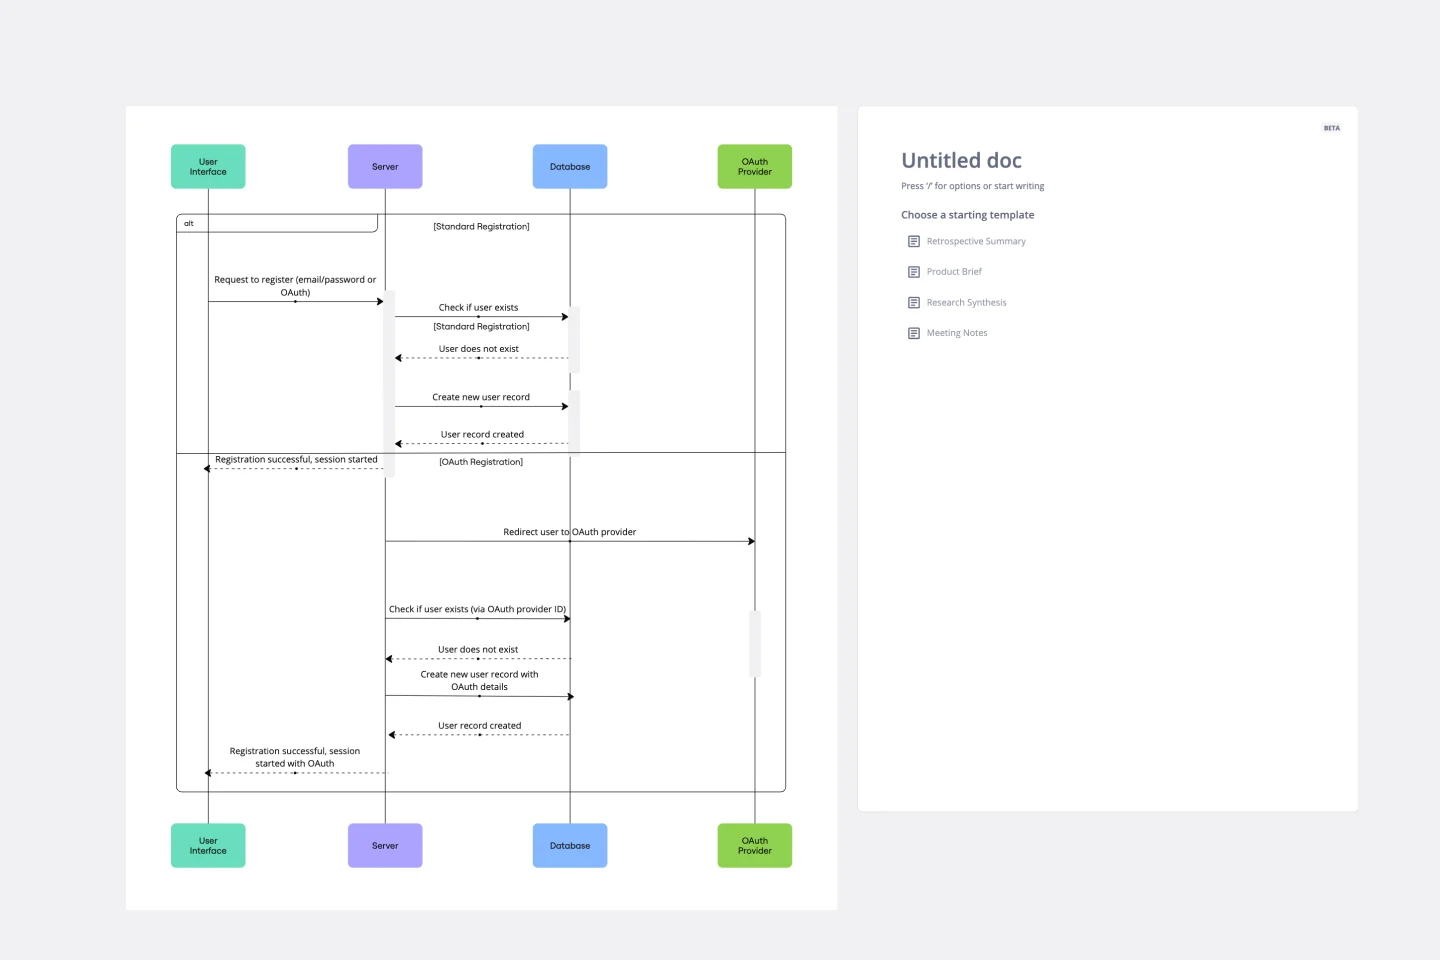
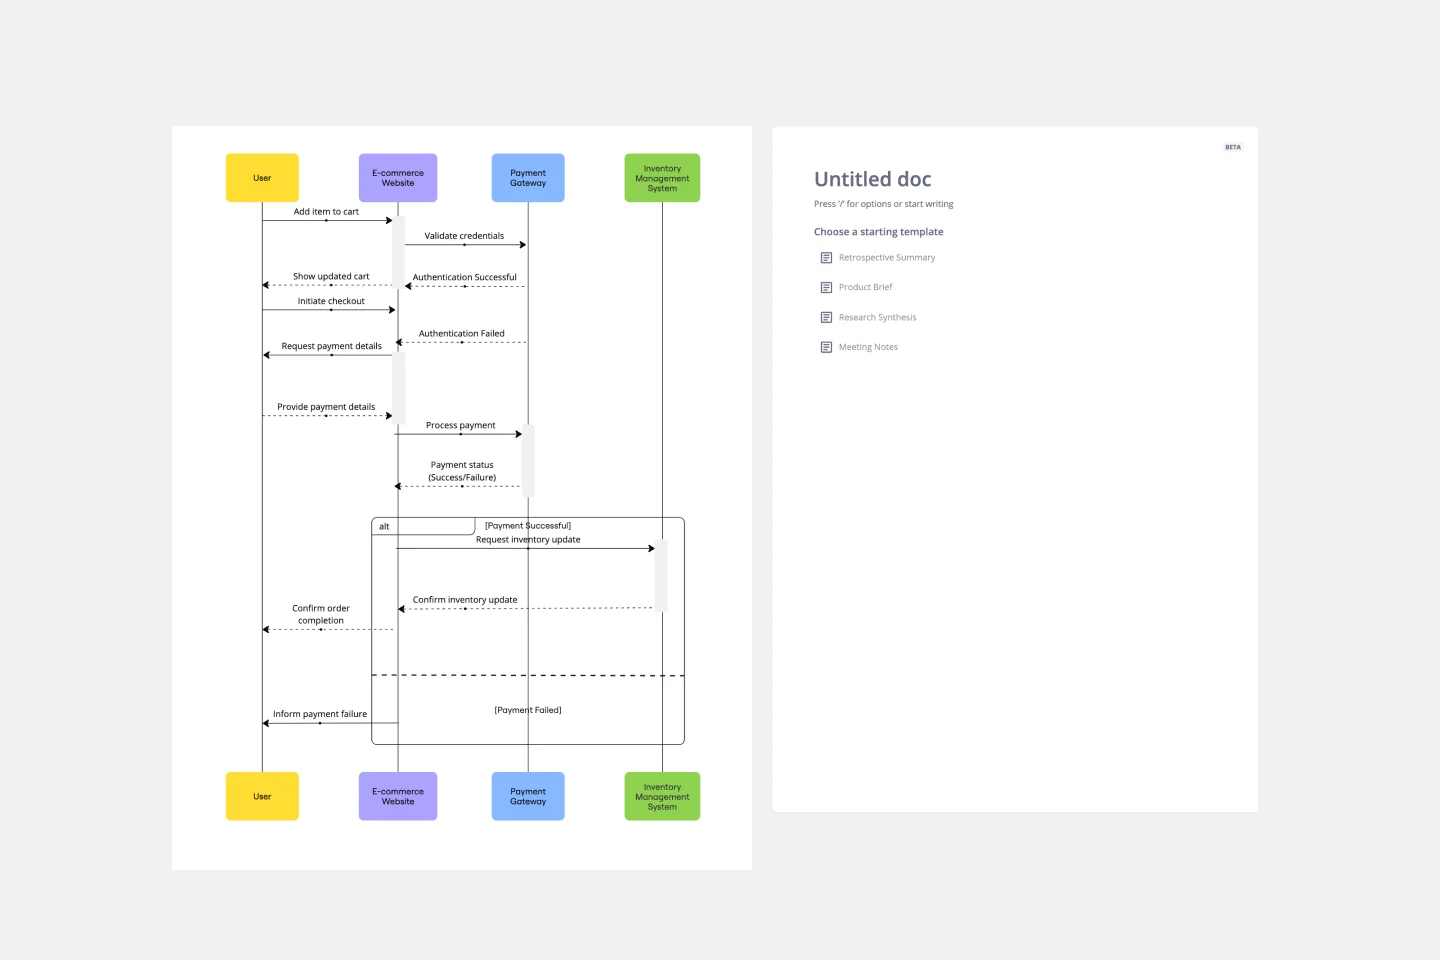
3. The "Fragment" Logic Audit
The Audit: How are you showing "If/Else" logic or "Loops"? The Fix: Audit your Combined Fragments. Instead of drawing five different diagrams, use labeled boxes to show logic:
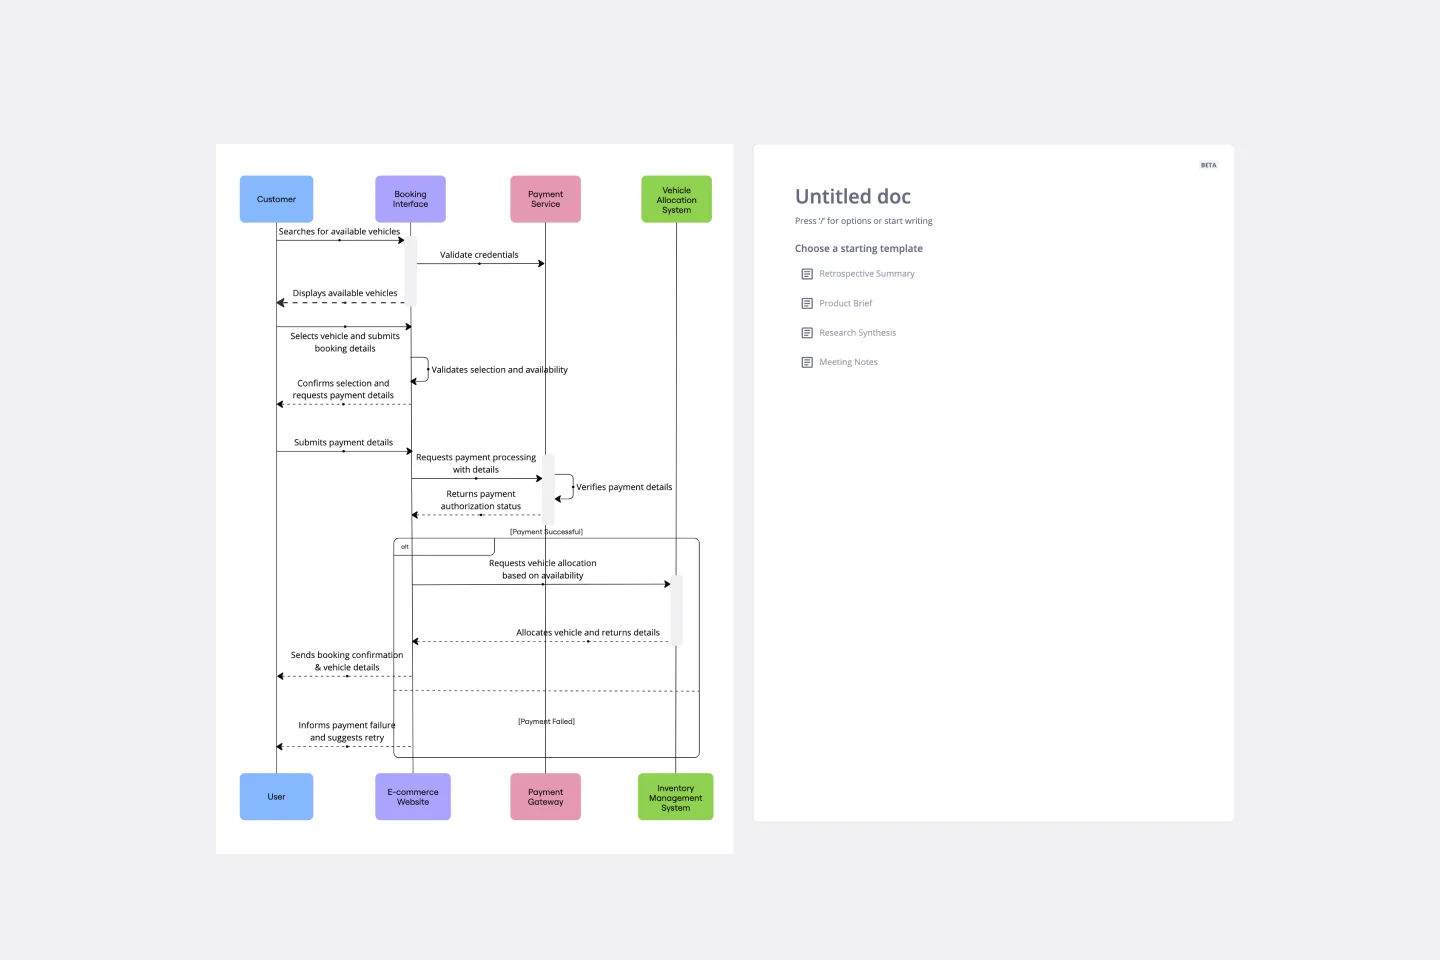
Alt (Alternative): Used for "If-Then-Else" scenarios.
Opt (Optional): Used for steps that only happen under certain conditions.
Loop: Used to show repetitive actions.
Strategic Components: The Anatomy of a Sequence Diagram
A professional Sequence Diagram template uses four core visual elements:
Actors & Objects: Represented at the top. Use the "Stick Figure" for human users and "Rectangles" for system components.
Lifelines: The vertical dashed lines indicating the existence of the object over time.
Messages: The horizontal lines representing communication.
Destruction X: A large "X" at the bottom of a lifeline to show when an object is deleted from memory (important for resource management).
Which Sequence Template Do You Need?
Common Pitfalls in Sequence Modeling