Table of contents
Table of contents
What is a Sequence Diagram in UML?
Summary
In this guide, you will learn:
- What a UML sequence diagram is and its purpose
- Key components and notations of sequence diagrams
- How different arrow types represent messages
- The role of fragments in depicting behaviors
- How sequence diagrams visually represent message flow
- The importance of sequence diagrams for understanding and documenting system behavior
Collaborative AI Workflows
Join thousands of teams using Miro to build the right thing, faster.
Defining what a UML sequence diagram is
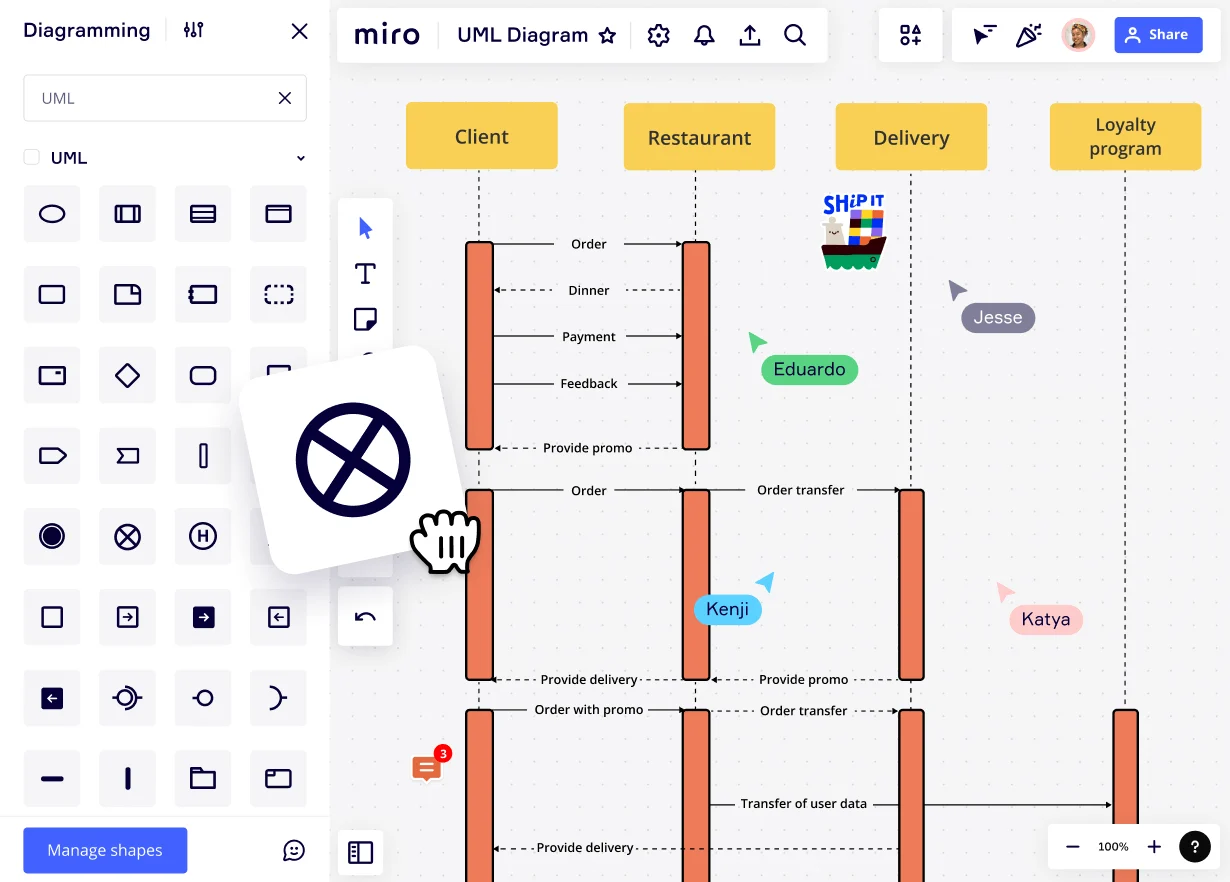
A UML sequence diagram is a graphical representation that depicts the interaction of objects in a system over time. These diagrams capture the sequence of messages exchanged between objects and the order in which these interactions occur, presenting them as vertical lifelines and horizontal arrows. Essentially, sequence diagrams provide a chronological visualization of object interactions, offering insights into the dynamic behavior and flow of a system.
Why is this visualization so essential? In the realm of software and system design, clarity, collaboration, and comprehensibility are paramount. Creating a UML sequence diagram can act as a visual playbook, ensuring that all stakeholders have a clear and shared understanding of the system’s behavior. This not only aids in accurate system development but also streamlines troubleshooting, modification, and collaborative efforts.
In this article we’ll dive deep into what sequence diagrams are, why they're helpful, and how to use them. By the end, you'll have a better understanding of these handy diagrams and feel more confident using them.
UML sequence diagram types
Sequence diagrams follow standardized UML notation to depict the interactions in a specific system behavior. You can use them to enhance understanding of complex software interactions, boost design efficiency, and improve communication within a project.
There are several types of sequence diagrams:
1. UML diagrams
In the context of UML, sequence diagrams provide a visual timeline of events in a software system. They're great for:
- Mapping the flow of control between system objects,
- Displaying how objects interact over time,
- Helping design, understand, and troubleshoot system architecture, leading to efficient software development.
2. Code-based diagrams
These diagrams are generated from software code. They’re great for:
- Source code generates the diagram, saving time and reducing errors,
- Simplifying understanding and debugging of code by visualizing program execution,
- Documenting software systems to support new team members.
3. PlantUML
PlantUML diagrams offer a streamlined approach to sequence visualization. They’re great for:
- Simplifying diagram-making using clear and concise syntax,
- Writing code-like scripts for efficient and flexible sequence diagram development,
- Ensuring consistency across different operating systems.
4. Mermaid
- Mermaid diagrams offer a dynamic option for sequence visualization, making them both simple and adaptable. They’re great for:
- Benefiting from an intuitive syntax that allows easy sequence diagram-making,
- Seamlessly embedding into markdown documents
- Interactive rendering — allowing users to zoom, pan, and interact with the diagram dynamically.
Knowing these types of sequence diagrams helps you choose the one that best suits your project requirements.
Key components of sequence diagrams
UML sequence diagrams include several crucial elements. Let's go over these components one by one:
Lifelines
Lifelines symbolize objects or components in a system.
You see them as vertical dashed lines with the name of the object or component at the top. As you move down the lifeline, it shows the passage of time.
In situations involving human interactions, lifelines can represent actors like users. For example, an online store system can have a lifeline for the customer, the shopping cart, and the payment processor.
Messages
These mark the interactions between lifelines.
You represent them as arrows or lines with different notations. In an online store, a message could symbolize a customer adding an item to the shopping cart.
There are different kinds of messages:
Synchronous messages:
shown as solid arrows with filled arrowheads. The sender waits for a response before continuing.
Asynchronous messages:
presented as solid arrows with open arrowheads. The sender doesn't wait for a response before moving forward.
Reply messages:
These are dashed arrows with open arrowheads, indicating the return of information from a receiver to the sender.
Activation bars
These show the length of an object's activity or processing time.
In an online store system, an activation bar for the payment processor could depict the time it takes to process a payment.
Activation bars are thin rectangles over an object's lifeline, beginning when the object becomes active and ending when it's no longer active.
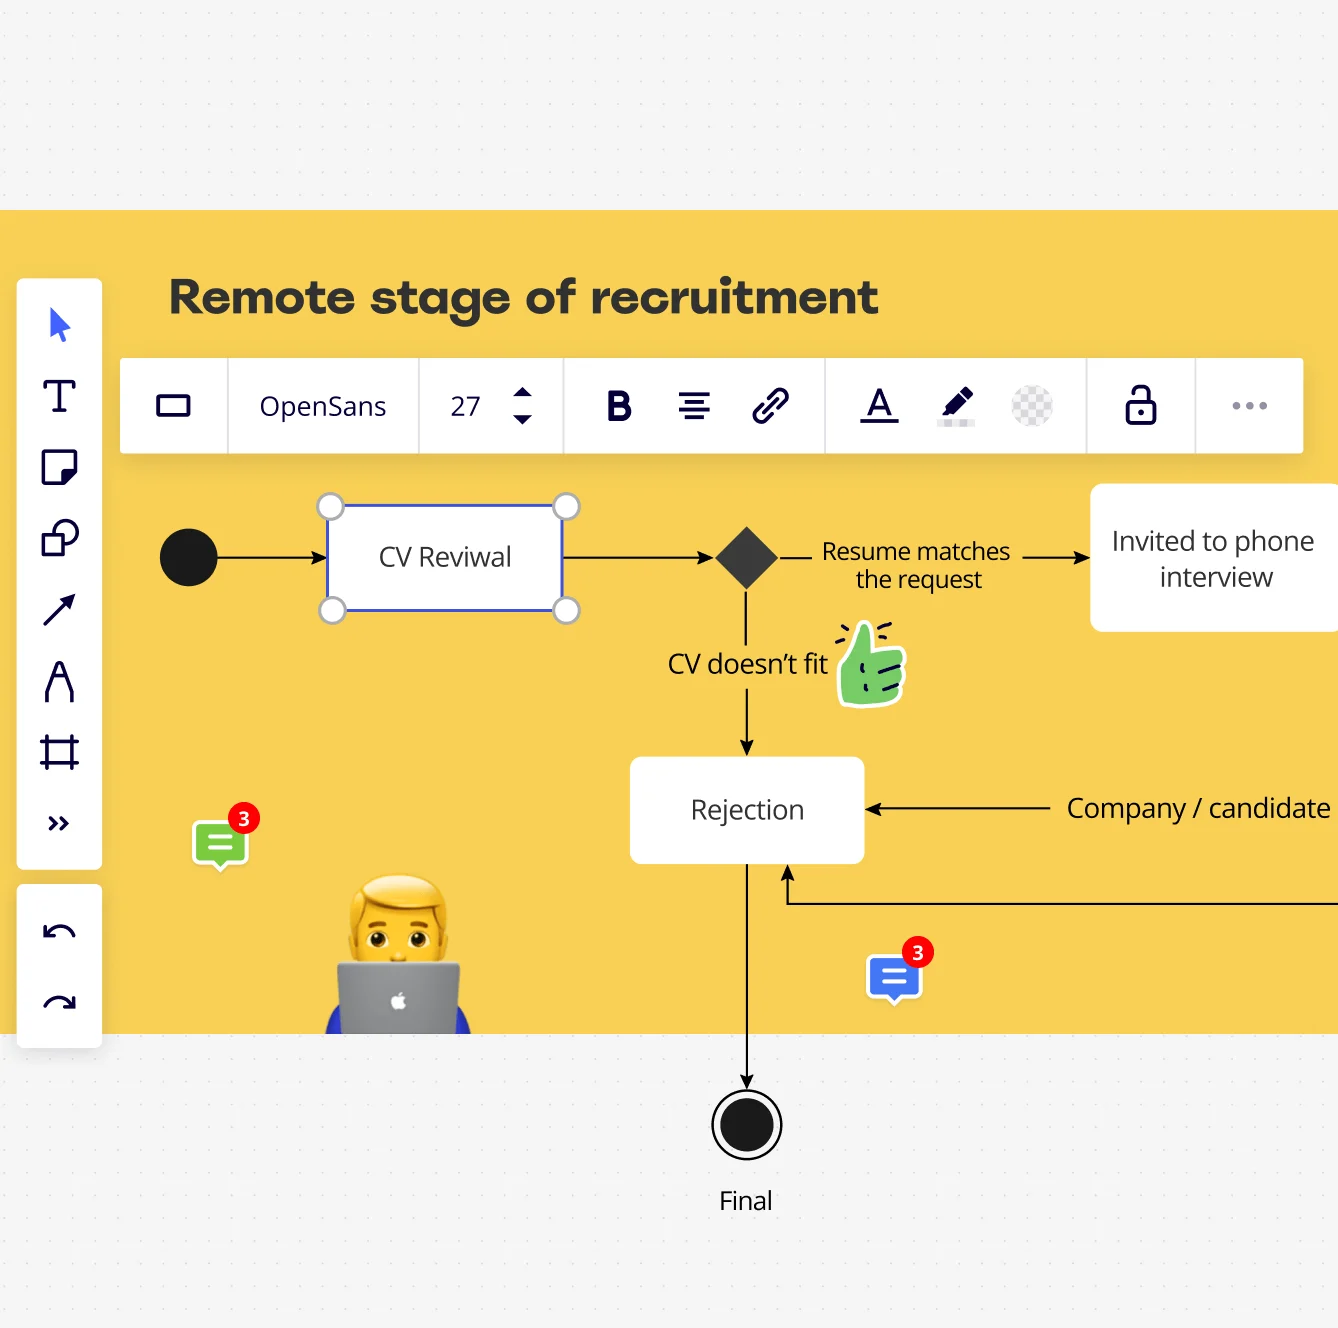
Fragments
These encapsulate complicated or conditional behaviors like loops or alternatives.
For example, in an online store, a loop fragment could symbolize a customer repeatedly adding items to their shopping cart until ready for checkout.
Fragments are boxes with a label in the top-left corner showing the fragment type:
Alternative (alt):
Represents conditional behavior where only one of several interactions will occur based on specific conditions.
Option (opt):
Symbolizes an optional interaction that occurs only if a certain condition is met.
Loop (loop):
Shows a repeating sequence of interactions that'll occur as long as a given condition is true.
Parallel (par):
Used for concurrent interactions that can happen simultaneously within the system.
Understanding these components allows you to comprehend and communicate complex interactions in software systems. You can also better visualize them using a UML component diagram.
Notations and symbols in UML sequence diagrams
UML sequence diagrams employ various notations and symbols to convey components and interactions. Knowing these notations helps you create, understand, and share complex interactions.
Vertical dashed lines
These represent lifelines, illustrating the lifespan of an object or a component in a system. The object or component's name is located at the top of these lines.
Solid arrows with filled arrowheads
These show synchronous messages. When you see a solid arrow with a filled arrowhead, it indicates that the sender sends a message and then waits for a response before proceeding.
Solid arrows with open arrowheads
These arrows depict asynchronous messages. This means the sender sends a message and doesn't wait for a response before continuing.
Dashed arrows with open arrowheads
This notation represents reply messages. These arrows illustrate the return of information from the receiver to the sender.
Thin rectangles superimposed over a lifeline
These rectangles represent activation bars. They indicate the duration an object or actor is active or interacting.
Box with a label in the top-left corner
This symbol is used to denote fragments. The label in the top-left corner indicates the fragment type (alternative, option, loop, or parallel), encapsulating complex or conditional behaviors in your system.
Creating a UML sequence diagram
Creating a sequence diagram can seem challenging, especially for complex systems.
However, with careful planning and understanding of the system – including a good UML diagram tool – you can create a clear, efficient sequence diagram that illustrates the interactions among system components over time. You can diagram from scratch or use Miro's sequence diagram template to help you get started. Here are tips for making a sequence diagram successfully:
1. Identify the actors and the system
Start by outlining who or what interacts with the system.
This can be a user, another system, or an external device. It's important to remember that the actors and the system they interact with are the main components you're showcasing in your diagram.
2. Define the scope of the sequence diagram
Before you begin creating your diagram, you need to define its scope.
Will you showcase a single use case, a particular feature, or an entire system process? Knowing what you're trying to represent will guide your diagram creation.
3. Identify the lifelines
Lifelines represent individual components in your system and their interactions over time.
They're depicted as vertical lines, with interactions represented as horizontal lines or arrows. Identifying the lifelines involved in your system process or use case helps you set the stage for your sequence diagram.
4. Identify and illustrate the interactions
Interactions are the heart of your sequence diagram.
This step involves deciding which lifelines interact with one another, how they communicate, and the sequence of these interactions. Understanding these interactions is critical for representing your system process.
5. Add activation bars
An activation bar, depicted as a thin rectangle on a lifeline, showcases when an object or actor is active or has control. Adding these bars helps clarify the sequence and timing of interactions.
6. Draw messages
Use arrows to represent interactions between objects or actors. Make sure the arrows point from the sender to the receiver and are labeled with the name of the message.
7. Use fragments for complex behaviors
Sometimes, your system process or use case might include complex behaviors like loops, conditions, or parallel processes.
Fragments allow you to encapsulate these behaviors in your diagram, providing a clear representation of more complex interactions.
8. Review and refine your sequence diagram
After laying out your diagram, take the time to review and refine it. Make sure it captures the system process or use case and that it's easy to understand.
When to use a sequence diagram
UML sequence diagrams are especially useful for visualizing and understanding the interactions between different parts of a system over time. Here's when you might consider using a UML sequence diagram:
Understanding system behavior
If you want to capture the behavior of a system, especially the interactions between objects and components, a sequence diagram can visually represent these interactions over time.
Modeling use cases
When you have a specific use case scenario and want to visualize how different system components interact during that scenario, a sequence diagram is a fitting choice. It provides a step-by-step breakdown of the messages exchanged between objects during the use case's execution.
Designing new systems or features
Before coding begins, sequence diagrams can provide a clear and visual guide for developers to understand how different parts of the system will communicate. This can help identify potential issues or optimization opportunities in the design phase.
Documenting existing systems
For complex systems where the interactions might not be immediately obvious, sequence diagrams can serve as documentation to help new team members understand how parts of the system interact.
Detecting and addressing issues
By visualizing the sequence of operations, potential bottlenecks, unnecessary interactions, or problematic sequences can be identified. Sequence diagrams can be instrumental in optimization and debugging efforts.
Representing concurrent processes
If a system has concurrent operations that need to be visualized simultaneously, sequence diagrams can capture these interactions with parallel lifelines and activations.
Showing object creation and destruction
For systems where the lifecycle of objects is crucial, sequence diagrams can capture moments of object creation and destruction clearly.
While sequence diagrams are powerful, it's also important to recognize when not to use them. If you're aiming to depict static relationships between classes or the structure of the system, other UML diagrams, like class diagrams or component diagrams, might be more appropriate. Always choose the diagram type based on the specific aspect of the system you want to visualize or communicate.
How to read a UML sequence diagram
- Begin from the top of the diagram and proceed downward, tracing the messages exchanged between objects or actors.
- Pay close attention to the message types as they hint at different kinds of interactions (such as synchronous or asynchronous).
- Look for fragments to interpret conditional or repeated behaviors in the sequence.
- Refer to activation bars to ascertain when an object or actor is actively participating in the process.
Best practices for UML sequence diagrams
Creating clear, effective UML sequence diagrams requires understanding best practices and advanced techniques.
Best practices
- Simplicity: Keep your diagrams as simple as possible. Focus on capturing essential interactions and avoiding unnecessary details that can lead to confusion.
- Naming conventions: Use consistent and meaningful names for objects and messages to make the diagrams easy to understand.
- Color and formatting: Apply different colors and styles to distinguish between various diagram components, enhancing readability.
- Modularization: If you have complex scenarios, break them down into smaller, related diagrams. This division can make them easier to comprehend.
- Annotations: Use comments and notes to provide additional context or explain complex interactions.
Advanced techniques
- Refactoring: If your diagram is too complicated, break it down into smaller, more digestible parts.
- Nested fragments: Represent complex conditions or combinations of behaviors using nested fragments.
- Stereotypes: Define custom properties or constraints for elements in your diagram using stereotypes.
- Combined fragments: Represent multiple fragments that share common elements with combined fragments. This technique can simplify your diagram.
- Interaction use: Reuse parts of other sequence diagrams to avoid repeating common sequences. This strategy can make your diagrams more streamlined and efficient.
By following these, you'll create UML sequence diagrams that are both effective and easy to understand.
Author: Miro Team
Last update: October 10, 2025