State Machine Diagrams in UML: A Complete Guide
Summary
In this guide, you will learn:
- What a UML state machine diagram is and its role
- Fundamental components and notations (states, transitions, events)
- How state machine diagrams represent lifecycle and state-dependent behavior
- Structure and elements (composite states, regions, pseudostates)
- Differences between UML and traditional finite state machines (hierarchical states)
- Practical applications and examples
Collaborative AI Workflows
Join thousands of teams using Miro to build the right thing, faster.
If you're looking to create a robust and efficient system, it's essential to understand the concepts and principles behind UML state machine diagrams.
Unified modeling language (UML) is a widely-used modeling language that helps software developers create complex systems using visual models. One of the most important diagrams is the UML state machine diagram, which helps to model the behavior of an object or system over time.
This article is a comprehensive guide to UML state machine diagrams. We'll provide an overview and cover the different types of state diagrams. On top of that, we'll show you how to create a UML state machine diagram and explain the notions and symbols to be used.
Introduction to UML state machine diagrams
State machine diagrams are a powerful tool used to show the behavior of a system or object in response to events or changes. Developers use it to plan or understand the system's workflow and decision-making processes. These diagrams are particularly useful in modeling complex systems or those with many states or interactions between states.
When creating a state machine diagram, developers can visualize how a system behaves over time or in response to various events. This allows them to identify potential issues and optimize the system's performance.
Purpose of state machine diagrams
The primary purpose of a state machine diagram is to model the behavior of an object or system over time or in response to events. By using graphical representations of states, transitions, and events, developers can understand a system's workflow and decision-making processes.
Therefore, developers can identify potential issues and optimize the system's performance. State machine diagrams are particularly useful in modeling complex systems that involve a lot of decision-making or those with many states or interactions between states.
They're used to model a wide range of systems, from simple machines to complex software systems.
Example of when to use a state machine diagram
Let's look at a simple example: a user login process on a website or app. This illustrates how state machine diagrams visualize various states users can navigate while logging in. In this example, the main states are as follows:
- Idle state: the user isn't logged in
- Entering user information: the user enters a username and password
- Validating user information: the system checks if the username and password match
- Logging in: the user successfully logs into the account
- Failing: the username or password is incorrect
When users correctly enter their username and password, they'll transition from the 'entering user information' state to the 'logging in' state. Otherwise, they'll return to an 'idle' state if either username or password is incorrect. This example demonstrates how powerful state machine diagrams can be for understanding complex processes accurately and effectively.
Key components
State machine diagrams contain three key components: states, transitions, events, and actions.
States represent the different states or conditions that the system can be in. Transitions show the paths between those states. Events depict the various triggers that can cause the system to move from one state to another. And actions are what happens when an event triggers a state change. Together, these components create a visual representation of the system's behavior.
States can be either simple or composite. Simple states refer to a single state or condition, while composite states represent a group of states or conditions. Additionally, transitions can also be either simple or composite. A simple transition represents a direct path between two states. And composite transitions represent a more complex path that involves multiple states.
Events can be either internal or external. Internal events are triggered within the system. However, an external source triggers external events. Developers use events to model how the system responds to different triggers and transitions between states.
Types of state machine diagrams
State machine diagrams are a type of behavior diagram used in UML modeling to describe the behavior of a system. There are two main types of state machine diagrams: behavioral state machines and protocol state machines.
Behavioral state machines
Behavioral state machines are a more common type of state machine. They're used to model systems that have complex behavior, such as a traffic light system or a vending machine. In a behavioral state machine, the system's behavior is modeled as a series of states, transitions, and events. The states represent the different possible conditions or modes that the system can be in. On the other hand, transitions represent the events that cause the system to change from one state to another.
For example, in a traffic light system, the states might include "green light," "yellow light," and "red light." Events such as a timer running out or a car approaching the intersection trigger the transitions between these states.
Behavioral state machines are particularly useful in modeling complex systems with many possible states and transitions.
Protocol state machines
Protocol state machines are used to model systems that operate based on a specific protocol or set of rules. In a protocol state machine, the system's behavior is modeled as a set of constraints on the transitions between states. The states represent the different possible conditions or modes that the system can be in, while the constraints represent the rules that govern the transitions between these states.
For example, in a communication protocol, the states might include "idle," "transmitting," and "receiving." The constraints between these states would specify the rules for transmitting data, including things like error checking and flow control.
Systems with strict rules about operating, such as a communication protocol or a database system, are usually modeled via protocol state machines. They help designers and developers to ensure that the system operates correctly and consistently and to identify potential problems or areas for improvement.
Steps to create a UML state machine diagram
Creating a state machine diagram involves representing the various states an object can be in and the transitions between those states. Here are the steps to follow to begin crafting one:
1. Identifying states and transitions
The first step in creating a state machine diagram is to identify the different states and transitions that the system can have. As we’ve said, states represent the different conditions or situations that the system can be in. And transitions represent the paths between those states. Identifying all possible states and transitions is important to create a complete and accurate diagram.
For example, if you are designing a vending machine, the different states could be "Idle," "Money Inserted," "Product Selected," "Dispensing," and "Product Dispensed." The transitions between these states could be "Insert Money," "Select Product," "Dispense Product," and "Return Change."
2. Defining events and actions
Once the states and transitions are clear, the next step is to define the events and actions that occur in the system. Events represent the triggers that move the system from one state to another. And actions represent the behavior or process that occurs in response to an event. You need to define all possible events and actions to create a complete and accurate diagram.
For the vending machine example, the events could be "Money Inserted," "Product Selected," "Product Dispensed," and "Change Returned." The actions could be "Check if enough money is inserted, "Dispense the selected product," and "Return change if necessary."
3. Organizing diagram elements
The last step is to put everything on the diagram. You can do this by using a variety of notations and symbols. These represent the different states, transitions, events, and actions in the system. And there are state notation, transition notation, pseudostate notation, and composite state notation.
If you'd prefer, you can use Miro's state machine diagram template to help you get started. Its fully customizable and can be changed according to your needs.
Notations and symbols in UML state machine diagrams
Understanding UML notations and symbols is crucial for building accurate and effective state machine diagrams. Let's dive deeper into some of the most common notations and symbols:
State notation
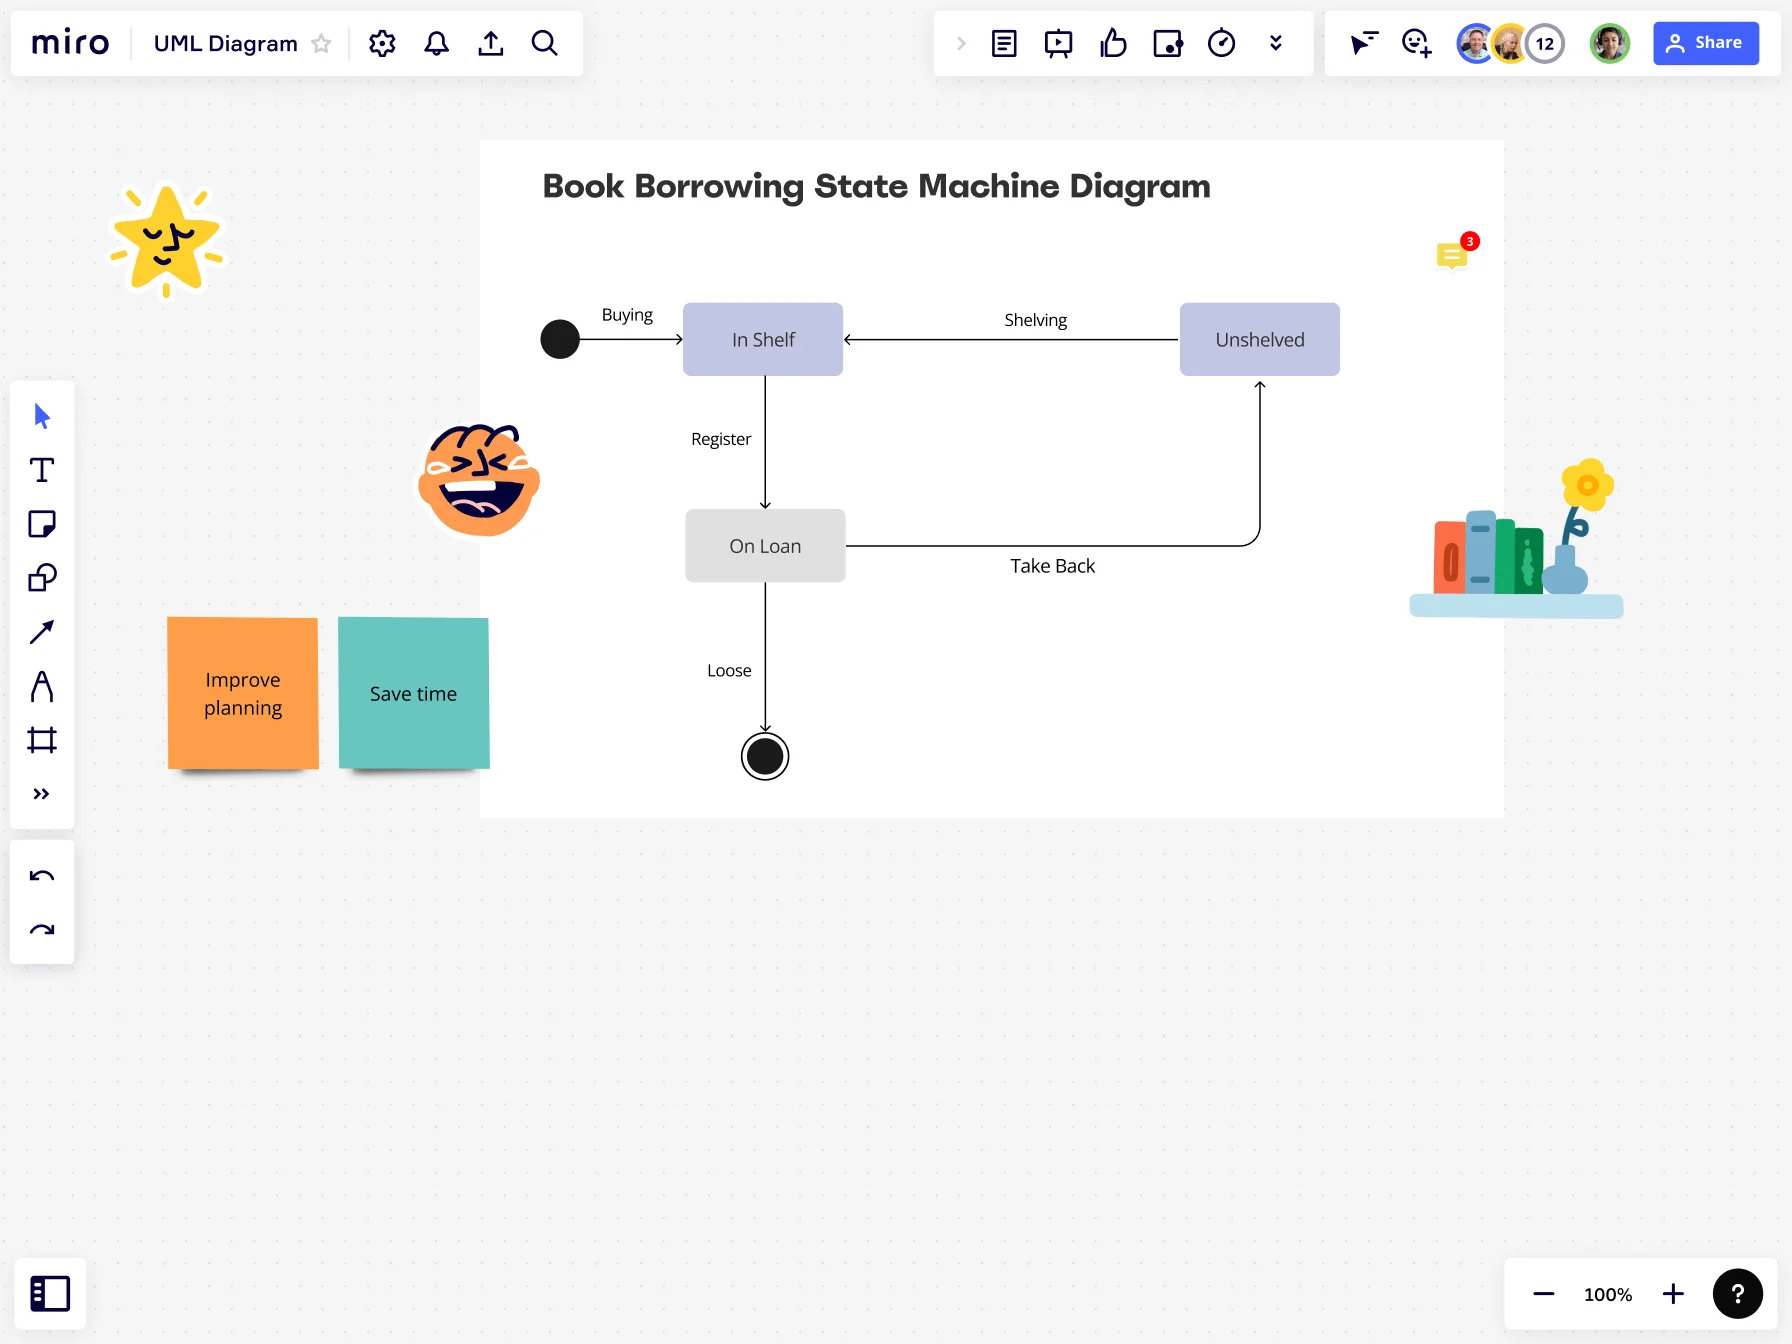
States are the building blocks of a state machine diagram. They represent the different states that a system can be in. States are depicted using a rectangle with rounded corners. The rectangle contains the name of the state. The initial state is represented by a filled circle attached to the rectangle, while the final state is denoted by a circle with a dot inside attached to the rectangle.
For example, if we were modeling a traffic light system, we might have states for "Green Light," "Yellow Light," and "Red Light." The initial state would be "Red Light," and the final would be "Green Light."
Transition notation
A transition represents the movement between states in a state machine diagram. A line depicts them connecting the two states. The trigger for the transition is written next to the line, while the action that occurs during the transition stands above the line. Optional, you can add guards to a transition to specify additional constraints on the transition.
For example, a transition from "Green Light" to "Yellow Light" might be triggered by a timer, and the action during the transition might be to turn on the yellow light. A guard might be added to ensure that the transition only occurs if no cars are in the intersection.
Common transition types are:
- Incoming transition
- Internal transitions
- Outgoing transitions
- Single transition
- Finite state transitions
Pseudostate notation
You can model a decision, entry, or exit point with a pseudostate. A small circle represents this temporary state with a letter inside. They're used to model complex transitions that involve multiple conditions or actions.
For example, a pseudostate represents a decision point in a traffic light system. If no cars are waiting at the intersection, the system might transition directly from "Red Light" to "Green Light." However, if cars are waiting, the system might transition to a pseudostate that evaluates whether there are cars in all directions before transitioning to "Green Light."
Some commonly used transition types are:
- Entry pseudostate
- Choice pseudostate
- Terminate pseudostate
- Deep History pseudostate
Composite state notation
A composite state is a state that contains sub-states. These composite states are represented using a rectangle with rounded corners. This rectangle contains smaller states, transitions, and other diagram elements. They're used to model complex systems that have multiple levels of states.
For example, a composite state might model a traffic light system with multiple intersections. The top-level state might represent the entire system, while the sub-states represent an individual intersection. Each sub-state would have its own states and transitions, allowing for a more detailed and accurate system model.
You can create accurate and effective UML state machine diagrams by understanding these notations and symbols. Whether you are designing a traffic light system, a vending machine, or a complex software application, state machine diagrams are essential for ensuring your system behaves correctly and efficiently.
Author: Miro Team
Last update: October 10, 2025