The ultimate guide to UML diagrams
Summary
In this guide, you will learn:
- What UML diagrams are and their role in visualizing software
- Who uses UML diagrams and why they are important
- The different types of UML diagrams
- How UML diagrams simplify designs and improve communication
- When and how UML diagrams are applied in development
- The benefits of using UML diagrams
If you’re familiar with software design, you’ve probably already come across UML diagrams — but what exactly are they, who are they for, and how do you go about making one? We’ve put this quick guide together to answer both these questions and more, covering everything you need to know about UML diagrams. Let’s get to it!
Collaborative AI Workflows
Create UML diagrams easily with Miro's intuitive tool for online collaboration.
What is a UML diagram?
What is a UML diagram? A UML diagram is a way to visualize systems and software using Unified Modeling Language (UML). Software engineers create UML diagrams to understand the designs, code architecture, and proposed implementation of complex software systems. UML diagrams are also used to model workflows and business processes. Coding can be a complicated process with many interrelated elements. There are often thousands of lines of programming language that can be difficult to understand at first glance. A UML diagram simplifies this information into a visual reference that’s easier to digest. It uses a standardized method for writing a system model and capturing conceptual ideas.
Beyond code, UML diagrams are also great for visualizing relationships and hierarchies within software components, similar to decision trees or flowcharts — but specific to software.
By making complex systems easier to grasp, UML diagrams help engineers and non-technical team members alike track project progress and communicate effectively throughout the software development process. They break down software into essential parts and make it easier to understand how everything fits together.
Types of UML diagrams
There are two subcategories of UML diagrams: structural diagrams and behavioral diagrams.
Structural diagrams visualize the components that make up a system and the relationship between them — showing the static aspects of a system. Behavioral diagrams, on the other hand, represent what happens within a system — including how the components interact with each other and with other systems or users.
Structural diagrams
Let’s take a look at a few specific types of structural UML diagrams.
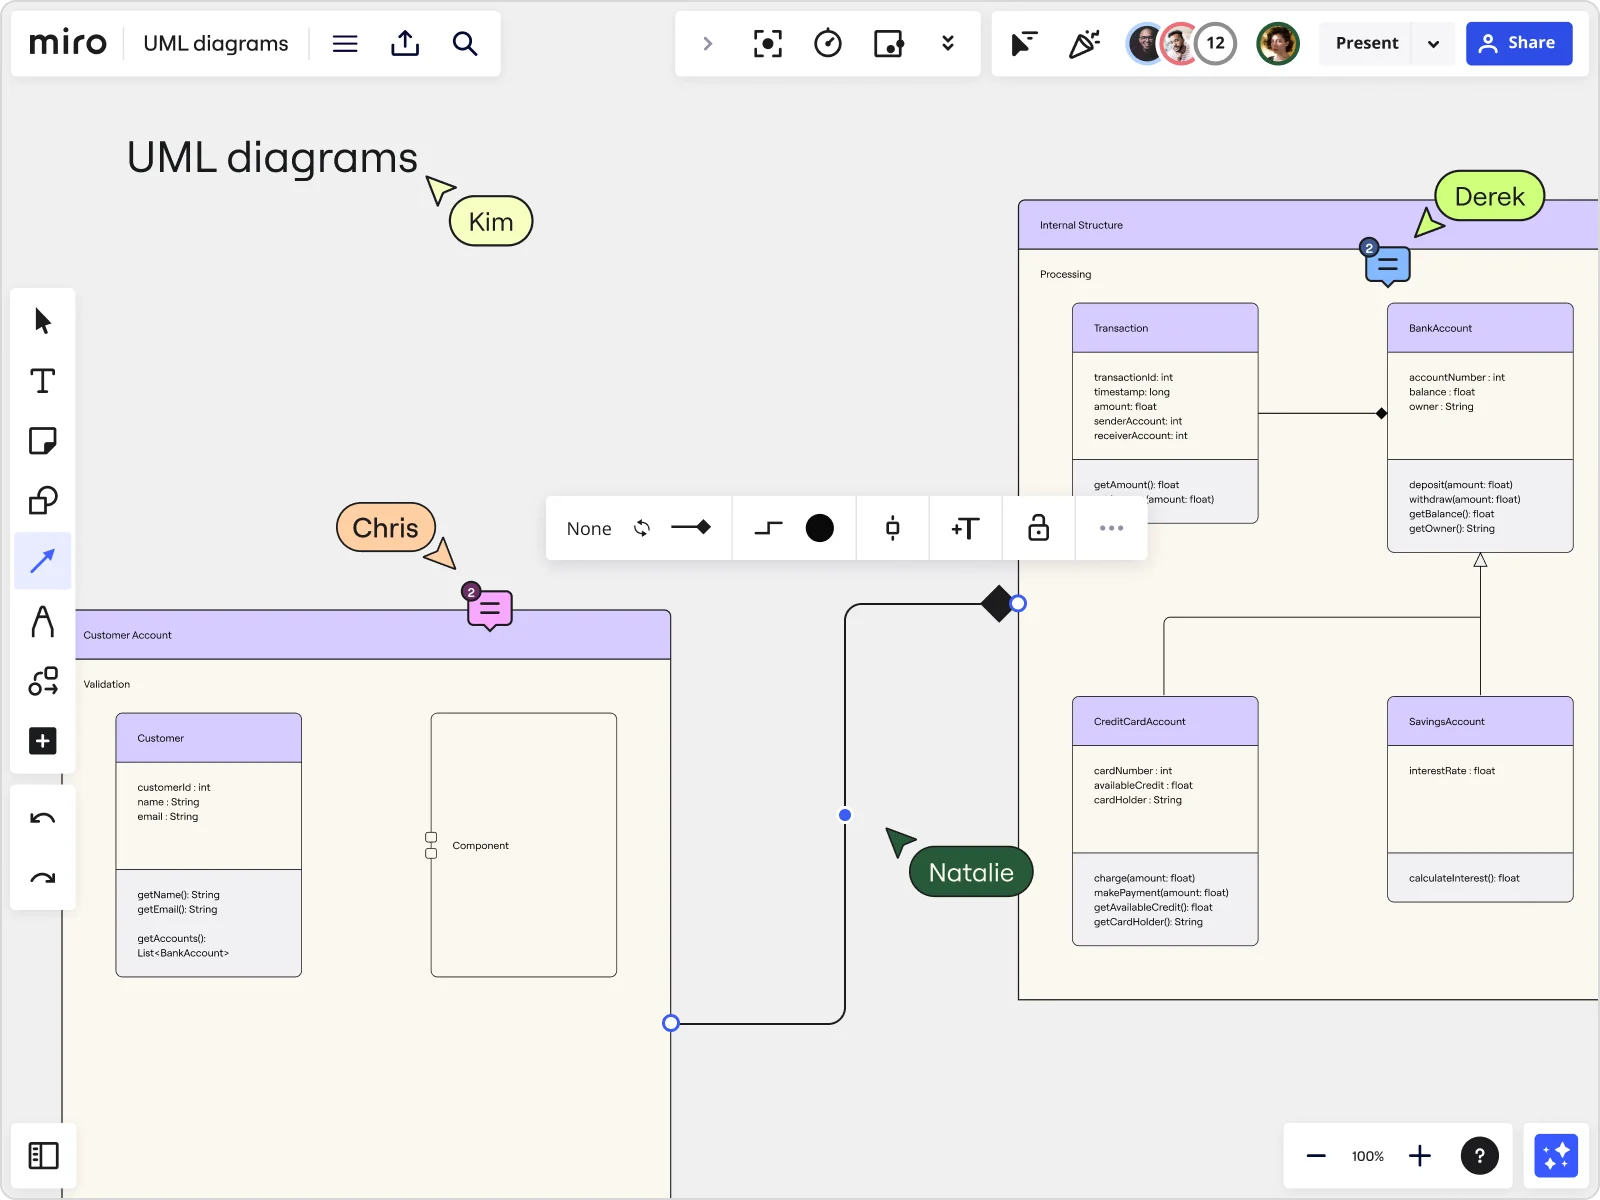
Class diagram
A UML class diagram is important for object-oriented design, visually representing the static structure of a system. It shows classes, their attributes, operations, and relationships using rectangles. For instance, software engineers and business stakeholders use these diagrams to visualize the structure and interactions within a software application.
You can easily create these diagrams using a UML class diagram tool.
Package diagram
A package diagram organizes and shows dependencies between packages, which can contain various elements like classes, use cases, and other packages. Think of it as organizing different parts of a system into folders, making it easier to manage and understand the overall architecture.
Object diagram
A UML object diagram captures a snapshot of a system at a specific point in time, showing actual instances of classes with their current attribute values and relationships. An object diagram shows the building as it stands, making it particularly useful for debugging or validating that your class design behaves as intended in the real world.
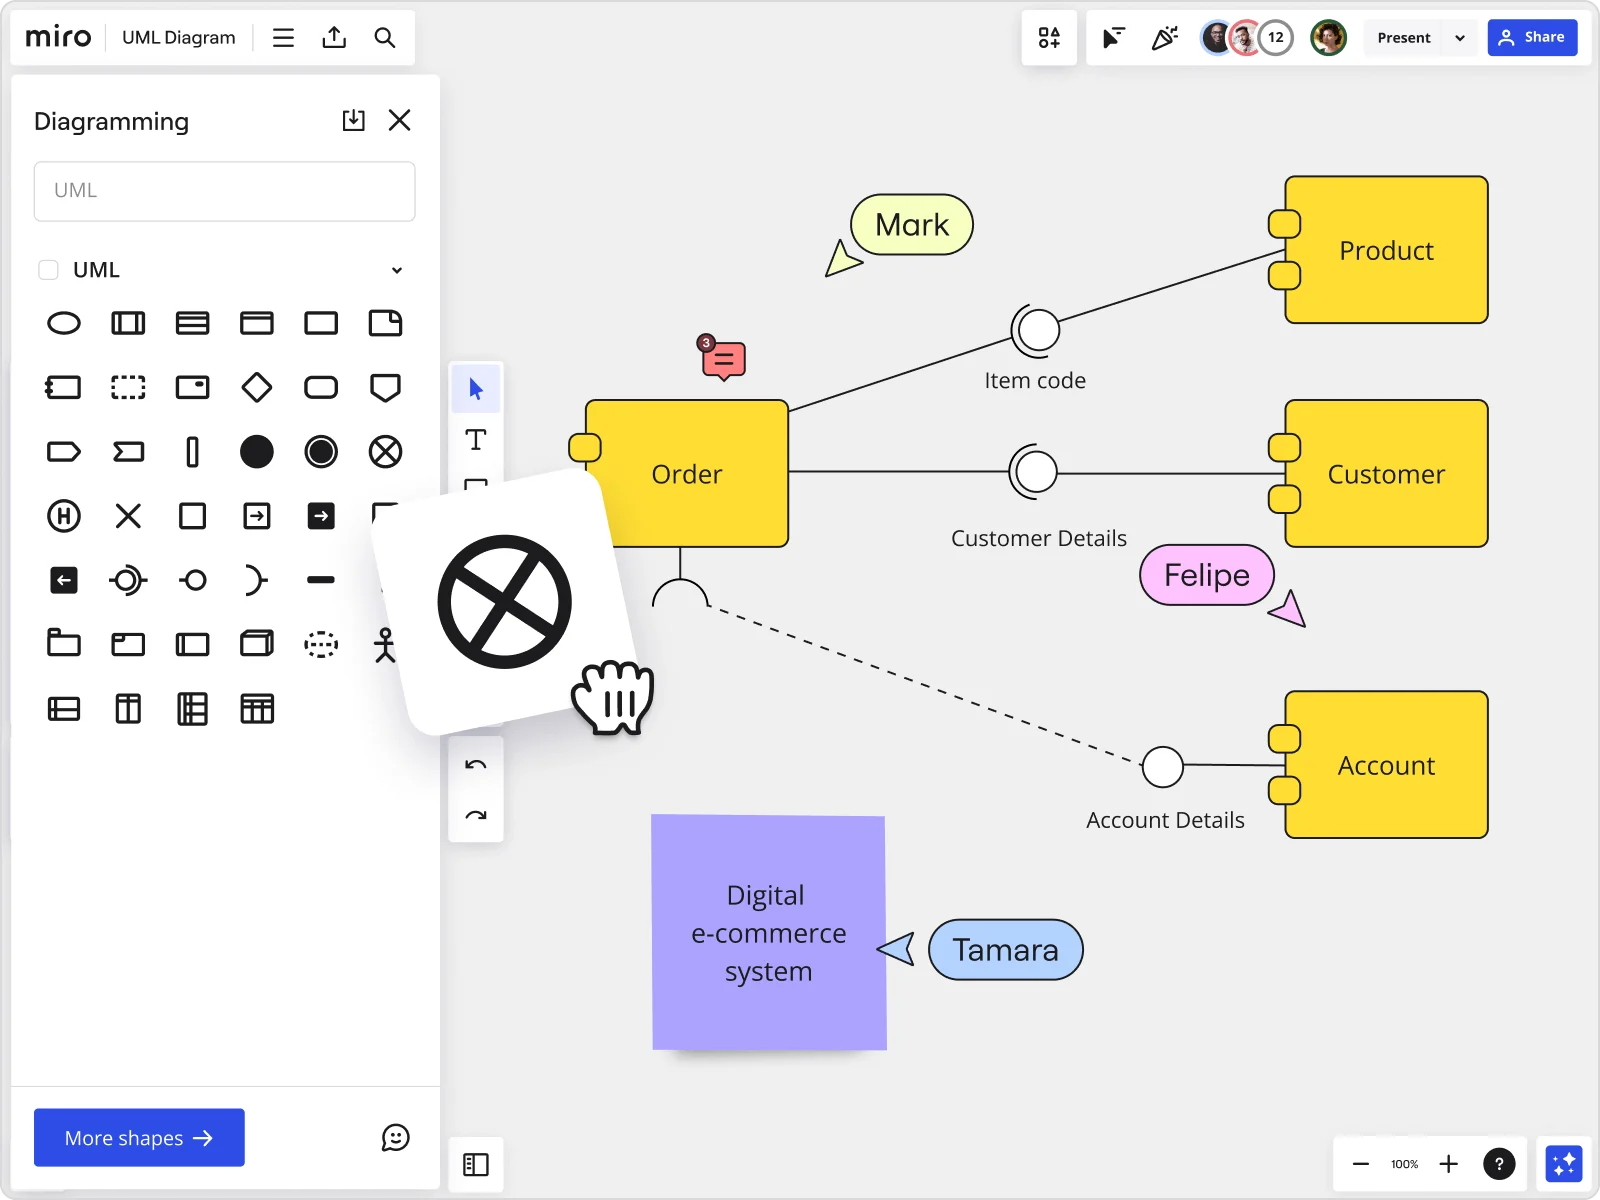
Component diagram
Component diagrams visualize the internal structure of a class, including its parts, interfaces, and collaborations. They provide insights into how components interact within the larger system architecture, helping to understand the organization and dependencies of software elements.
You can easily create one using a user-friendly UML component diagram tool.
Deployment diagram
Deployment diagrams visualize the physical deployment of software components across nodes in a distributed system. They show how software and hardware interact and are essential for planning and visualizing system deployments in various environments.
Composite structure diagram
Composite structure diagrams visualize the internal structure of a class, including its parts, interfaces, and collaborations. They provide insights into how components interact within the larger system architecture, helping to understand the organization and dependencies of software elements.
Behavioral diagrams
Let’s take a look at some specific examples of behavioral UML diagrams.
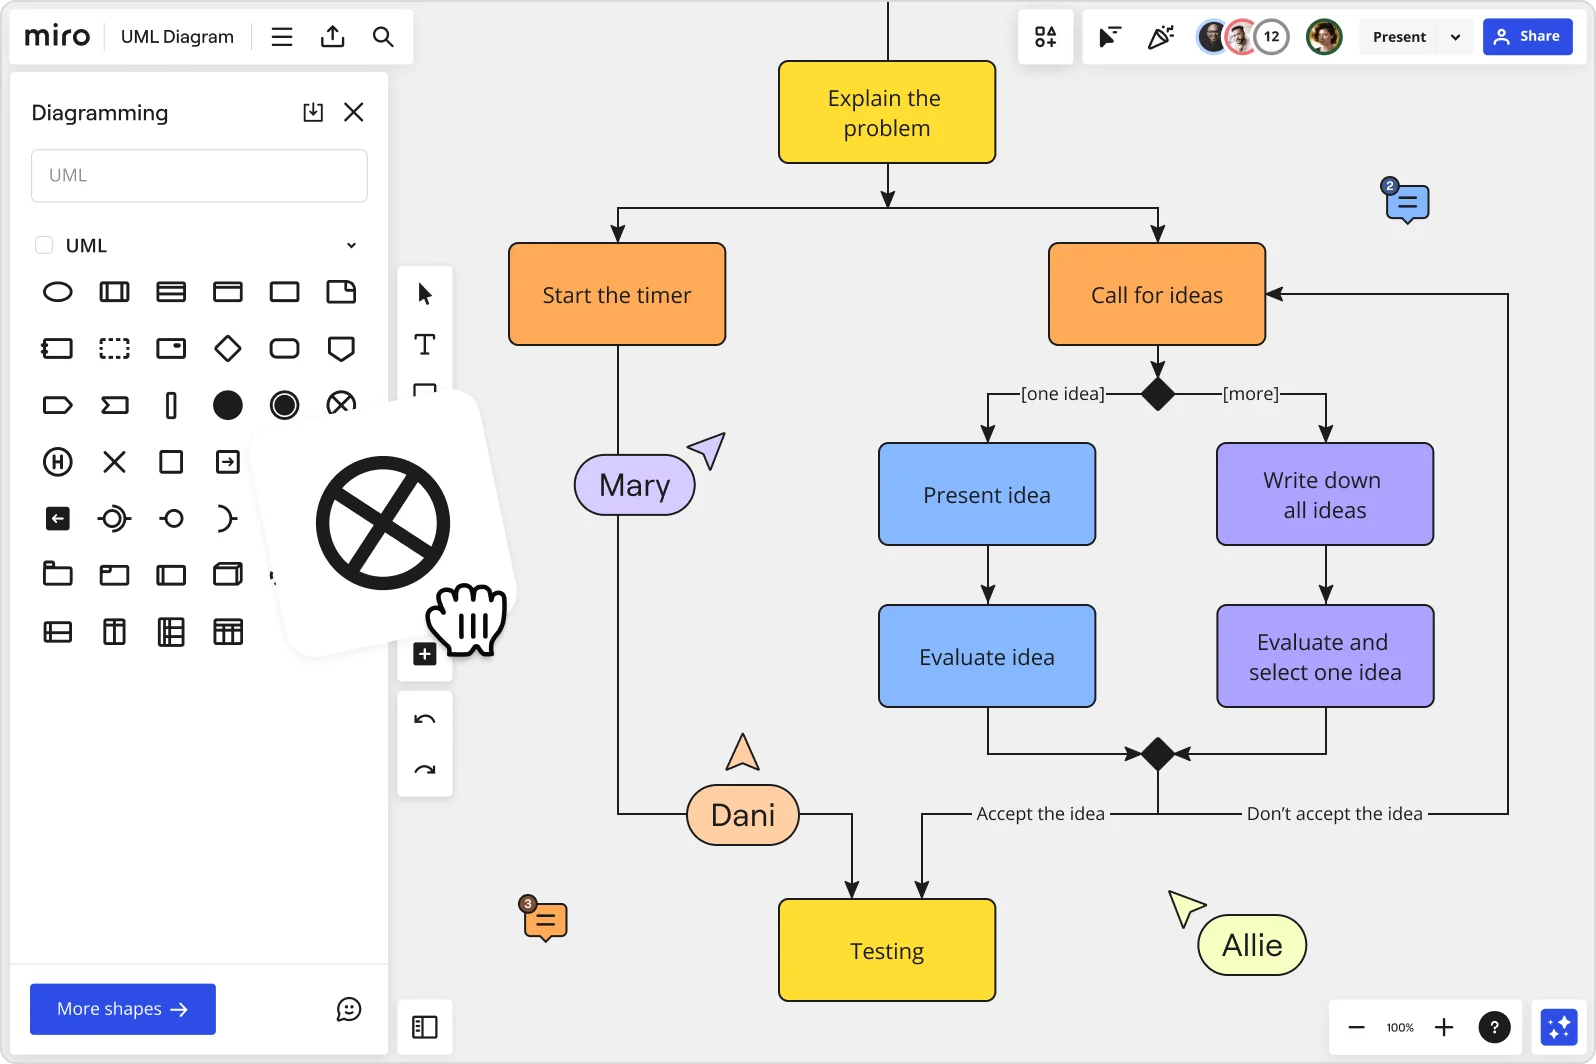
Activity diagram
Activity diagrams are essentially flowcharts that visualize the flow of activities within a system. They depict the sequence of actions, decision points, and concurrent activities, making them useful for modeling business processes and system behaviors.
Using an intuitive UML activity diagram maker is the best way to create these diagrams.
Sequence diagram
UML sequence diagrams show how objects interact over time, visualizing the order of messages exchanged between objects. They are particularly effective in illustrating the dynamic interactions between different components in a system.
Developers and business professionals often use sequence diagrams to understand how to structure a new system or improve an existing process. You can easily create them using an online UML sequence diagram.
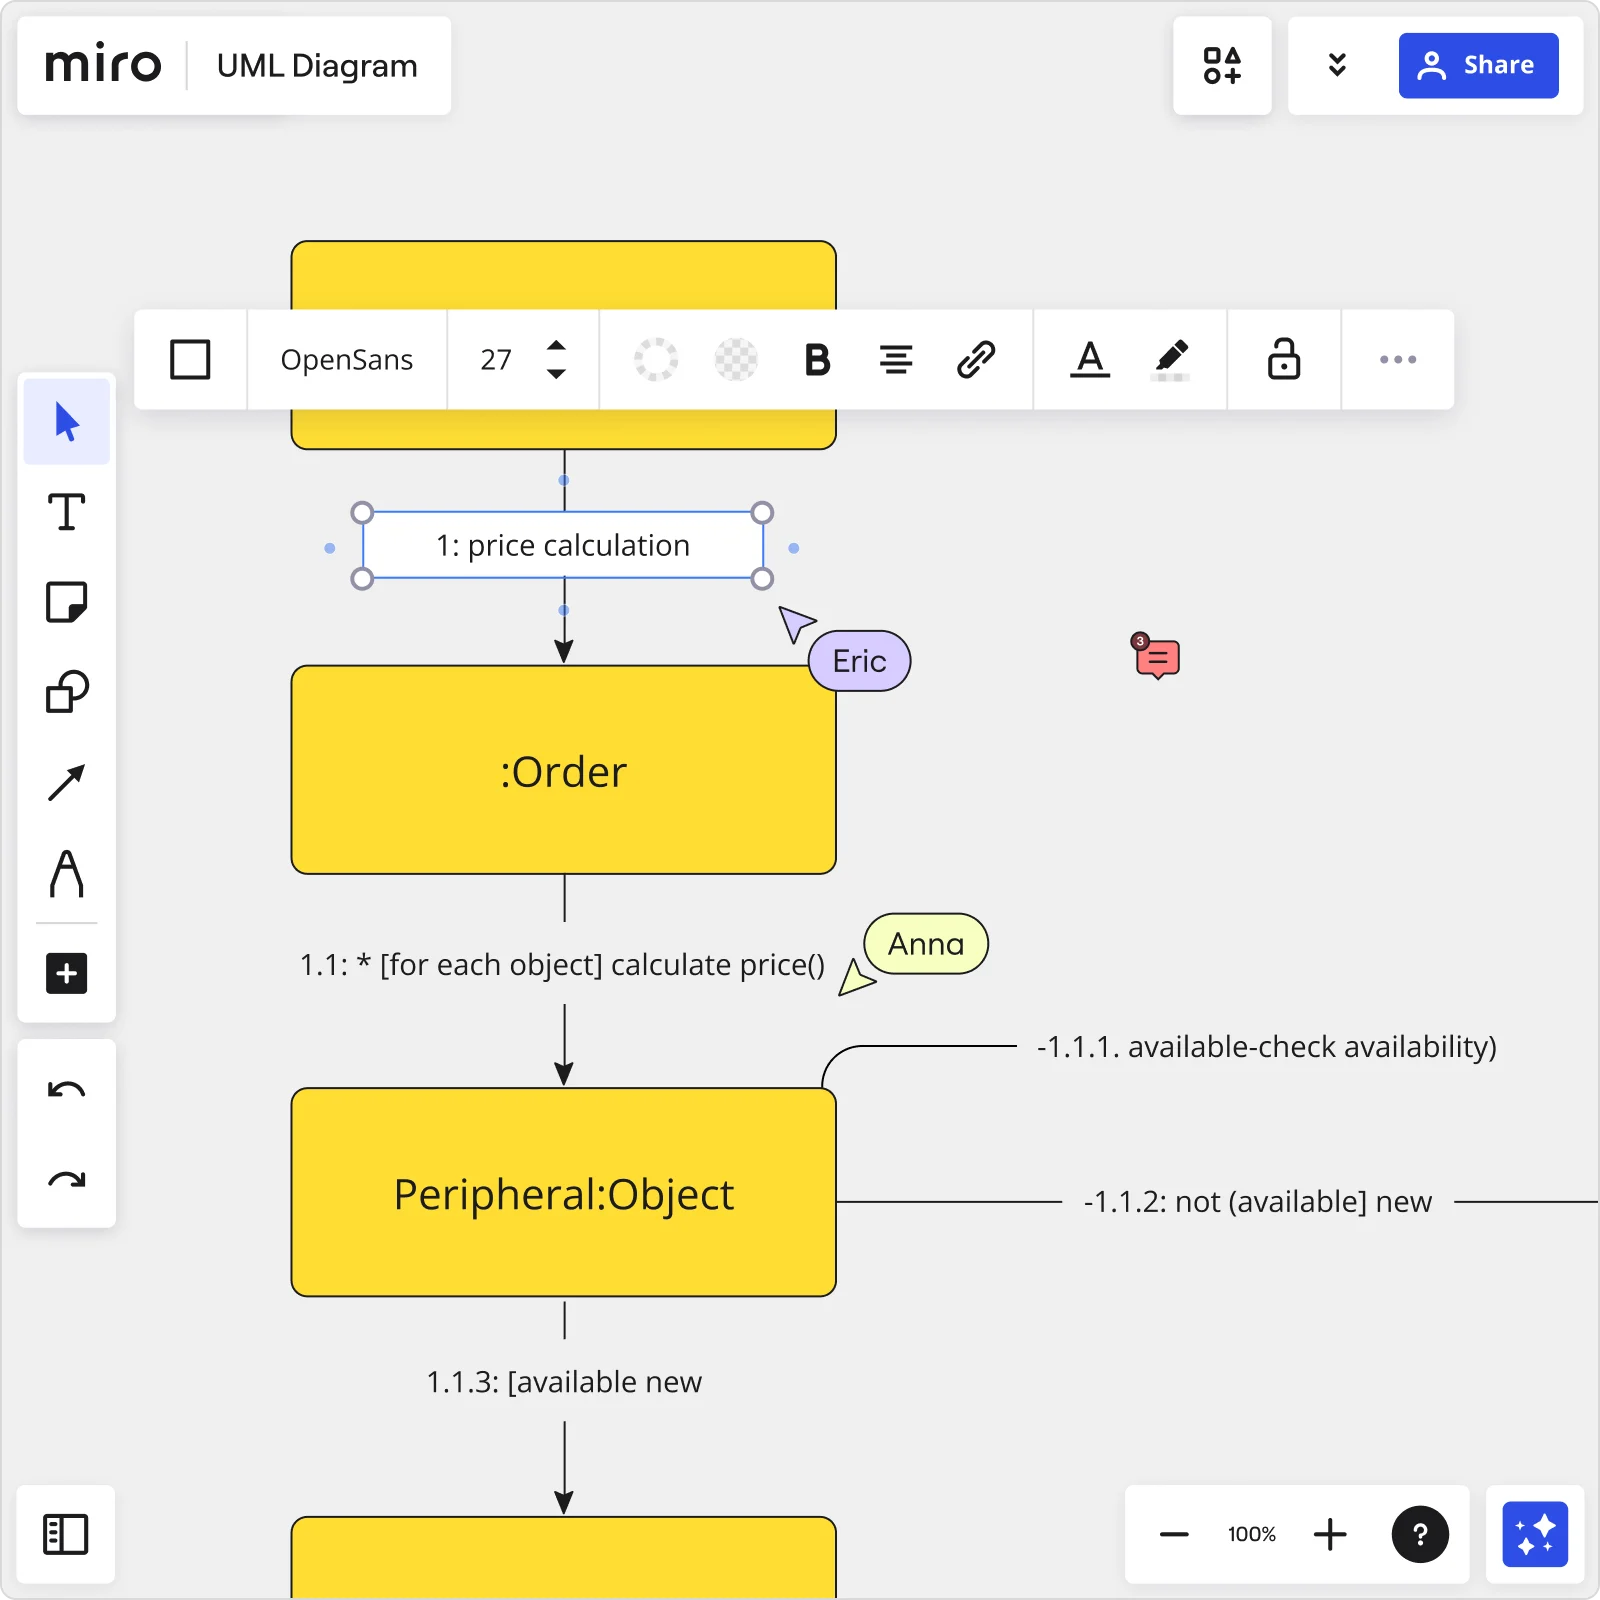
Communication diagram
A UML communication diagram (also called a collaboration diagram) shows how objects interact to accomplish a task, with numbered messages on connecting lines indicating order. It carries the same information as a sequence diagram but focuses on structural relationships rather than time sequence. It makes it better suited for understanding which objects communicate with each other and why.
You can easily create one using a powerful yet user-friendly communication diagram tool.
Interaction overview diagram
Interaction overview diagrams combine elements of activity and sequence diagrams to provide a high-level view of system interactions. They use frames to represent activities and interactions, offering a comprehensive perspective on system dynamics and workflows.
Use an interaction overview diagram when a system has multiple distinct interaction scenarios (each represented by a sequence or communication diagram) that need to be connected into a coherent flow. It acts as a map of maps, showing the order and decision logic between detailed interaction diagrams without duplicating their content. It is most helpful for documenting complex workflows with conditional paths across several interaction sequences.
Timing diagram
Timing diagrams visualize the behavior of objects within specific time frames, showing the timing and duration of events and interactions. They’re helpful for understanding the timing constraints and performance aspects of system operations.
Use case diagram
Use case diagrams visualize the interactions between actors (users or systems) and use cases (functional requirements) within a system. They provide a graphical overview of system functionality and help stakeholders understand the relationships and dependencies between different use cases.
You can easily visualize these interactions using a use case diagram tool.
State machine diagram
State machine diagrams model the behavior of objects as they move through states in response to events. They visualize state transitions, actions, and conditions, providing insights into how components behave in different scenarios. Miro’s state diagram tool makes it easy to create a state chart.
Benefits of UML diagrams
There are plenty of advantages to using UML diagrams — from improving a software engineer’s workflow to streamlining cross-team communication. Let’s take a look at all the benefits:
1. Simplifies complex ideas and systems
UML diagrams visually simplify abstract ideas and complex software systems, making collaboration among software engineers easier. They also help non-technical stakeholders understand system functionality.
2. Visualizes complex code
Turning complicated lines of code into visual diagrams makes software development more straightforward. UML diagrams give a clear picture of how code parts relate and work together, saving time and reducing confusion.
3. Keeps developers on the same page
UML is a standard visual language that helps team members across different languages and stages of development communicate better. It acts as a common guide, making sure everyone understands how the system is designed and progressing.
4. Provides a big-picture view
During the software development process, having a UML diagram to refer to helps developers stay focused on the overarching design and project goals. It’s like having a blueprint that helps you figure out your next step in case you get stuck — all while reminding you of the overall goal anytime you find yourself getting lost in the details.
5. Great for non-technical explanations
Apart from helping software engineers, UML diagrams help product owners, managers, and stakeholders understand software processes and functionalities. They bridge the gap between technical and non-technical team members, promoting better teamwork.
6. Improves cross-team collaboration
Not all programmers understand and specialize in the same type of code and programming languages. Using a standard notation, UML diagrams enable programmers with different skills to work together effectively.
When to use a UML diagram
UML diagrams are great for visualizing complex systems in various settings — both for software and in other scenarios. Let's take a look at two common use cases for UML diagrams:
Software development
You already know that UML diagrams are useful for software development, but they’re especially handy for tackling large-scale projects with intricate architectures. For example, when starting a new software project, teams use UML diagrams to sketch out the system's blueprint.
This helps define how different parts of the software will interact and ensures everyone on the team is on the same page from the start.
Business management
When it comes to managing businesses, UML diagrams have become increasingly valuable for streamlining operations and gaining insights. For example, in startups, these diagrams can map out customer journeys, helping to refine products and enhance user experiences.
Similarly, in larger corporations, UML diagrams are used to visualize complex processes like supply chain management or ERP systems, helping to maintain seamless integration and alignment across departments.
Best practices for creating a UML diagram
There are several best practices that’ll help you create clear and effective UML diagrams without having to overcomplicate the process. Here are some tips to keep in mind:
1. Start with a template
Creating a UML diagram from scratch can seem daunting, especially if it’s your first time. Using pre-made diagramming templates can save you time and ensure you aren’t missing any important diagram components.
Templates also give you an excellent starting point that you can build on. Over time, you can adapt the template to suit your specific needs and requirements.
Miro has tons of customizable UML diagramming templates to help you kickstart your visuals:
- UML Diagram Template
- UML Activity Diagram Template
- UML State Machine Diagram Template
- UML Class Diagram Template
- UML Component Diagram Template
- UML Communication Diagram Template
- UML Use Case Diagram Templates
2. Have a clear goal
Having a clear goal can set any project up for success, but given that there are so many different types of UML diagrams, it’s especially important in this case. Knowing what you’re trying to achieve can help you choose the right UML diagram to create, which also sets you up for achieving the best possible results.
3. Get team input
One of the main goals of a UML diagram is to make things easier for teams to understand. But just visualizing the software isn’t always enough to communicate your ideas. It’s also a good idea to share your UML diagrams with your team and get feedback — gives all relevant team members an opportunity to add their input.
Getting feedback early on also helps reduce any chances of misalignment along the way or even having to make major changes down the line. Miro’s UML diagramming tool is built for seamless team collaboration — regardless of whether your team connects in person, remotely, in real time, or async.
Using different UML diagrams
The difference between a UML object diagram and a UML class diagram
A class diagram defines the structure of a system in abstract terms — the classes, their attributes, methods, and relationships. An object diagram shows a concrete example of that structure at a specific moment, with actual named instances and real attribute values. Think of the class diagram as the blueprint and the object diagram as a photograph of the building being constructed according to that blueprint.
When should you use a UML interaction overview diagram?
Use an interaction overview diagram when a system has multiple distinct interaction scenarios (each represented by a sequence or communication diagram) that need to be connected into a coherent flow. It acts as a map of maps, showing the order and decision logic between detailed interaction diagrams without duplicating their content. It is most helpful for documenting complex workflows with conditional paths across several interaction sequences.
Create your UML diagram in Miro
Ready to create a UML diagram? Miro is the perfect place to get started. Between our powerful diagramming tools, time-saving UML templates, and seamless collaboration features, you’ll have everything you need to visualize complex systems and keep your team on the same page.
But don’t just take our word for it. Why not see for yourself?
Sign up for Miro to start creating your UML diagram.
Author: Miro Team
Last update: June 12, 2025