What is a flowchart? A complete guide
Summary
In this guide, you will learn:
- What a flowchart is: a visual diagram explaining processes with standardized symbols.
- The versatility of flowcharts across various fields for simplifying complex processes.
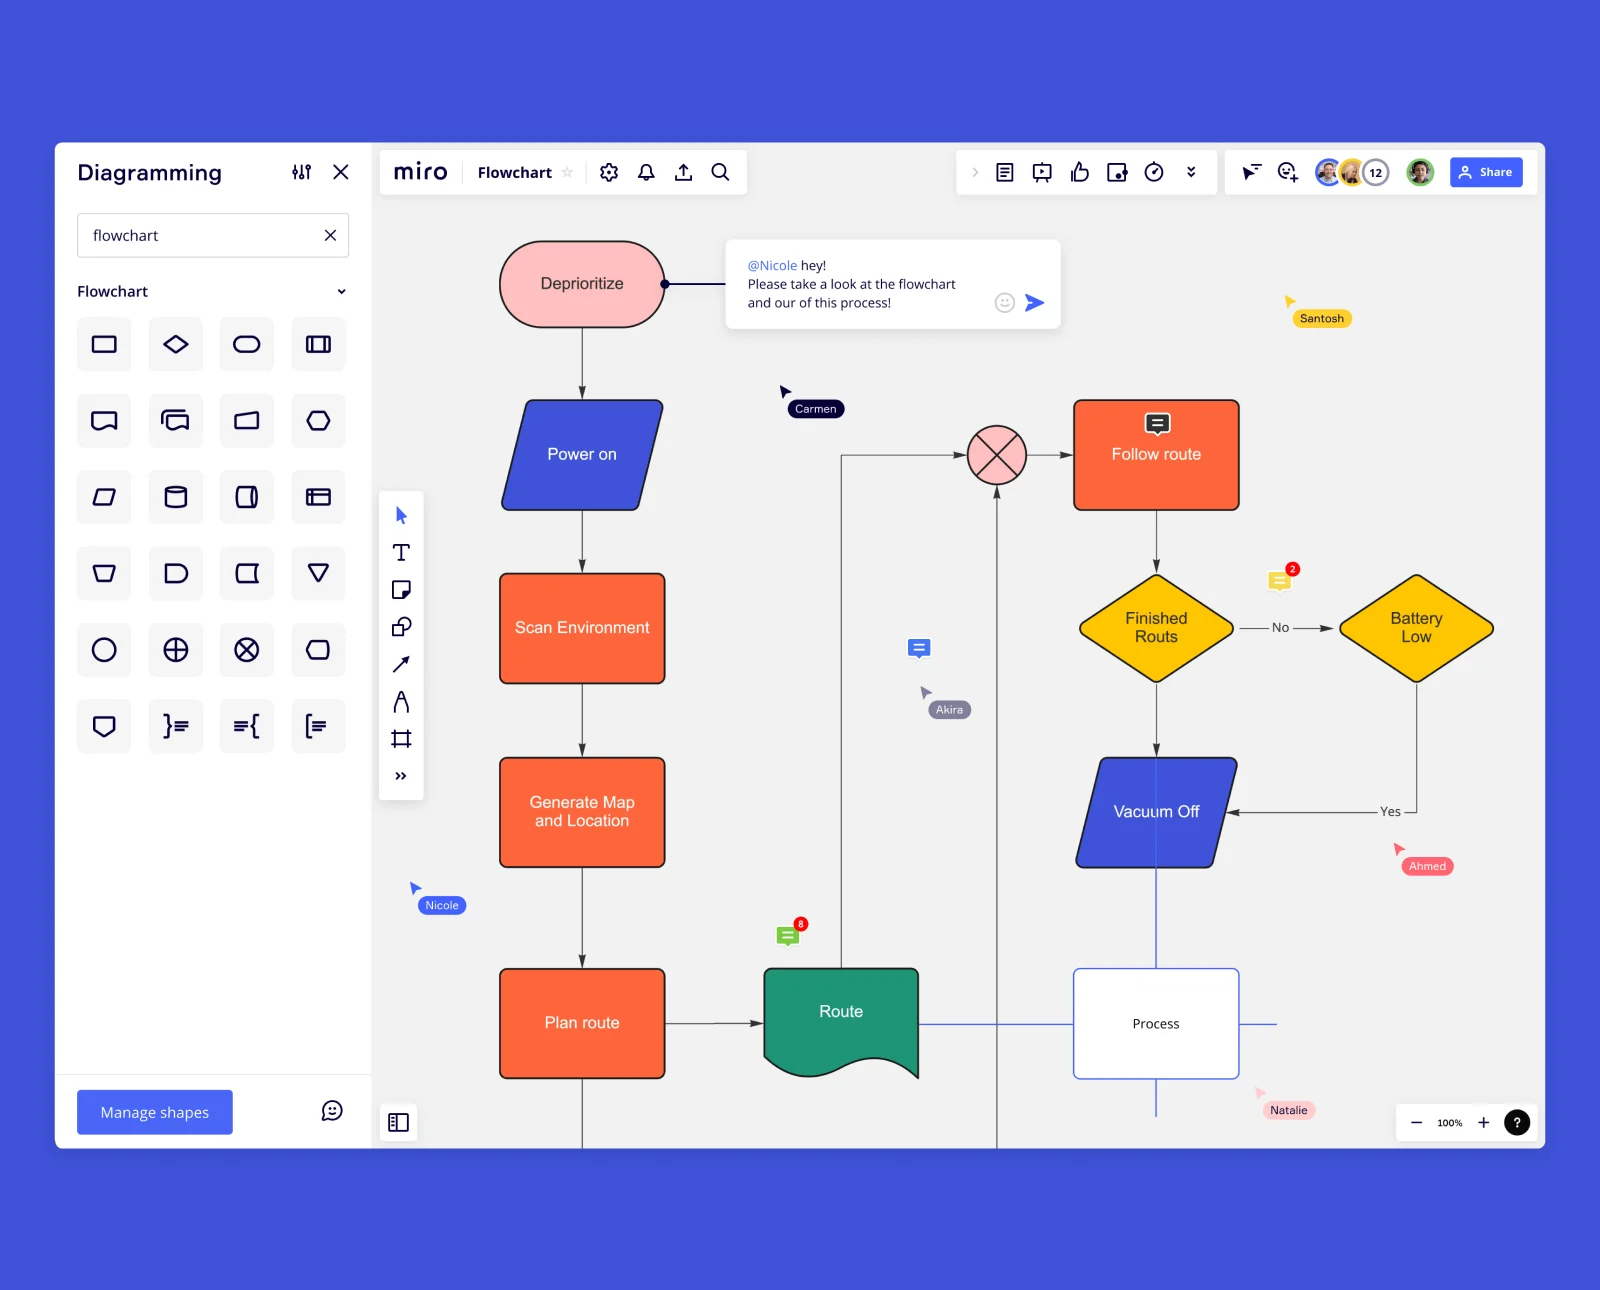
- How to easily create flowcharts with Miro’s drag-and-drop tools.
- Key elements of flowcharts: actions, decision points, inputs, outputs, and their logical organization.
- The benefits of flowcharts: improving clarity, communication, problem-solving, documentation, and training.
- Different types of flowcharts and their applications for optimizing workflows and decision-making.
At Miro, we understand the power of visualizing complex concepts. Flowcharts are the perfect tool to help bring ideas to life. In this article, you’ll learn what a flowchart is, when to use one, and the different types to consider.
Collaborative AI Workflows
Create clear flowcharts quickly with Miro's free drag-and-drop tools.
Flowcharts explained
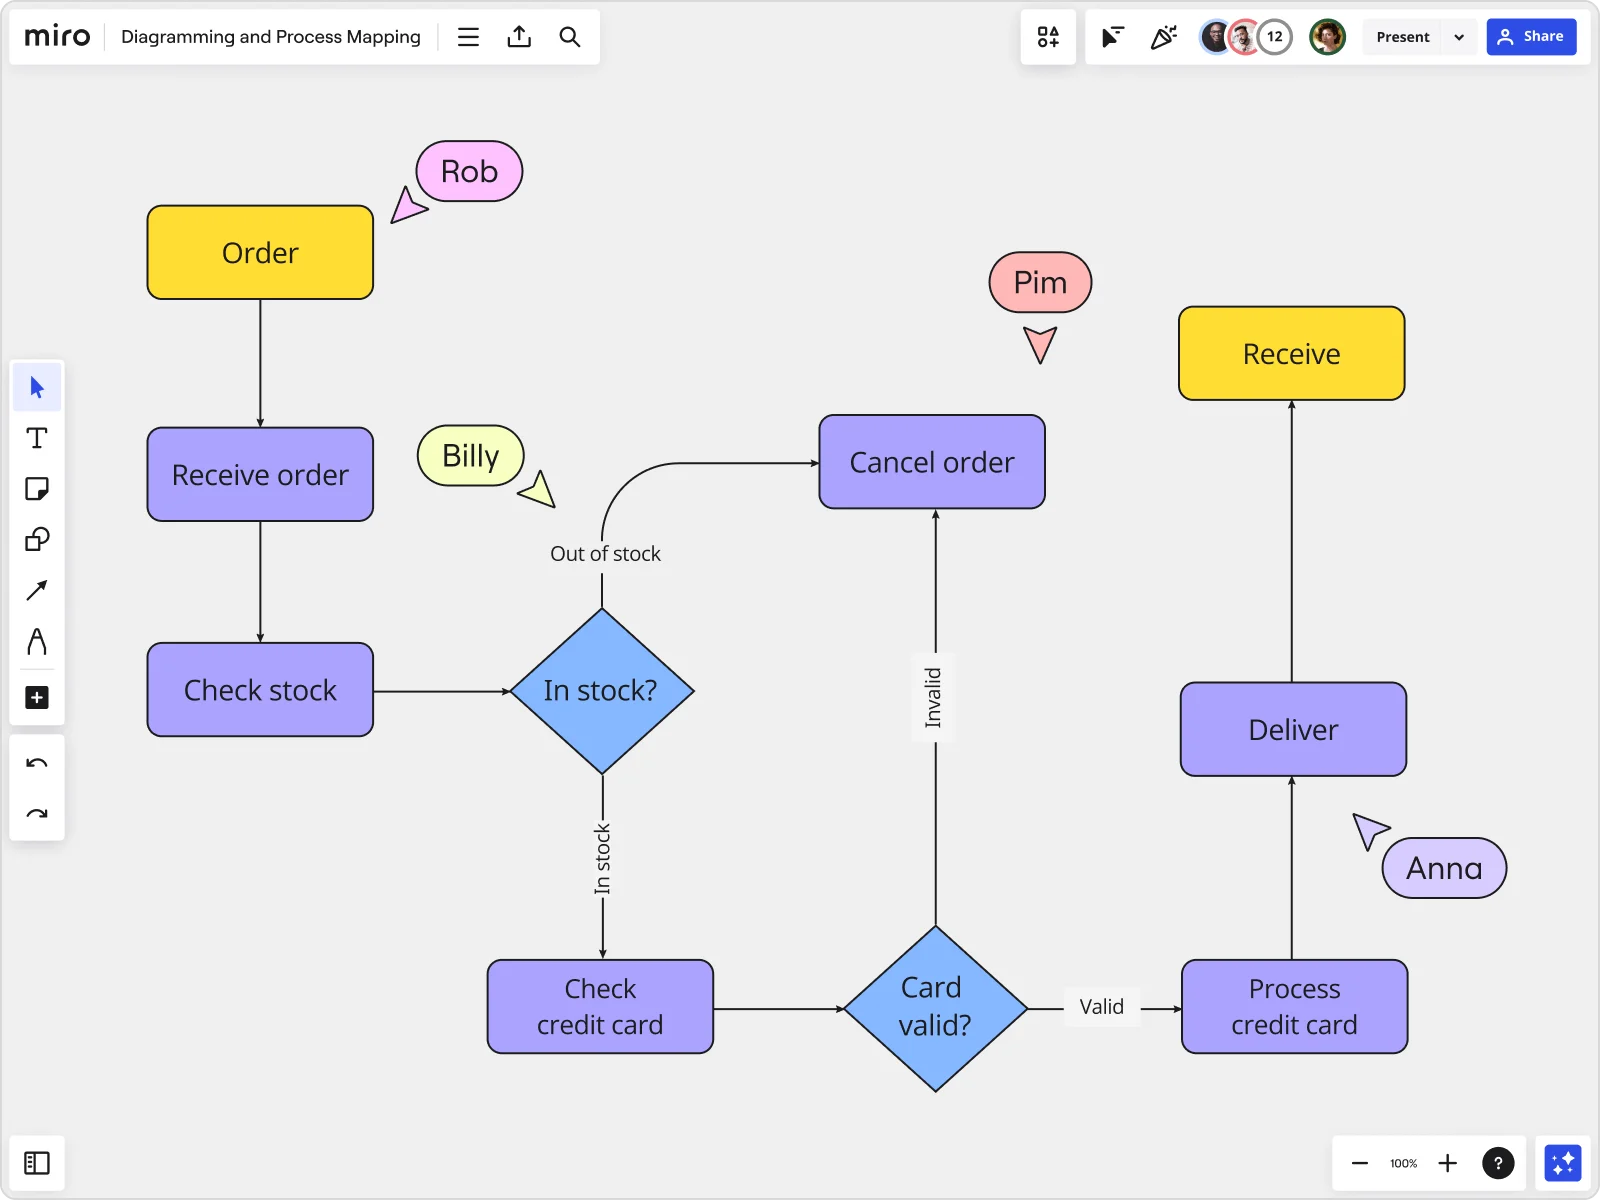
Let's start with the basics: What exactly is a flowchart? A flowchart is a type of diagram that visually explains a process or workflow. By using standardized symbols and definitions, you can create a handy visual representation of any process's various steps and decision points.
Flowcharts have been popular for many years across various fields, from engineering and education to computer programming and project management. They are useful for communicating simple and complex processes and are incredibly dynamic and versatile. By looking at a flowchart, a viewer should be able to get a high-level overview of a process.
Typically, a flowchart is created using various symbols, each representing a different step within a sequence or process. These diagrams usually include a variety of elements, such as actions, materials, services, inputs, and outputs. If you need to make a decision but are unsure of the process and the different elements required to inform that decision, using a flowchart could greatly simplify the process.
Benefits of creating a flowchart
Flowcharts are a great tool for visualizing processes in your personal and professional life. They offer several advantages that can help you and your team. Here are some of the benefits of using a flowchart:
Visual clarity
The main benefit of using flowcharts is that they allow you to understand complex operations in a simple format. Many businesses in manufacturing, logistics, and administration use them to plot out important sequences. Additionally, flowcharts can help stakeholders understand the workflows that your company employs.
Improved communication
Flowcharts are useful for meetings where your team needs to understand and communicate important processes. By simplifying complex operations with flowchart symbols and definitions, you can clearly communicate information that would otherwise be difficult to discuss.
Proper documentation
Using flowcharts to plot out processes within your business is a great way to document what needs to be done. It also helps you understand your company's progress in completing a task. By using digital flowcharts, you can incorporate paperless documentation into your workflow.
When to use a flowchart
Flowcharts are used in a variety of different contexts and industries. It doesn’t really matter what sector you or your business operates in – a flowchart can be used to help understand processes and operations easily.
Here are a few real-life examples where flowcharts can be effectively employed:
When designing and planning a process
Coming up with a new process requires you to document the steps and sequential events of the process. Using a flowchart helps document this process and improves the understanding of the process as a whole.
To study a process for better understanding
Hundreds of flowchart examples online have been used by businesses to complete and understand complex processes. You can study these flowcharts to better understand how your company should be sequencing actions and events to reach an end product or goal.
To communicate a process
In many companies worldwide, sending out detailed flowcharts can completely replace long and time-consuming meetings. Flowcharts are easy to understand and provide a visual document of a process. They are extremely effective communication tools.
In computer programming
In the world of coding, flowcharts play a crucial role. They act as guides that ensure your code journey is clear, logical, and efficient. Whether you're designing algorithms, troubleshooting, or conceptualizing software architecture, a well-crafted flowchart is an invaluable companion.
In learning environments
Flowcharts are an excellent tool for educators to transform complex theories into digestible visual nuggets. From breaking down historical timelines to explaining scientific processes, they simplify the learning experience. Flowcharts aid students in navigating the intricacies of knowledge, making it an interactive guide rather than just a tool.
Streamlining manufacturing
In the meticulous world of manufacturing and engineering, precision is of utmost importance. Flowcharts act as blueprints, outlining the step-by-step journey of a product from conception to realization. They ensure seamless execution and a streamlined production cycle, from assembly lines to quality control processes.
Charting success strategies in Marketing teams
Sales and marketing rely on strategy and planning. Flowcharts are the strategic canvas that delineates sales pipelines, marketing funnels, and decision-making processes. Visualizing these intricate webs of interconnected steps allows teams to align efforts, identify bottlenecks, and chart a course towards success.
Most common types of flowchart
Before jumping into Miro's online flowchart tool, consider these flowchart examples as a point of reference. The following are examples of the versatility and helpfulness of a flowchart.
Website flowchart
Building a website is much more complex and complicated than many think. Building navigational menus, organizing content, and customizing a website’s appearance are a few important steps needed to create an online site that people will want to visit. This website flowchart template provides a robust process diagram to create a great user-centric online experience.

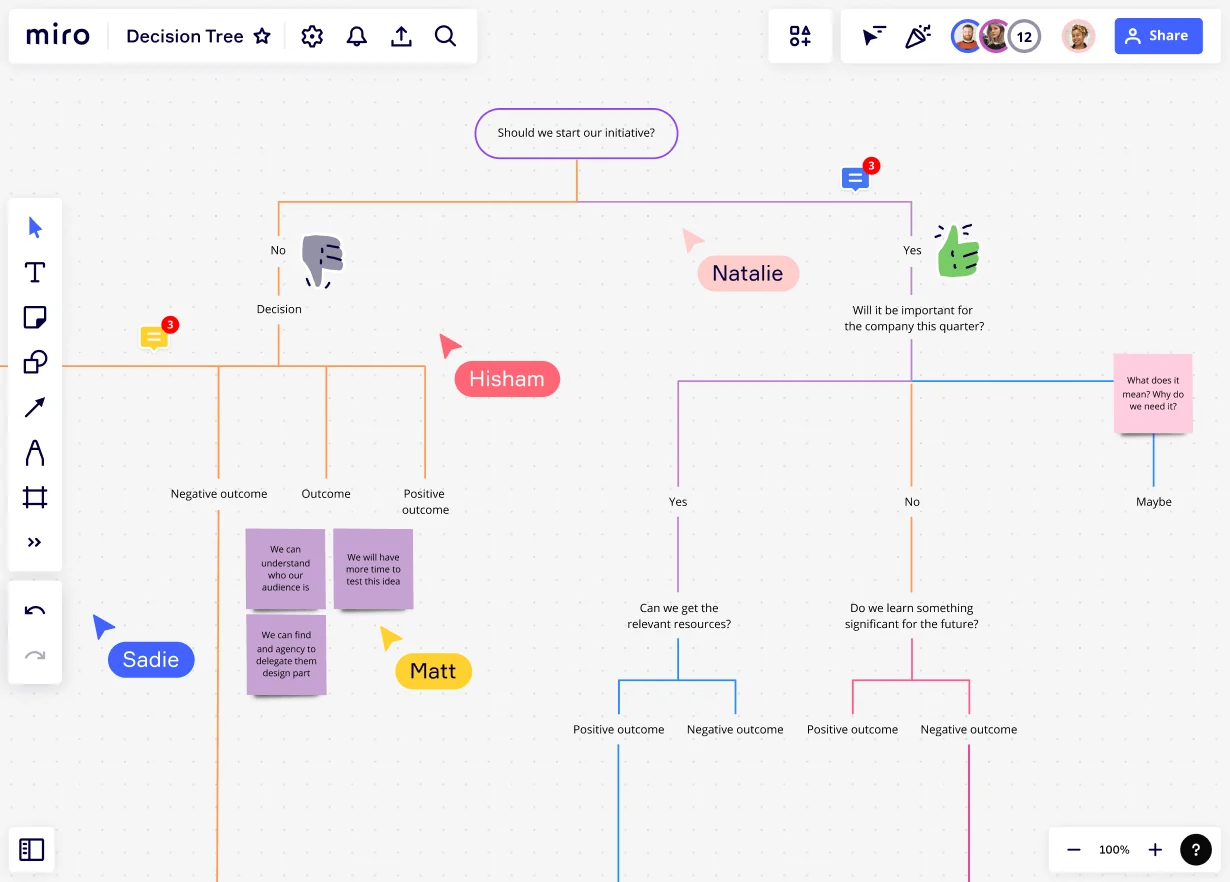
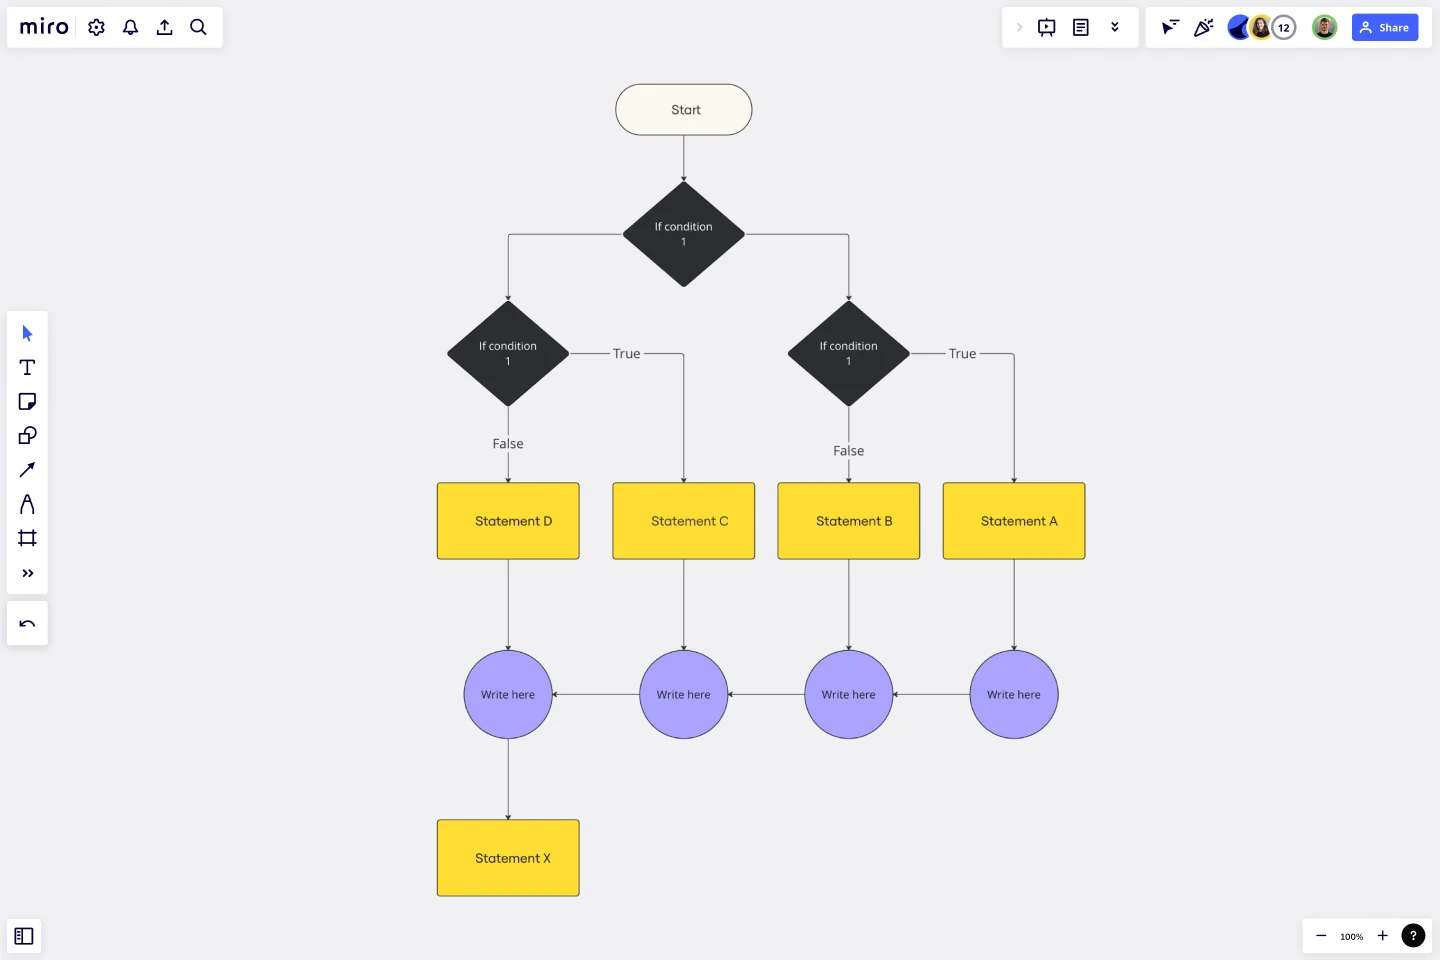
Decision tree
No matter what industry you’re in, there are plenty of different outcomes your business could face based on your decisions. The butterfly effect of your decisions means you need to think about all possible outcomes and the results they could have on your company. This decision tree flowchart template will show you how to map out different decisions and their outcomes so that you can decide on the best possible route.
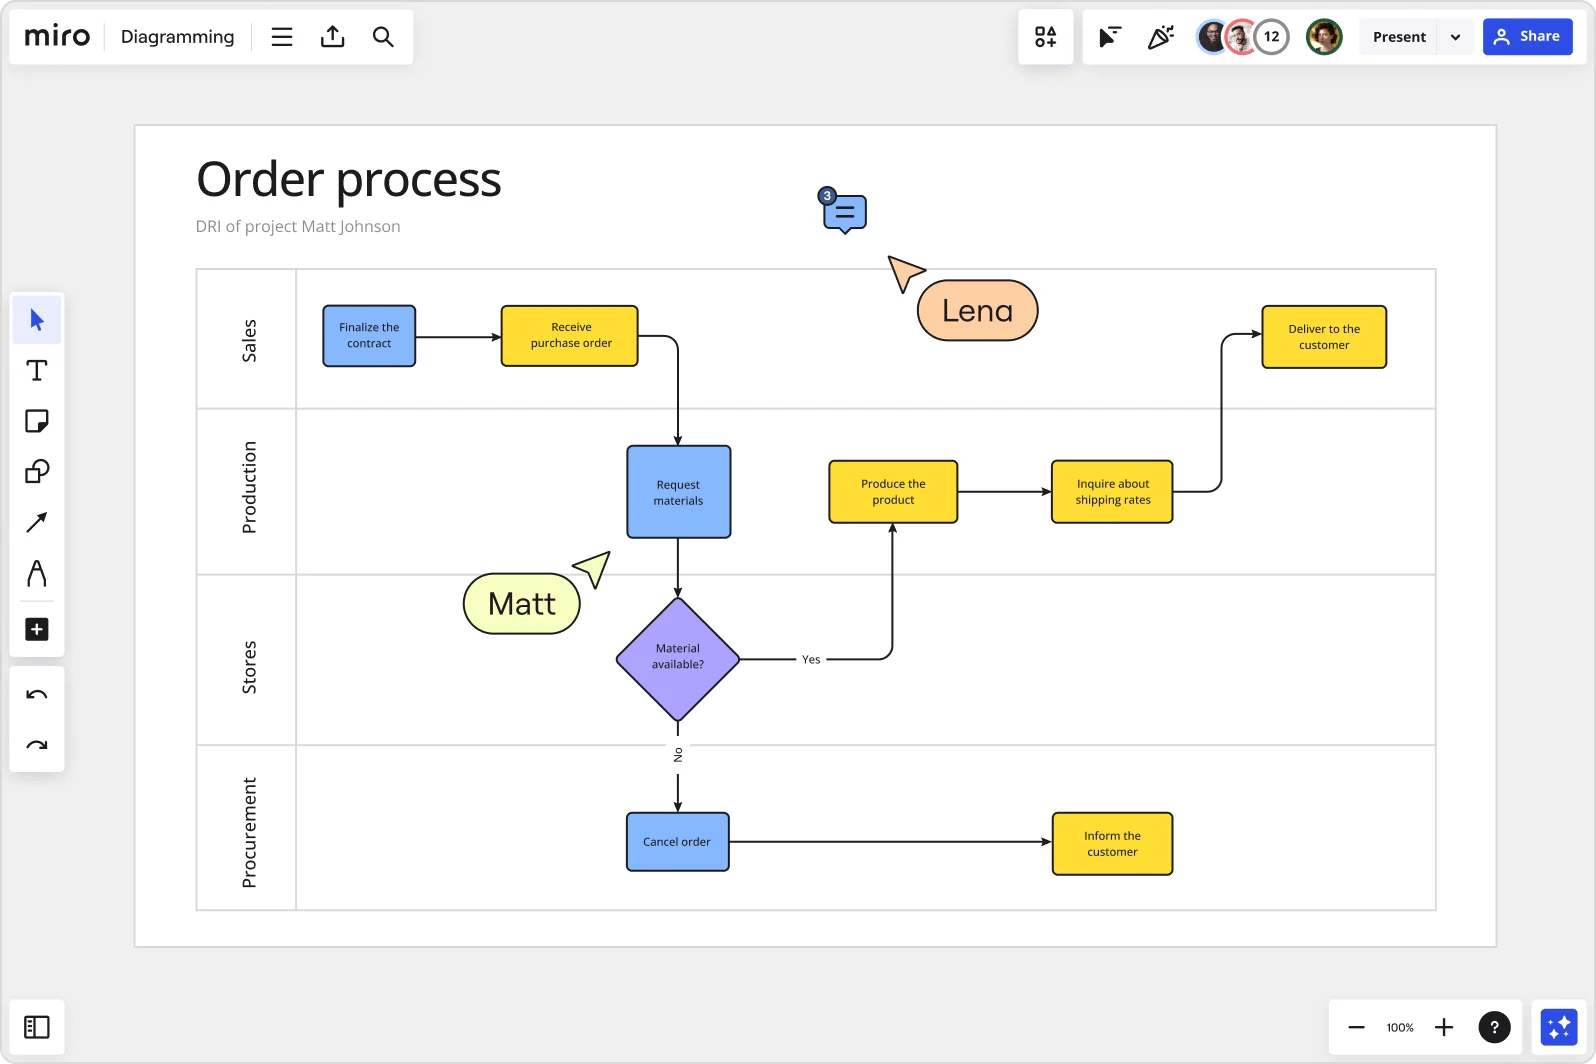
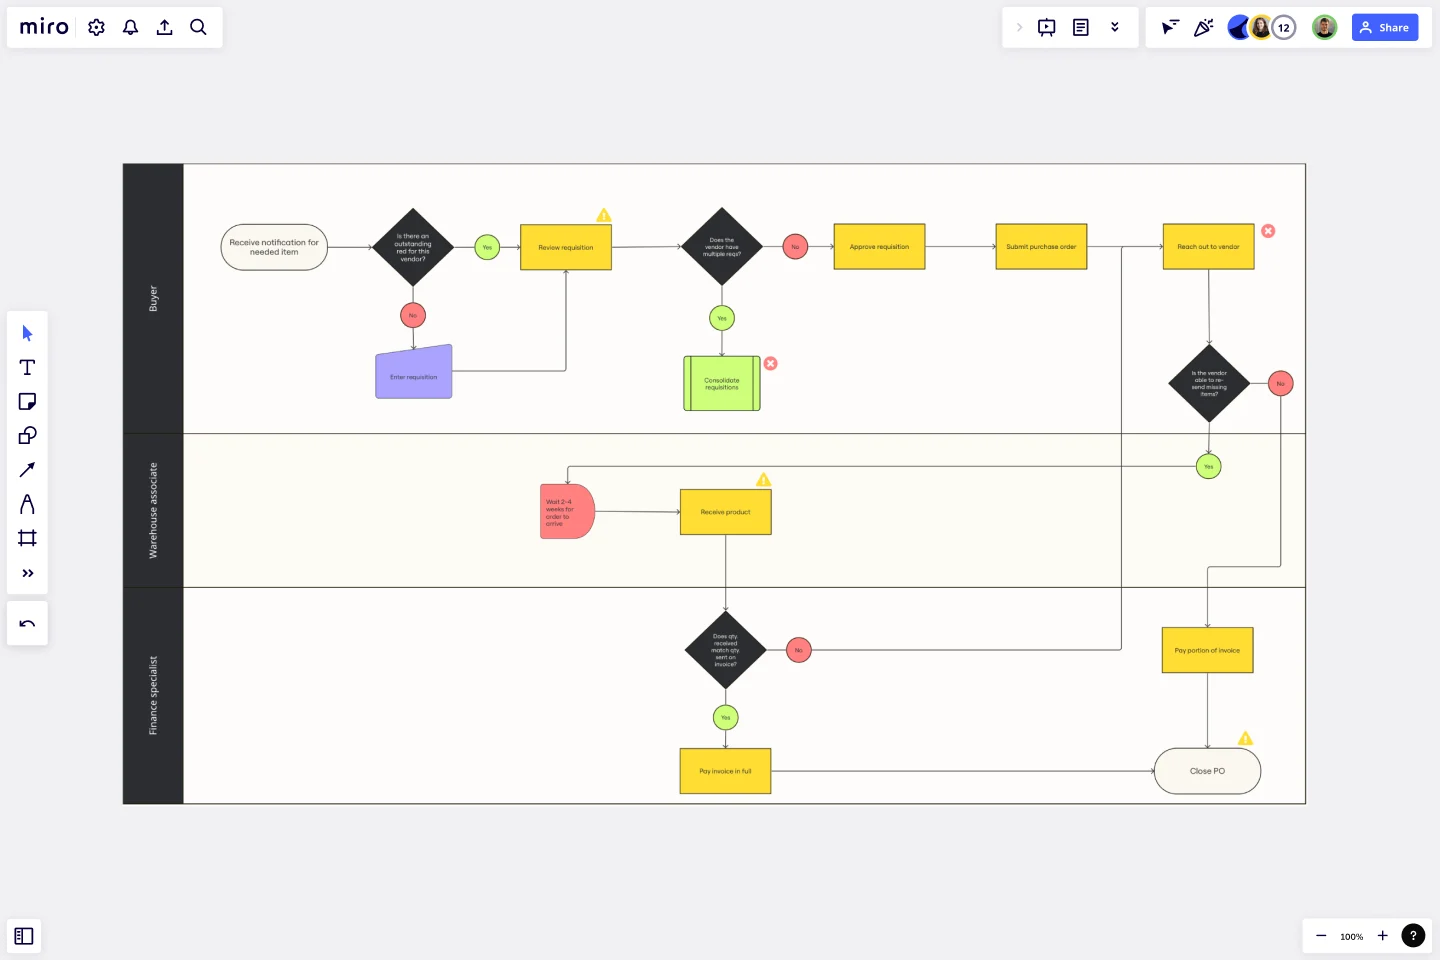
Cross-functional flowchart
Most flowcharts are cross-functional in that they account for different possible outcomes. Swimlane diagrams are especially cross-functional because they help visualize business contributions and end-to-end project relationships. This cross-functional flowchart template will help you understand the elements and relationships between the different phases of a project.

Process flowchart
Optimizing workflows is an ongoing pursuit in any industry. The process flowchart plays a crucial role by detailing each step, decision point, and connection in a visual roadmap, from manufacturing processes to project management workflows. It helps identify bottlenecks, improves efficiency, and ensures seamless operations.
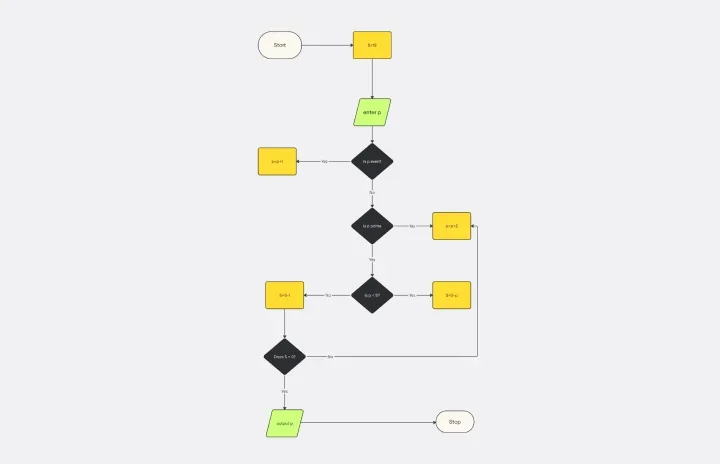
Algorithm flowchart
An algorithm flowchart is a visual representation of the series of actions that form an algorithm. It simplifies complex processes and improves comprehension, illustrating how a specific algorithm works in troubleshooting, optimizing, or communicating processes. You can think of it as a blueprint guiding you through the logical flow of your algorithm, facilitating the transition from problem to solution. Algorithm flowchart templates can be an excellent starting point, offering pre-designed structures to create clear and consistent diagrams efficiently.
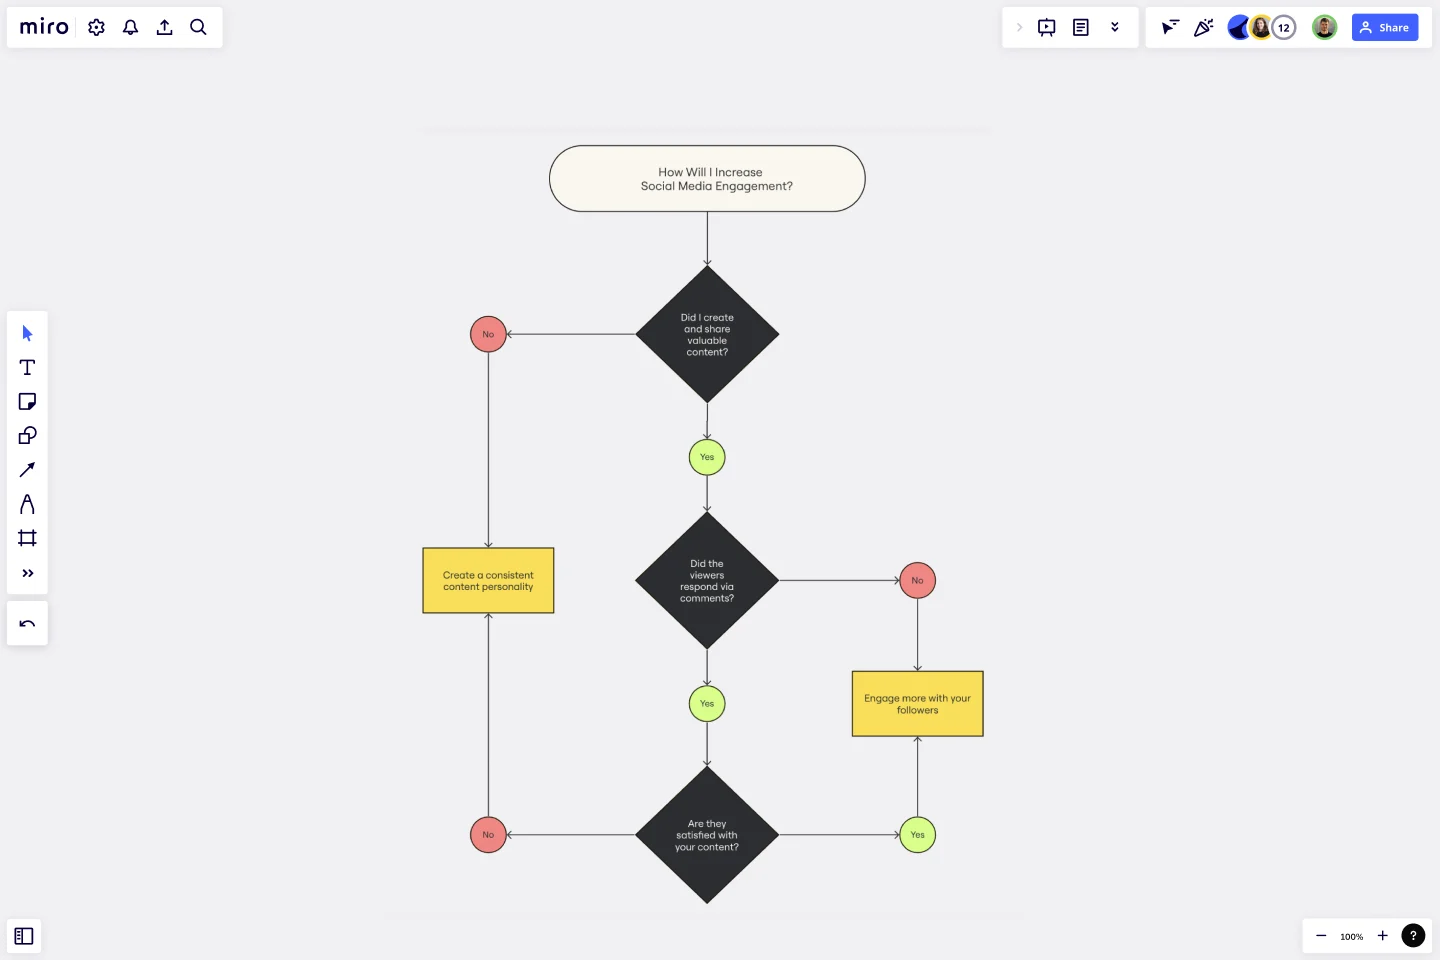
Yes No Flowchart
When making decisions for project planning and execution, using a yes-no flowchart template can help visualize and streamline the process. These flowcharts allow people and teams to easily map out binary decisions and actions using graphical representations.
Product development flowchart
Developing a product can be complex. A clear and organized workflow is crucial. This product development flowchart template acts as a visual roadmap, guiding teams through various stages from ideation to completion. It streamlines and improves the entire product development process, enabling more efficient collaboration.

Design process flowchart

A design process flowchart is a must-have for any creative team. It outlines the steps involved in taking a design from concept to completion. This could involve brainstorming sessions, sketching, creating mockups, gathering feedback, and making revisions. By visualizing the entire process, you can ensure that your team stays on the same page and produces high-quality designs consistently.
Production flowchart
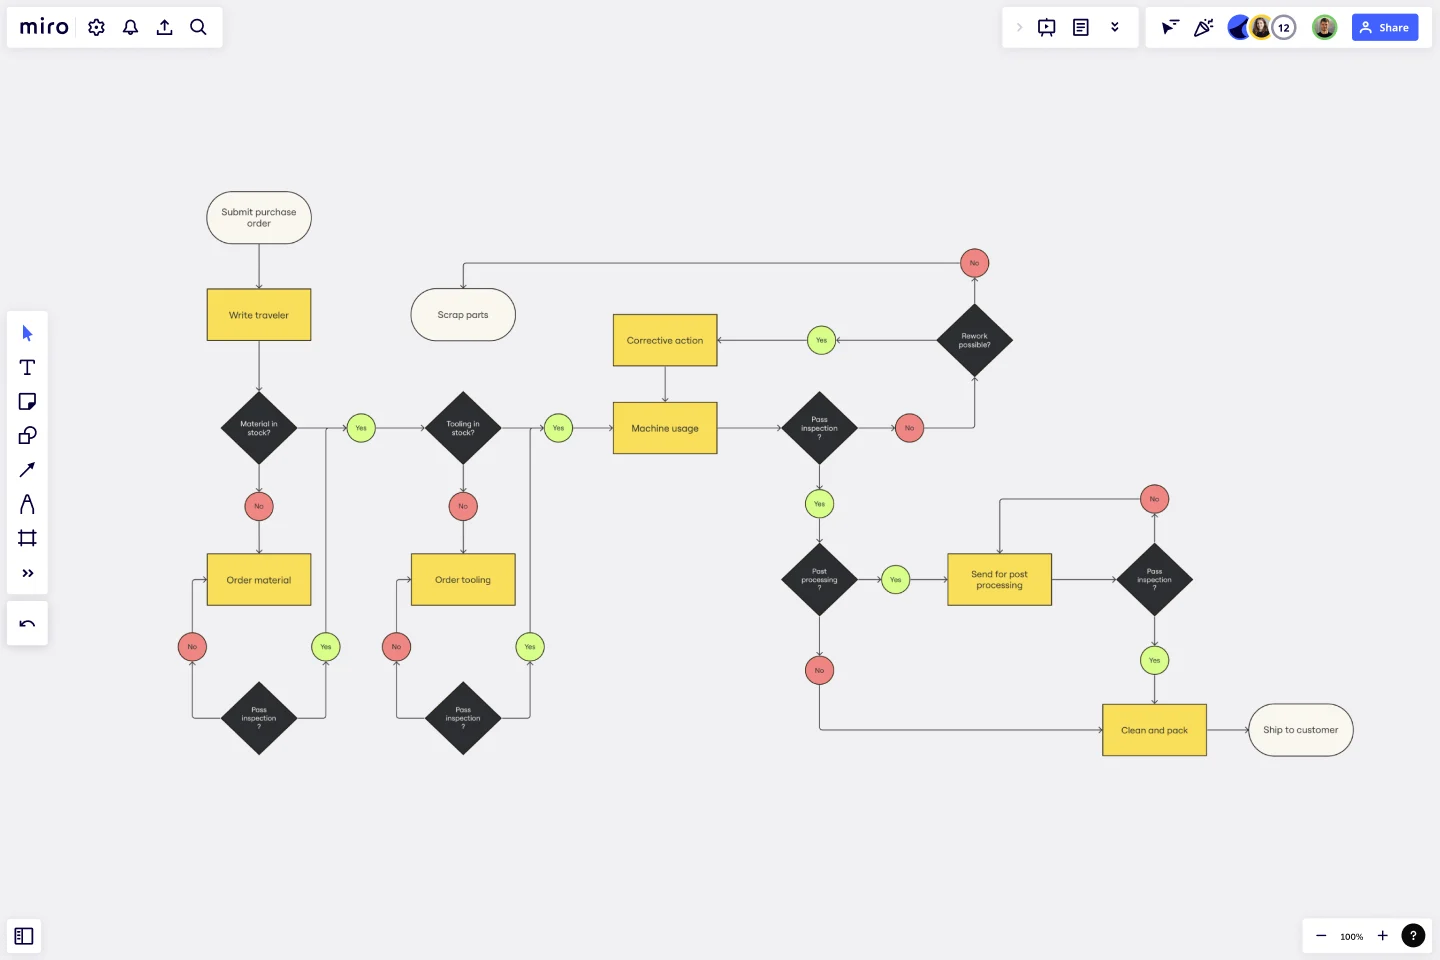
In manufacturing or production environments, efficiency is key. A production flowchart helps you visualize the entire production process, from raw materials to finished products. This type of flowchart can identify potential bottlenecks, optimize resource allocation, and ensure smooth operations. It's an invaluable tool for maintaining quality control and meeting production targets.
If then flowchart
The If Then flowchart is a versatile tool for problem-solving and decision-making. It lays out different scenarios and their corresponding outcomes based on various conditions. For example, if you're developing software and need to decide how to handle different user inputs, an If Then flowchart can help you map out all possible scenarios and determine the appropriate responses.
Troubleshooting flowchart
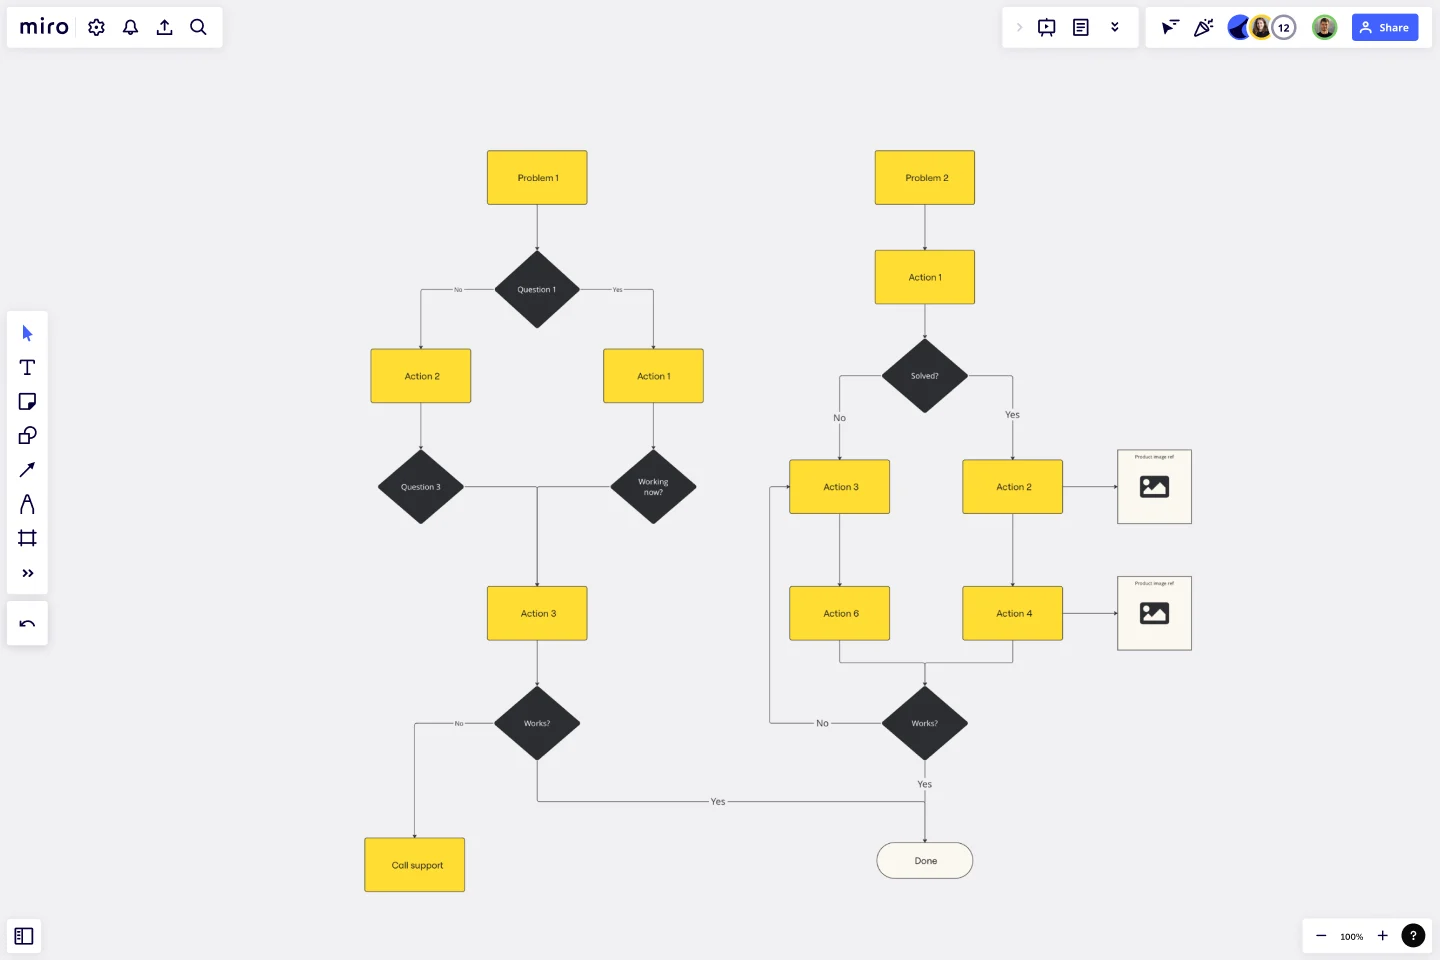
When something goes wrong, a troubleshooting flowchart can be your best friend. It guides you through a logical sequence of steps to diagnose and fix problems. This is particularly useful in technical support and IT environments, where quick resolution of issues is crucial. A troubleshooting flowchart ensures that you cover all bases and don’t miss any critical steps in the problem-solving process.
Current state vs future state flowchart
Planning for change? A current state vs future state flowchart can help you visualize where you are now and where you want to be. This type of flowchart is great for strategic planning and process improvement initiatives. It allows you to compare your existing processes with your desired outcomes and identify the steps needed to bridge the gap.
UI flowchart

User Interface (UI) flowcharts are essential for designing intuitive and user-friendly interfaces. They map out the flow of user interactions within your application, from screen to screen. This helps ensure a seamless user experience and identifies potential usability issues before they become problems. A UI flowchart is a crucial part of the design process for any digital product.
Swimlane flowchart
The swimlane flowchart was aptly given its name as it visually represents a process with no true start or end. Instead, the processes and actions of people who fall into a swimlane diagram are those which go in laps and are completed more than once. Using a Swimlane Diagram Template you can map out a process that needs to be repeated and prevent a sequence from getting messy.

Data flow diagram
Data flow diagrams are used to bridge the communication gap between developers and users of a program or piece of software. This flowchart type is specialized as it contains a substantial amount of information and relatively few flowchart symbols. Miro’s Data Flow Diagram Template makes it simple to visually show the steps or actors of any system, no matter how complex.

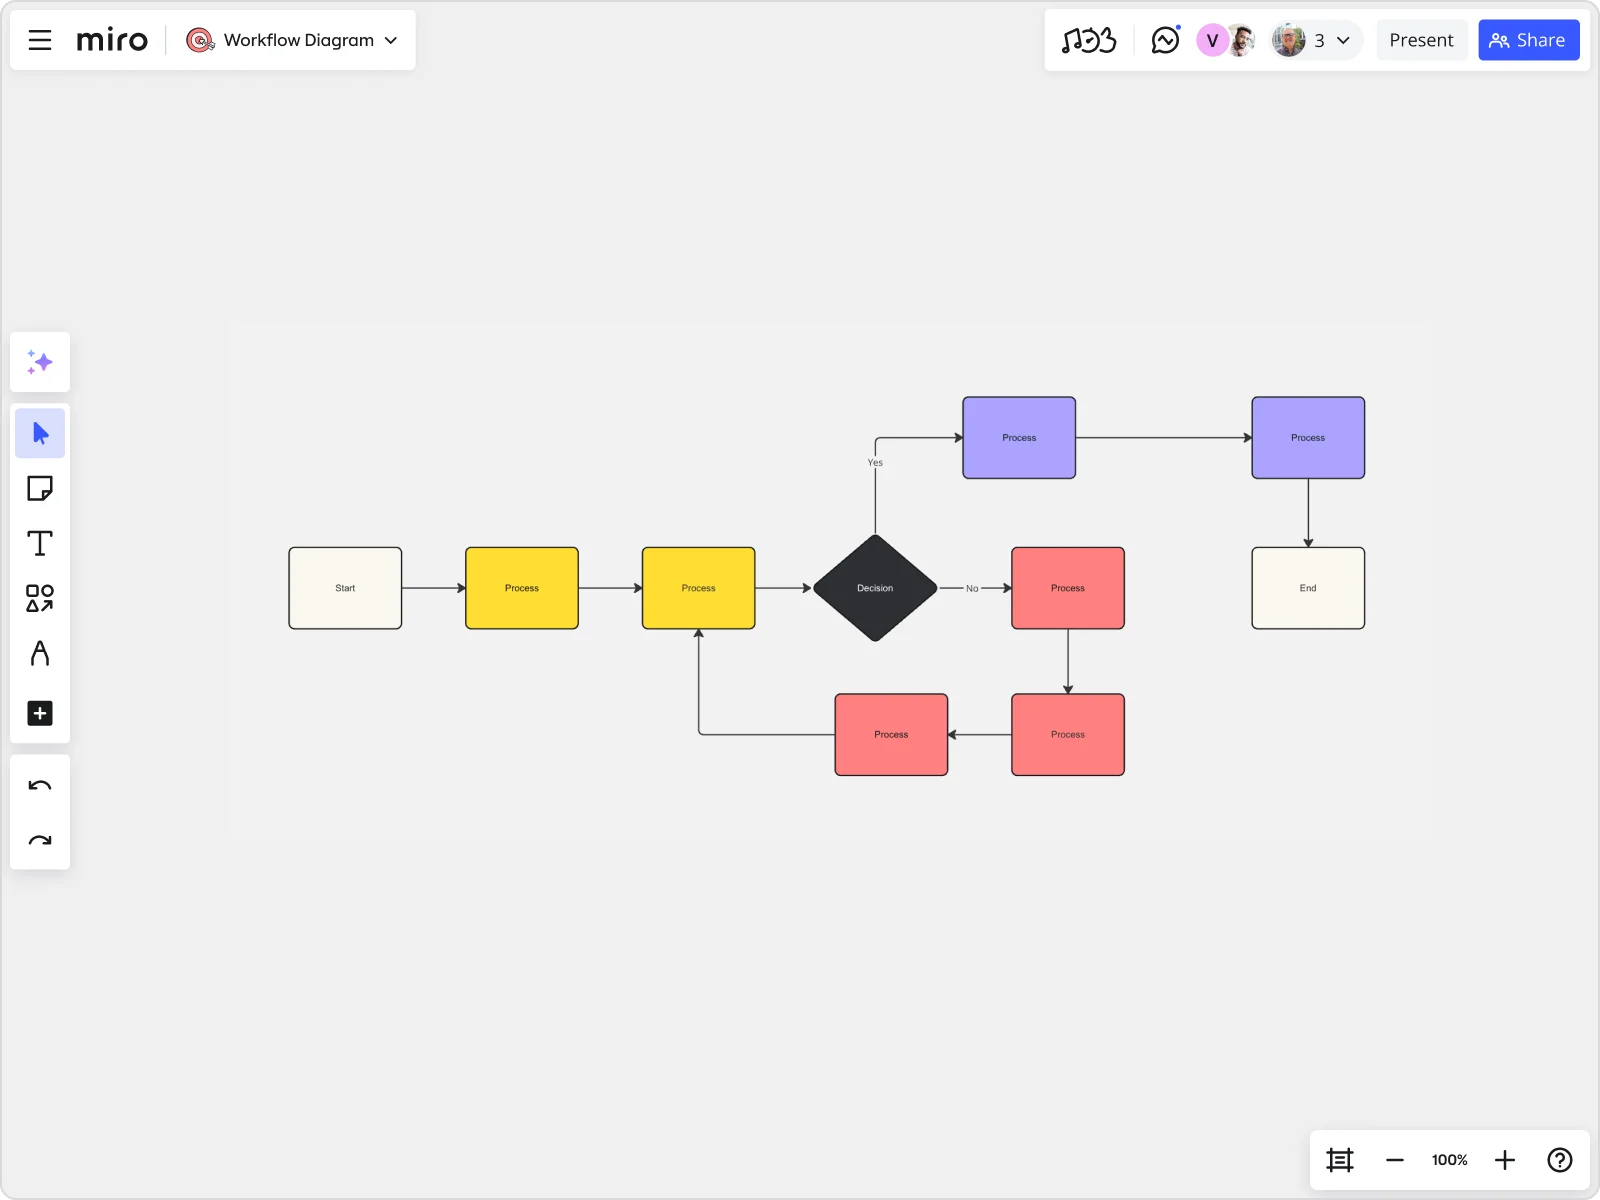
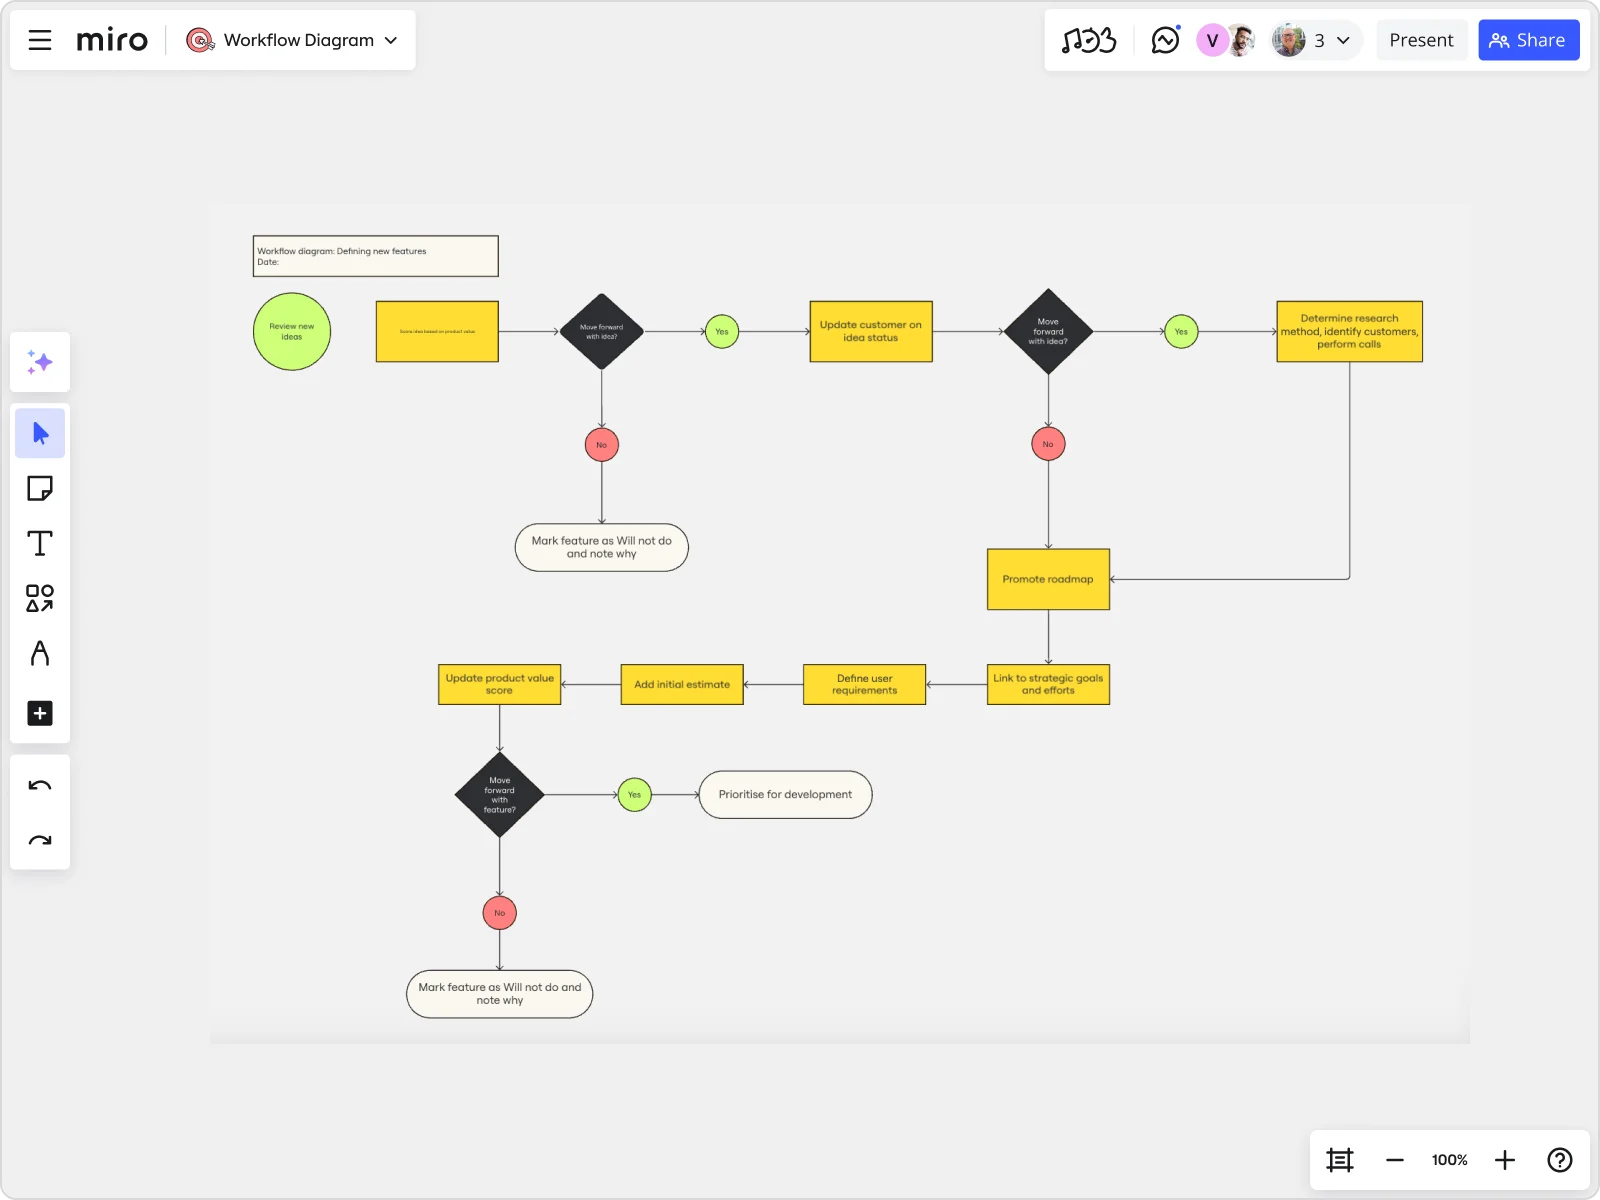
Workflow diagram
When using a workflow diagram, the goal is to map out an effective sequence of events or processes that will result in a consistent and quality output. Workflow diagrams are often used to map out a standardized set of procedures with a determinable outcome.
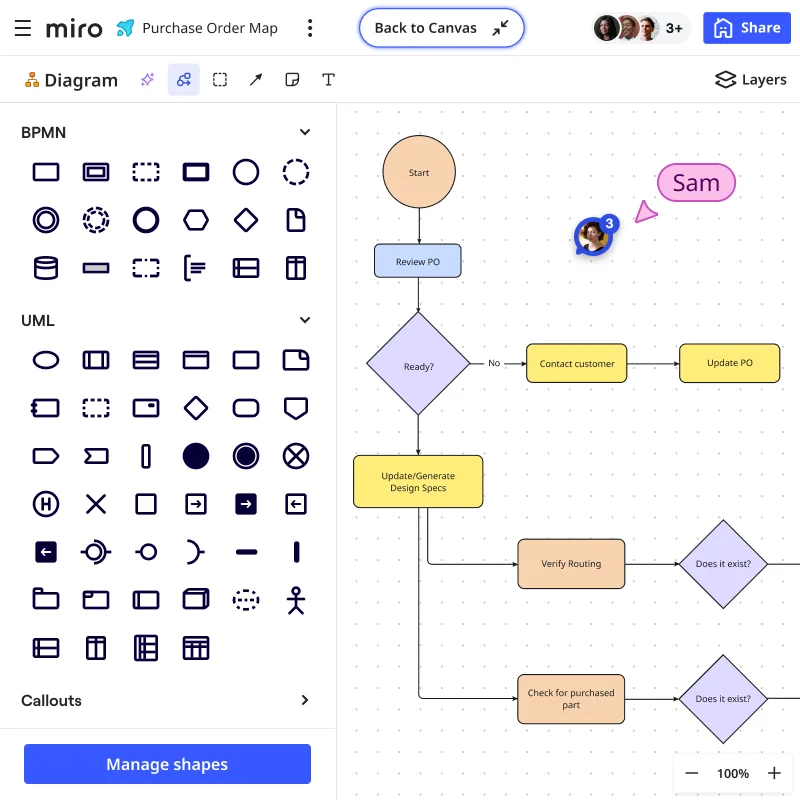
Flowchart symbols
Standard shapes and symbols are used in most flowchart drafting. Each symbol represents a different element or steps within a sequence or process. Use the following flowchart shapes to draft an effective process.
Oval
An oval in a flowchart represents the terminal. This indicates the starts and stops within a sequence.
Parallelogram
The parallelogram indicates an input or output.
Rectangle
Rectangles indicate actions.
Diamonds
Diamonds indicate decisions that need to be made. These usually result in two alternative pathways based on the decision taken.
Flow lines
Flow lines and arrows represent the directions taken in the sequence.
How to create a flowchart
Now that you understand where and when to use flowcharts and why they are important visual tools, it’s time to learn how to make one. Miro's flowchart maker is a fantastic tool for building and planning comprehensive flowcharts with your team. Using the tool, follow this step-by-step guide:
1. Know the purpose of your flowchart
Before you start creating your flowchart, you need to understand why you’re making a flowchart in the first place. Write down the goals and results you want your flowchart to depict and identify the processes you want the diagram to explain. Be mindful of trying to achieve too many goals in one flowchart. It’s best to keep your flowchart as simple as possible to make it easily comprehensible. If you find yourself trying to achieve too much in one diagram, consider making more than one flowchart for each process or group of information.
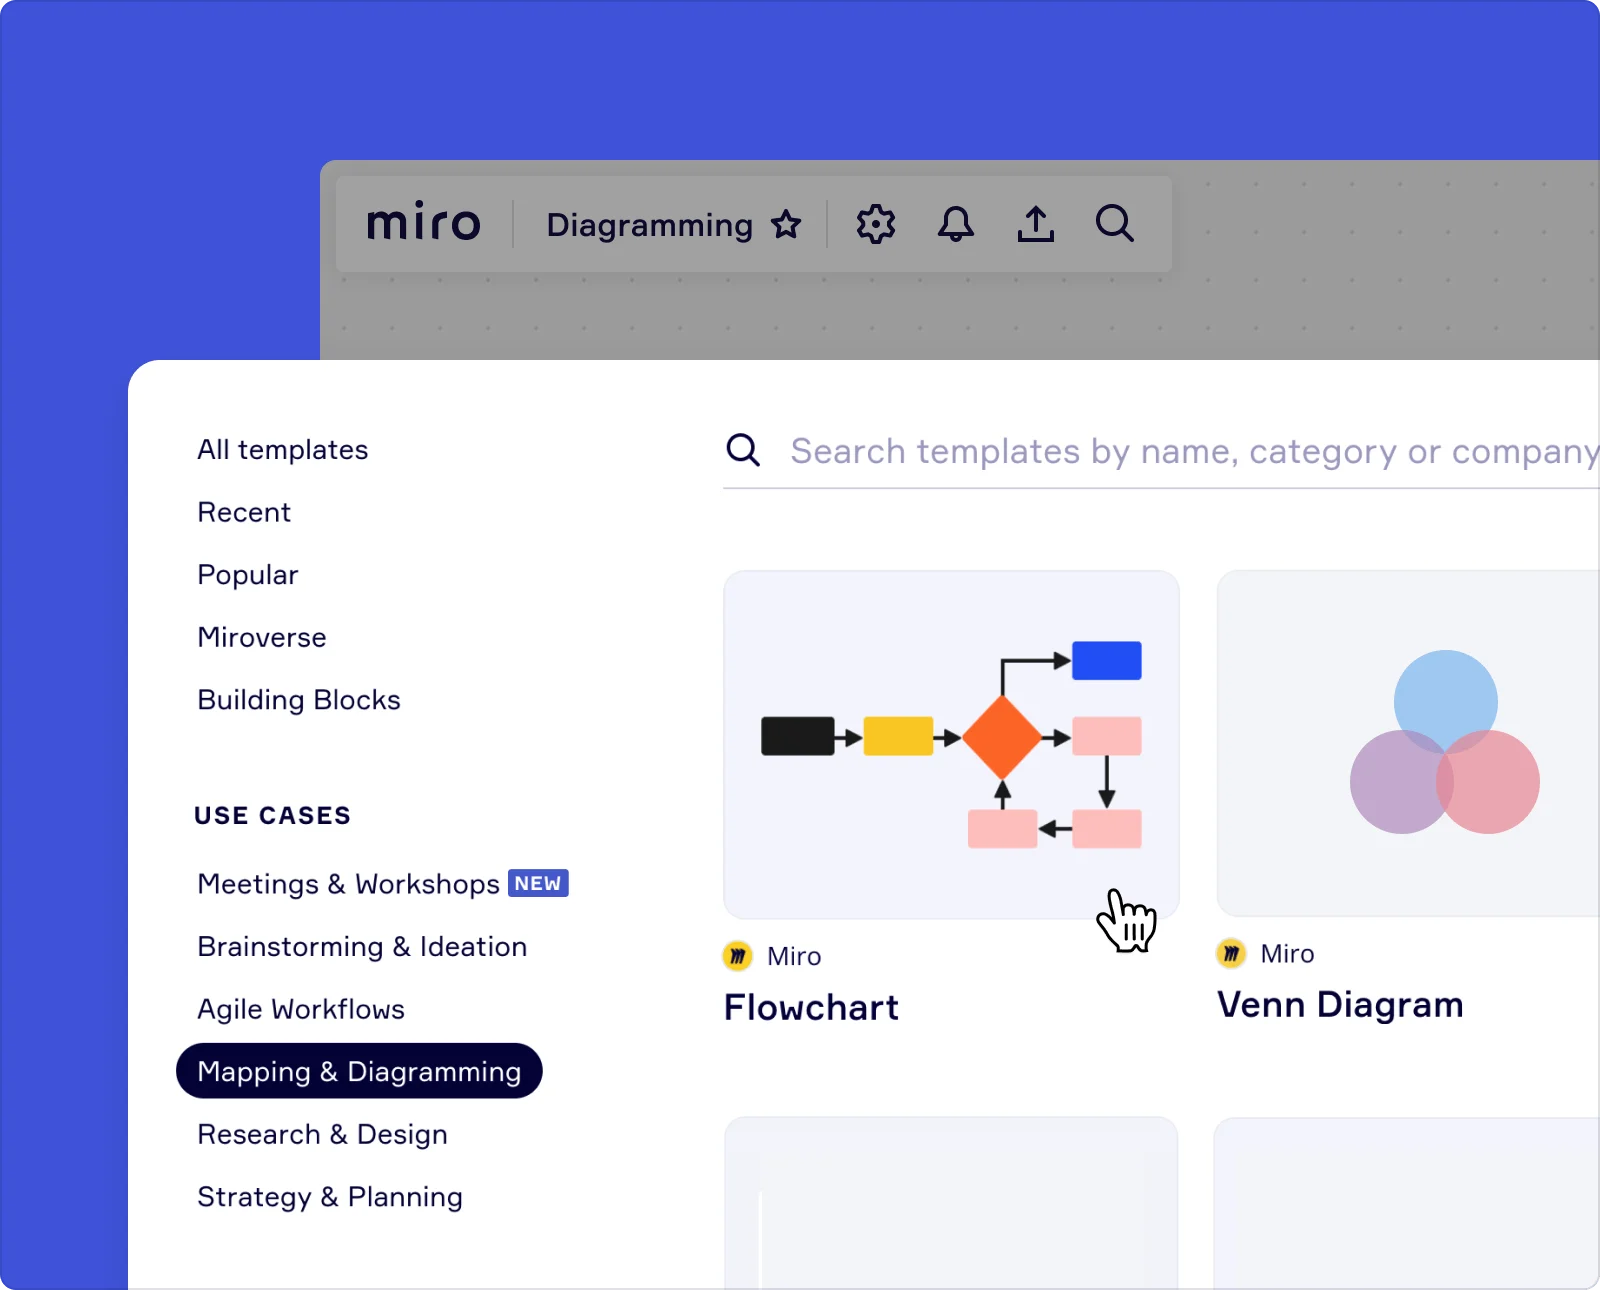
2. Use a flowchart template
Using a basic flowchart template can help you understand how to plot your processes and give you a strong starting point before you start adding your symbols. Starting with a template saves you time and comes with standardized flowchart symbols.
If you need something more complex, Miro has a large collection of flowchart templates you and your team can use.
3. Add flowchart shapes
Take another look at the flowchart symbols and shapes discussed above and start building your visual process. Identify the different components within your sequence and add the appropriate shapes to create a good workflow.
4. Connect shapes with lines and arrows
The next step is adding the connecting lines and arrows to sequence the chosen events and symbols.
5. Collaborate on your flowchart
If your flowchart depicts a process that affects others, share your flowchart with the relevant people. Inviting your team to collaborate with you on your flowchart ensures everyone is on the same page. With Miro, team members can provide feedback and make suggestions with comments and sticky notes, all within one virtual space. This contextual collaboration is what will help your team finalize a useful, clear flowchart that’s helpful for everyone.
6. Keep your flowchart up to date
Systems and processes are constantly changing, so the flowcharts depicting these processes also need to change. Keep your flowchart up to date by regularly revisiting your flowchart and making the necessary changes. Having an online flowchart in Miro makes it easy to make updates and improvements to your flowchart and track these changes.
Tips to consider when creating a flowchart
You’re well on your way to starting your flowchart drafting journey. All that’s left is to go through a few tips and best practices for building the perfect flowchart.
Keep your flowchart on one page
An important characteristic of flowcharts is that they need to be easily readable and understandable. You don’t want to flip through pages to see the entire process. Keeping it to one page keeps it simple and streamlines the visualization.
Use consistent symbols, shapes, and colors
Staying consistent with the symbols and shapes used in your flowchart will help keep the entire process aligned and easy to understand. Each symbol needs to represent a different element within the process. If you use a variety of different symbols, it will be difficult to read and understand the progress of the process. Consistency is key when creating an understandable visual process.
Know the purpose of your flowchart before creating it
As explained above, this is an essential step in creating your flowchart. Flowcharts are best used to represent a specific process. This helps keep the diagram focused.
Flow data from left to right
Flowcharts should flow in the same direction that we read and write. This will help keep the flowchart structure simple and easy to understand.
Use AI to jumpstart your flowchart creation
Skip the blank canvas and accelerate your workflow with Miro's AI flowchart online generator. Simply describe your process in plain language, and AI will instantly create a structured flowchart with proper symbols and logical flow. You can then refine and customize the diagram to match your exact needs, saving valuable time during the initial creation phase.
Get everyone involved
It’s more than likely that the flowchart you’ve created is going to impact other people on your team, especially if it’s a business process flowchart. Rather than creating several flowcharts for the same system, involve the people on your team who are a part of the process. With Miro, you can easily share your flowchart with collaborators anywhere via Slack, email, or private link.
Make relevant changes as needed
It’s no good having a flowchart that’s out of date and inaccurate. In fact, this could cause confusion and inaccuracies, which could, in turn, cause some serious problems for your team. As your system or process changes, ensure you keep your flowchart up to date with the latest steps and information. If your team is using your flowchart documentation on a regular basis, then it’ll be easier to keep it current. Alternatively, schedule meetings during which you can reassess all your team’s flowcharts and make the necessary changes.
Author: Miro Team
Last update: October 10, 2025