Table of contents
Table of contents
Mastering the sales process flowchart
Summary
In this guide, you will learn:
- What a sales process flowchart is
- Key components for an effective sales process flowchart
- How to plan and gather info for mapping your sales process (e.g., SIPOC)
- Step-by-step drafting instructions for a sequential sales flowchart
- Common mistakes to avoid when creating sales process flowcharts
- Benefits of using Miro for collaborative sales process mapping
Collaborative AI Workflows
Join thousands of teams using Miro to build the right thing, faster.
If you’ve ever felt like your sales process could use more clarity or wished you had a bird’s-eye view of each stage, a sales process flowchart might be what you need. It’s a powerful tool that helps sales teams visualize every step of the journey, so no opportunities slip through the cracks. And the best part? You don’t have to be a diagramming expert to create one that works for you.
This article will walk you through everything you need to know about sales process flowcharts. By the end, you'll not only understand how to create one but also know how to use it to improve efficiency and collaboration. Let’s dive in.
Unlocking the power of visual sales strategy with flowcharts
Imagine your sales process as a map that guides every step from prospect to loyal customer. Just like a map helps you navigate unknown terrain, a sales process flowchart does the same for your sales team. It ensures that no opportunity is missed, increasing the chances of converting a lead into a customer.
What is a sales process flowchart?
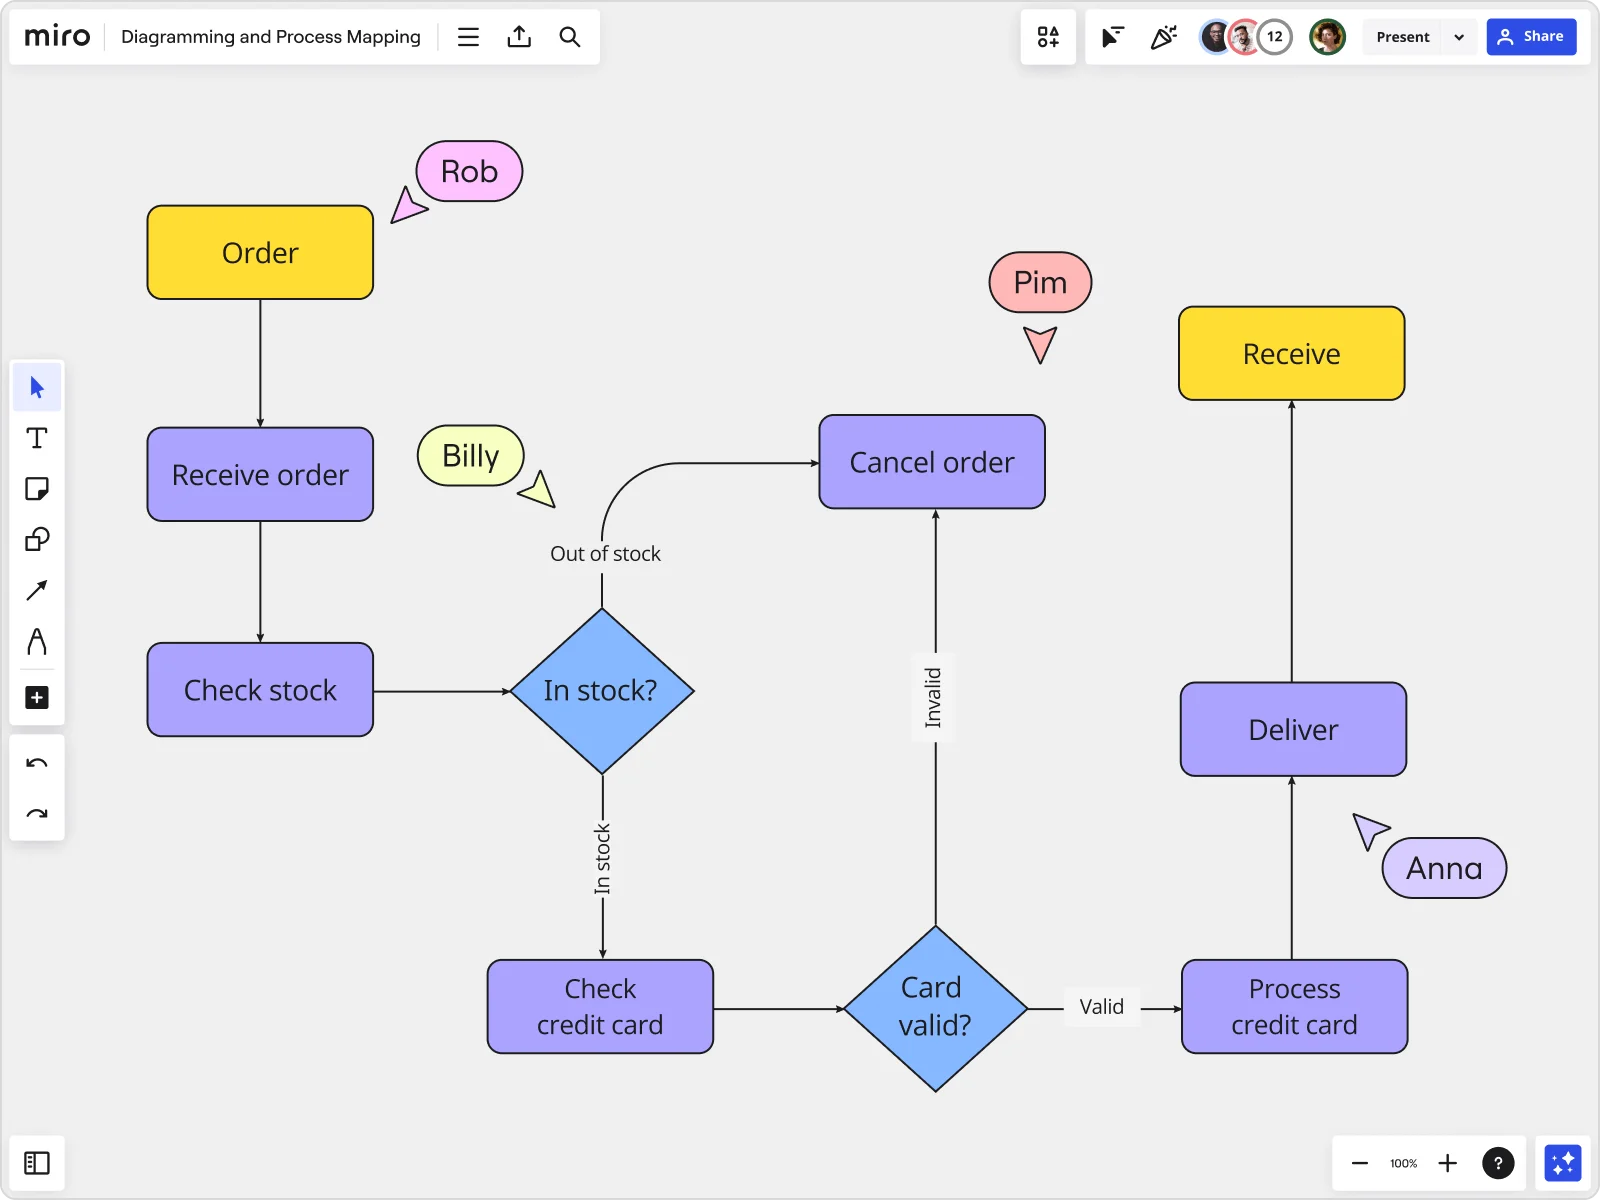
A sales process flowchart is a visual representation of the steps your sales team takes to convert prospects into customers. It's more than just a diagram; it's a strategic tool that helps clarify roles, align activities, and identify potential bottlenecks before they become roadblocks. Using symbols and arrows, this flowchart maps out each action in a sequence, making complex processes easier to understand and follow.
Key components of an effective sales process flowchart
Creating an effective flowchart involves understanding and defining every part of your sales process. Here's what to include and how to visualize each component:
Lead Generation: Start your flowchart by mapping out all the sources of your leads, such as social media, referrals, or direct marketing. Use a distinct symbol for each source, connecting them to the next step with arrows to show flow direction.
Lead Qualification: After generating leads, include decision points to evaluate their potential. Use diamond-shaped decision symbols to represent these criteria checks, leading to different branches based on the outcome (e.g., qualified or not qualified).
Initial Contact: For each qualified lead, detail the preferred contact method (call, email, in-person). Use a rectangular process symbol for each action, illustrating the sequence and scripting that might be involved.
Needs Assessment: Specify steps for understanding client needs using a series of process boxes linked together, showing how to gather and record this information effectively.
Proposal Delivery: Indicate the preparation and delivery of tailored proposals. Use document symbols to represent proposal generation, linking to the next steps for feedback or revisions.
Negotiation: Map negotiation stages with multiple decision points and corresponding strategies to handle various objections, depicted through interconnected decision symbols.
Closure: Use a predefined symbol to denote the final agreement, leading to the successful closure of the deal.
Follow-up and Retention: Conclude with steps for post-sale engagement, such as follow-up calls and loyalty programs, represented by cyclic arrows to indicate ongoing processes.
How to plan your sales process
Before you start diagramming, it’s crucial to plan out your sales process in detail. Skipping this step is like building a house without a blueprint — it might hold up for a while, but eventually, things will start to fall apart.
Here’s how to set a solid foundation for your sales process flowchart:
1. Define your stages clearly: What stages does your sales process include? For example, a B2B sales team might have a six-step process that starts with lead generation and ends with a signed contract. Write down each stage clearly before you move on to drawing.
2. Identify key decision points: Where do your prospects make decisions? This could be at the demo stage, during proposal review, or when signing the contract. Make sure your flowchart accounts for the fact that not all decisions are linear — prospects can say yes, no, or ask for more time or information.
3. Document your team’s roles: Who’s responsible for what? Mapping out your team’s responsibilities ensures that tasks don’t get dropped. For example, the sales rep might be responsible for lead qualification, while an account executive handles proposal creation.
4. Use real data to refine your process: Don’t rely on gut instinct alone. Review past sales to see where things went well and where they fell apart. This information will help you refine your flowchart to reflect reality.
Now that you’ve got a solid plan, it’s time to start crafting your sales process diagram.
Crafting your own sales flowchart: A detailed step-by-step guide
Creating a detailed and effective sales process flowchart is a systematic approach that involves using specific frameworks to ensure each step is thoroughly planned and implemented:
1. Define objectives
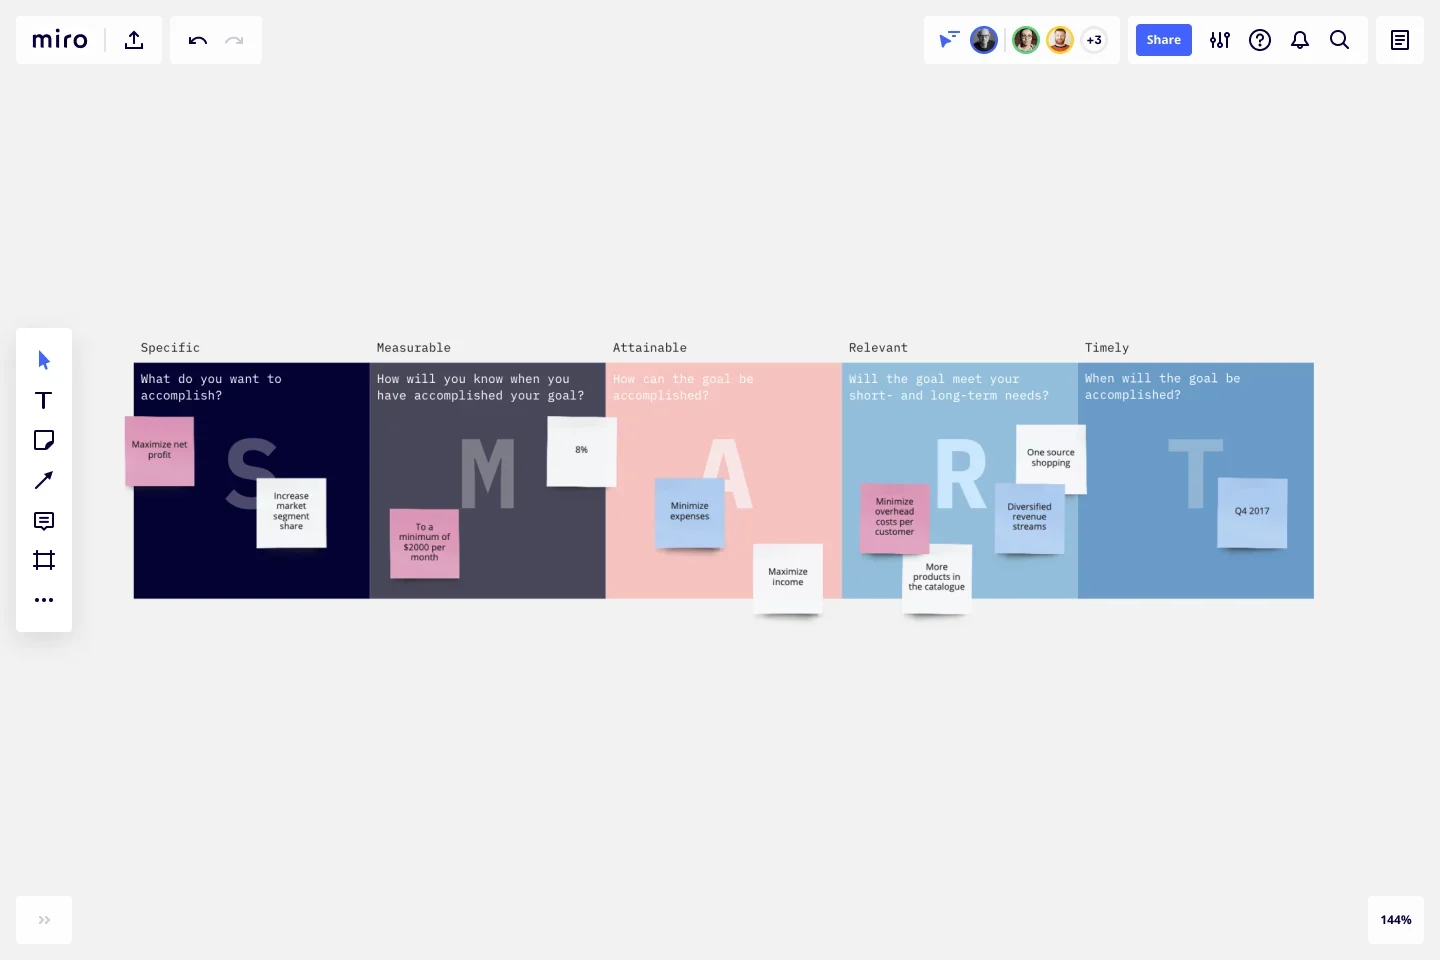
Framework: SMART Goals (Specific, Measurable, Achievable, Relevant, Time-bound)
How: Start by setting clear, SMART objectives for what the flowchart will accomplish. Use Miro for brainstorming sessions with stakeholders to discuss and visualize these goals, ensuring that every objective is precise and aligned with the overall business strategy.
2. Gather information
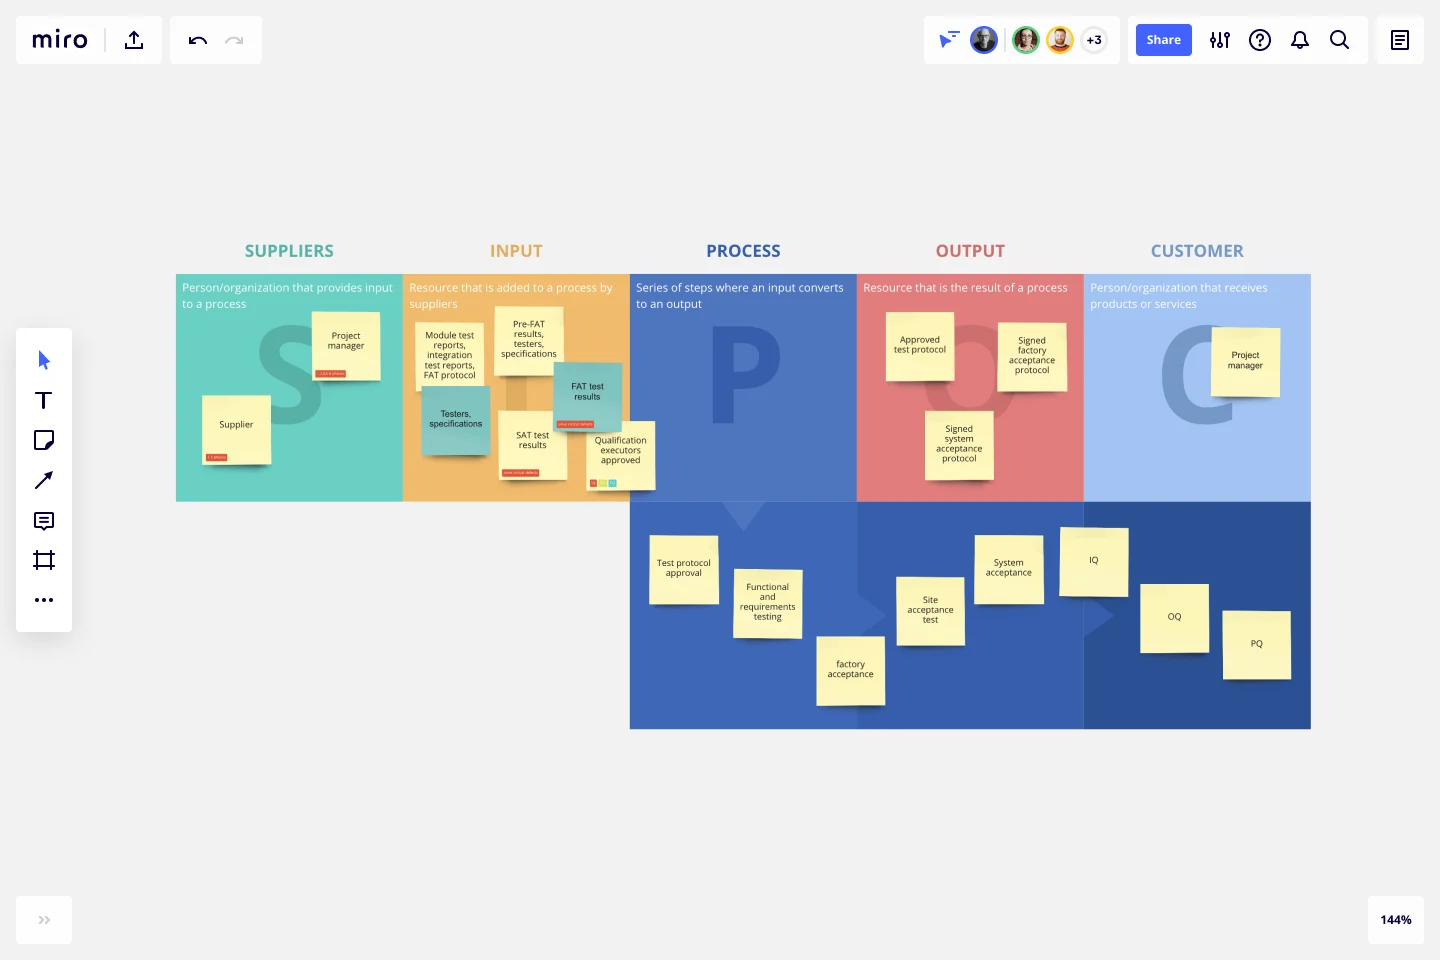
Framework: SIPOC (Suppliers, Inputs, Process, Outputs, Customers)
How: Use the SIPOC framework to comprehensively view the existing sales processes. Conduct interviews and surveys to gather detailed information from sales team members and review CRM reports to understand the current workflow and pain points.
3. Draft the flowchart
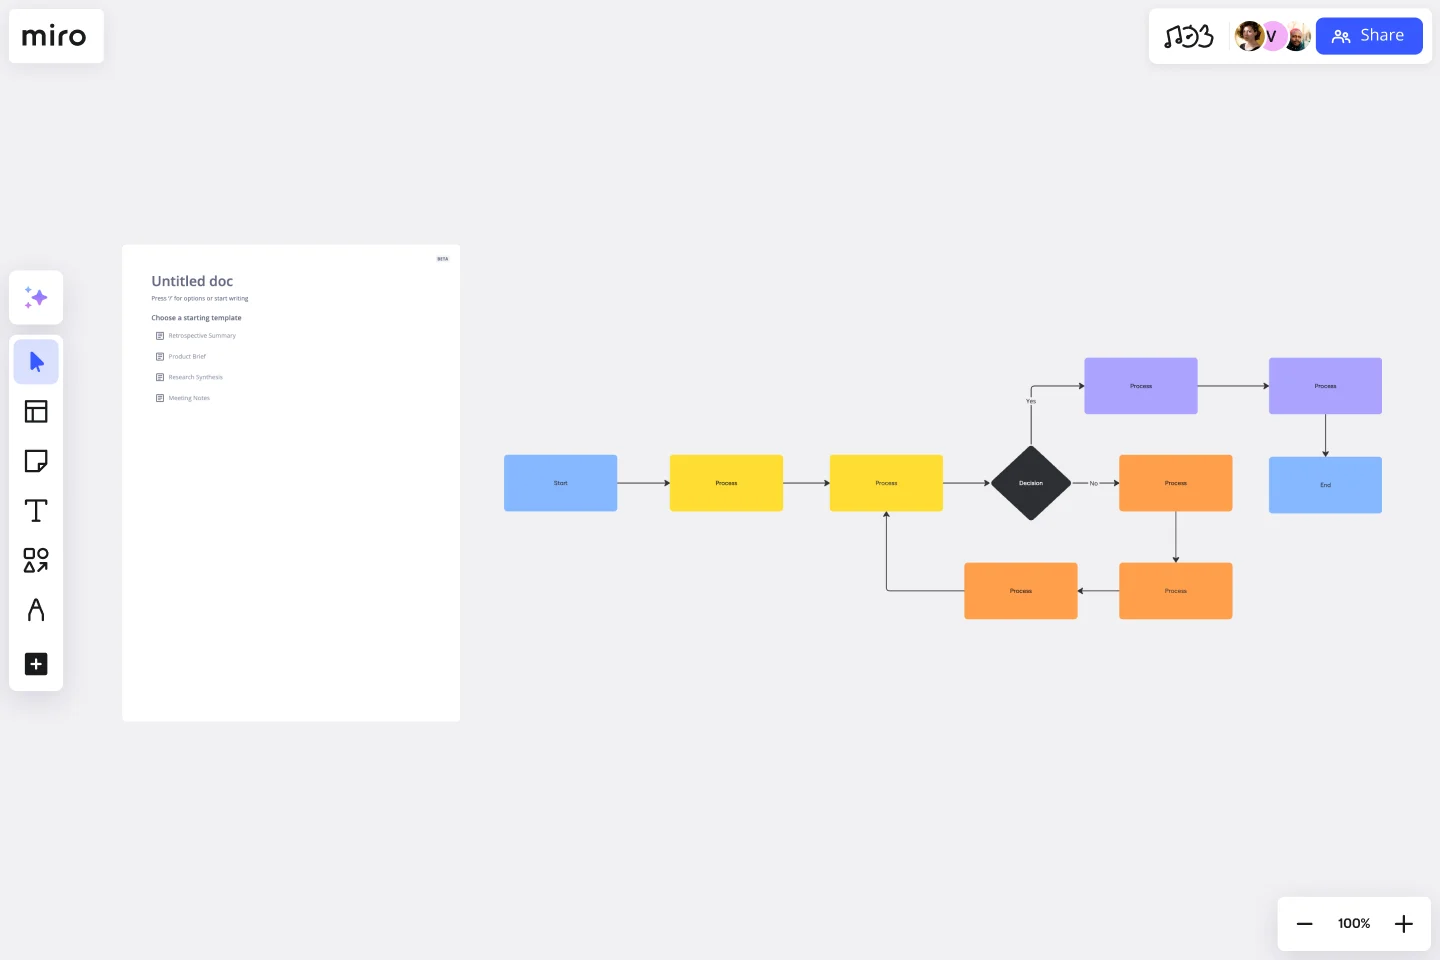
Framework: Sequential Flowcharting
How: Begin with the initial step (e.g., lead generation) and progressively build the flowchart using sequential flowcharting. This approach ensures that each step logically follows the previous one, creating a natural flow. Use Miro's templates and design tools to visually map out each process, employing appropriate symbols and arrows to depict actions and decisions.
4. Review and revise
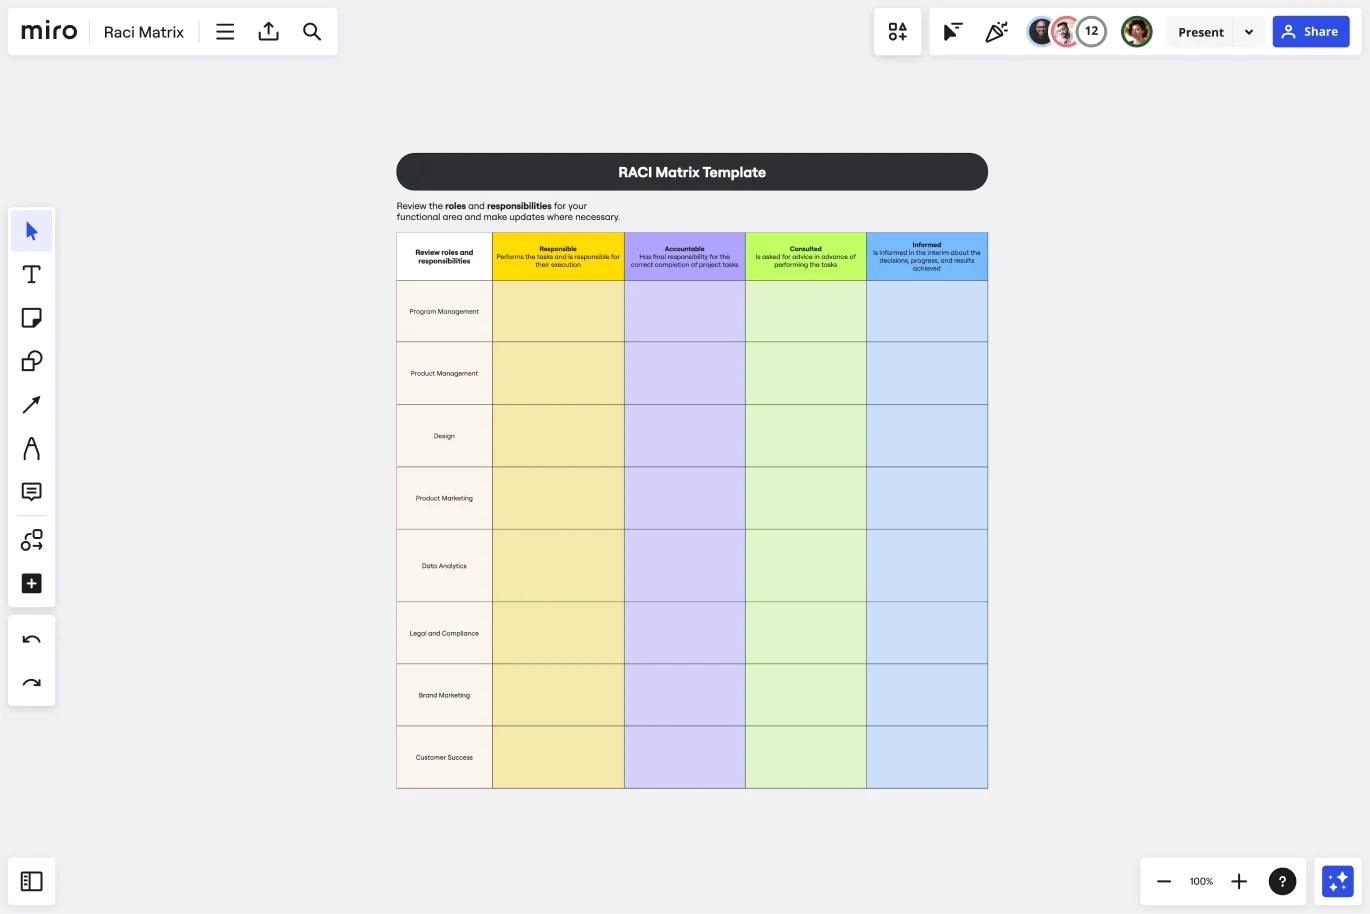
Framework: RACI Matrix (Responsible, Accountable, Consulted, Informed)
How: Implement the RACI Matrix to identify who in the team needs to review the flowchart and who makes final decisions on changes. This clarity ensures that feedback is efficiently gathered and incorporated. Use Miro's collaborative features to facilitate these discussions and make revisions directly on the platform.
5. Implement and monitor
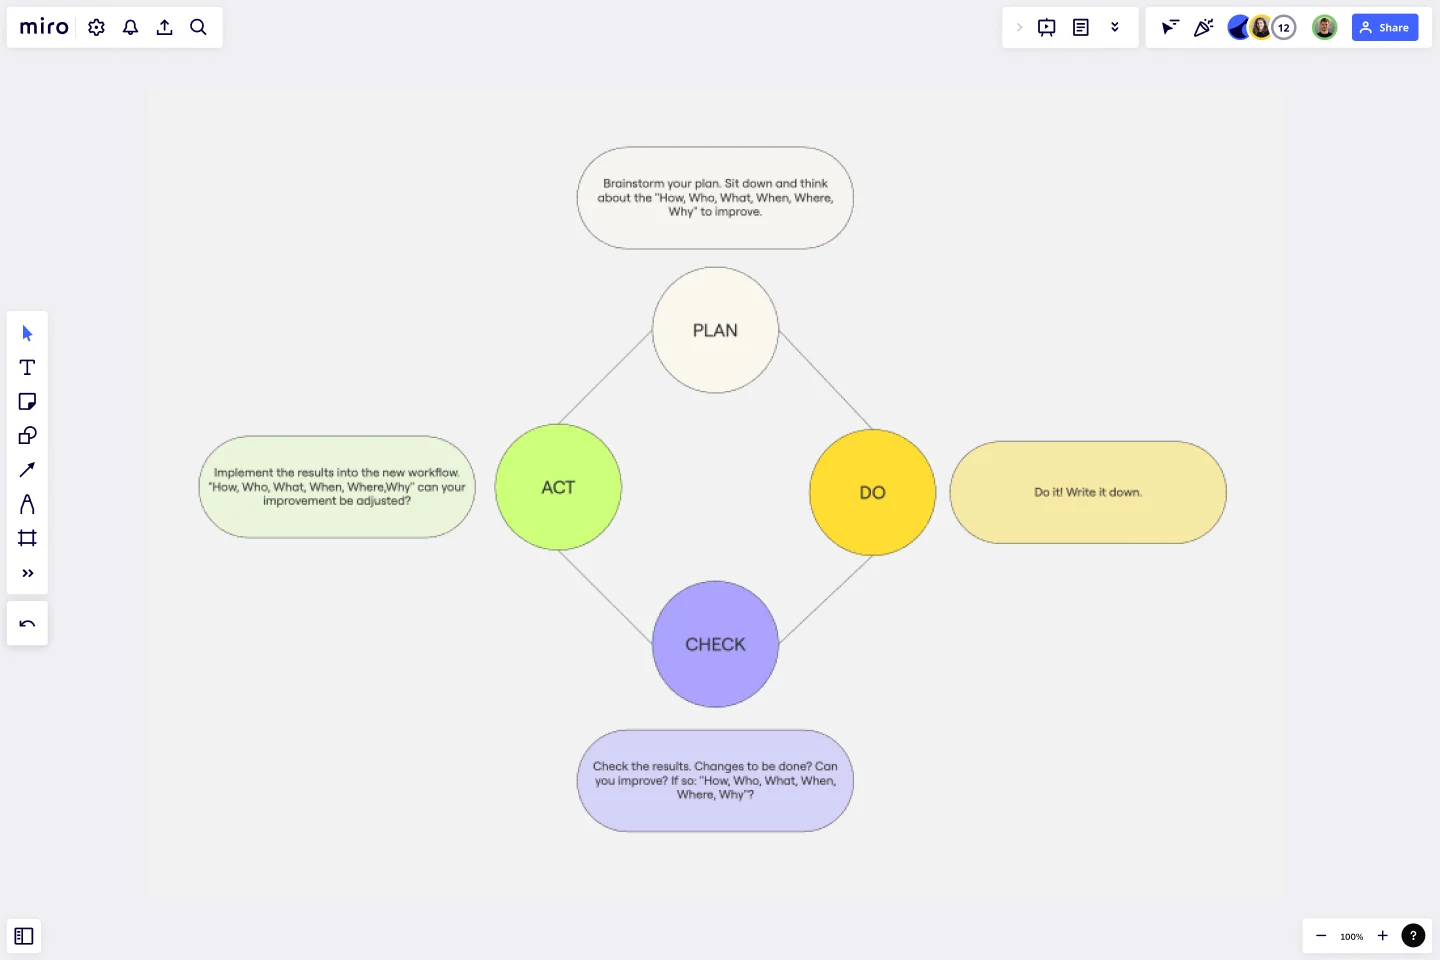
Framework: PDCA (Plan, Do, Check, Act)
How: Employ the PDCA cycle to guide the flowchart's initial rollout and ongoing management. Start by planning how to integrate the flowchart into daily sales activities, do the implementation, check the performance against KPIs in your CRM, and act on feedback to make continuous improvements.
6. Iterate based on feedback
Framework: Continuous Improvement Cycle
How: Utilize continuous improvement practices to refine the flowchart based on operational feedback and performance analytics. Regularly update the flowchart in Miro, ensuring all changes are immediately accessible to the team and reflect the most current and effective processes.
By incorporating these structured frameworks, you improve the development and refinement of your sales process flowchart, making it a dynamic tool that evolves with your sales team's needs and contributes effectively to achieving your business objectives.
Benefits of using a sales process flowchart
You might be wondering, “Why go through the trouble of creating a sales process diagram?” The answer is simple: clarity, efficiency, and accountability. A well-crafted sales process flowchart has significant advantages across various aspects of an organization:
Sales team: Provides a clear structure and standardized steps, improving understanding and reducing errors.
Marketing team: Assists in aligning marketing strategies with the sales process, improving lead quality and conversion rates.
Customer service: Helps service teams understand the sales context, enabling better support and higher customer satisfaction.
Management and leadership: Offer insights into sales process efficiency and effectiveness, helping with strategic decisions and resource allocation.
Value to business goals:
Enhanced clarity and focus: Ensures everyone is on the same page, reducing confusion and aligning efforts with business objectives.
Improved efficiency: Streamlines operations, cutting down the time it takes to close deals and reducing costs.
Better training resource: Accelerates onboarding, quickly transforming new hires into productive team members.
Increased consistency: Standardizes the sales approach across the team, ensuring a uniform customer experience.
Identifies improvement areas: Provides a framework for ongoing optimization, directly supporting continuous improvement initiatives.
These benefits highlight how a sales process flowchart is not just a tool for teams but a strategic asset for the entire organization, driving overall business success.
Pay attention to these mistakes when creating your sales process flowchart
Even the best flowchart can fall short if you make certain errors during the creation process. Here’s what to watch out for:
Overcomplicating the sales process diagram: It’s easy to get carried away by adding every possible action and decision to your flowchart. However, too much detail can make the diagram overwhelming. Focus on the key steps and keep it simple.
Forgetting about updates: A flowchart is a living document. Your sales process will evolve over time, and so should your diagram. Make sure you revisit and update it regularly to reflect any changes.
Ignoring feedback: Your flowchart is meant to be a tool for the entire team, so it’s important to gather feedback. If team members are confused by certain steps, or if they’ve noticed inefficiencies, make sure to incorporate their insights.
Failing to align with actual processes: Sometimes, what’s on paper doesn’t match reality. Make sure your flowchart reflects what’s actually happening in your sales process. Regularly review it with real-world data to keep it accurate.
Why Miro is the ideal tool for sales process mapping
Miro’s innovation workspace is designed to make sales process mapping both simple and powerful. Here’s why it’s the best tool for the job:
Effortless diagramming: Miro’s automated diagramming features let you quickly build your sales flowchart, saving time and reducing manual work. Or, use one of our ready-made flowchart templates, tutorials, and community support. Ready-to-use shapes: With Miro’s industry-standard shapes pack, you can easily use familiar symbols to create a clear and professional sales process diagram.
Infinite space: Miro’s infinite canvas lets you map out complex processes without space limitations, and you can add other relevant diagrams or notes as needed.
Seamless collaboration: Miro supports both real-time and asynchronous collaboration, so your team can work together smoothly, no matter where they are.
Integrations: Miro integrates with popular tools like CRMs and project management platforms, making it easy to pull in data or share your diagram.
With Miro, you’ll have everything you need to create, refine, and collaborate on your sales process flowchart, helping your team stay aligned and efficient, simplifying the design process, and improving the practical implementation of your sales strategy. Ready to take your sales process to the next level? Happy mapping!
Author: Miro Team
Last update: October 10, 2025