Table of contents
Table of contents
What is a Process Flow Diagram?
Summary
In this guide, you will learn:
- What a process flow diagram (PFD) is: a graphical representation of process steps.
- Key symbols used in PFDs: rectangles/ovals (steps), diamonds (decisions), parallelograms (inputs/outputs), arrows (flow).
- Typical content of PFDs: major equipment, streams, operational data, connections.
- Differences between PFDs and related diagrams: flowcharts (decision-focused), P\&IDs (detailed equipment/controls).
- How PFDs simplify complex processes: visual breakdown for communication.
- Common labeling conventions for equipment in PFDs: codes for type and location.
Collaborative AI Workflows
Join thousands of teams using Miro to build the right thing, faster.
Understanding process flow diagrams and how they’re used
When you're working with complex systems—whether in chemical engineering, manufacturing, or even software development—keeping track of all the moving parts can get overwhelming fast. That's where process flow diagrams (PFDs) come in handy. A PFD is a simple yet powerful tool that lets you visualize how different components and processes interact, helping you understand, design, and optimize your systems.
In this article, we'll break down exactly what a process flow diagram is, why it's such a valuable tool across industries, and when you should use one to make sure everything is running smoothly.
What's a process flow diagram?
A process flow diagram (PFD) is a graphical representation used to describe and document the flow and relationships between major components and processes in a system. It helps teams break down complex systems into something that's easy to follow. Even though PFDs are dominant in engineering fields, particularly chemical engineering, manufacturing, and industrial engineering, their use spans a wide range of sectors, including business and software development.
Process flow diagrams map out the journey of a particular process or system, delineating how various inputs (like materials, energy, or data) are converted into outputs (like products, services, or results). Unlike a simple list or textual description, a PFD visualizes the sequence of operations, decisions, and pathways that happen during a process. This visualization helps in identifying inefficiencies, redundancies, and critical stages within any process.
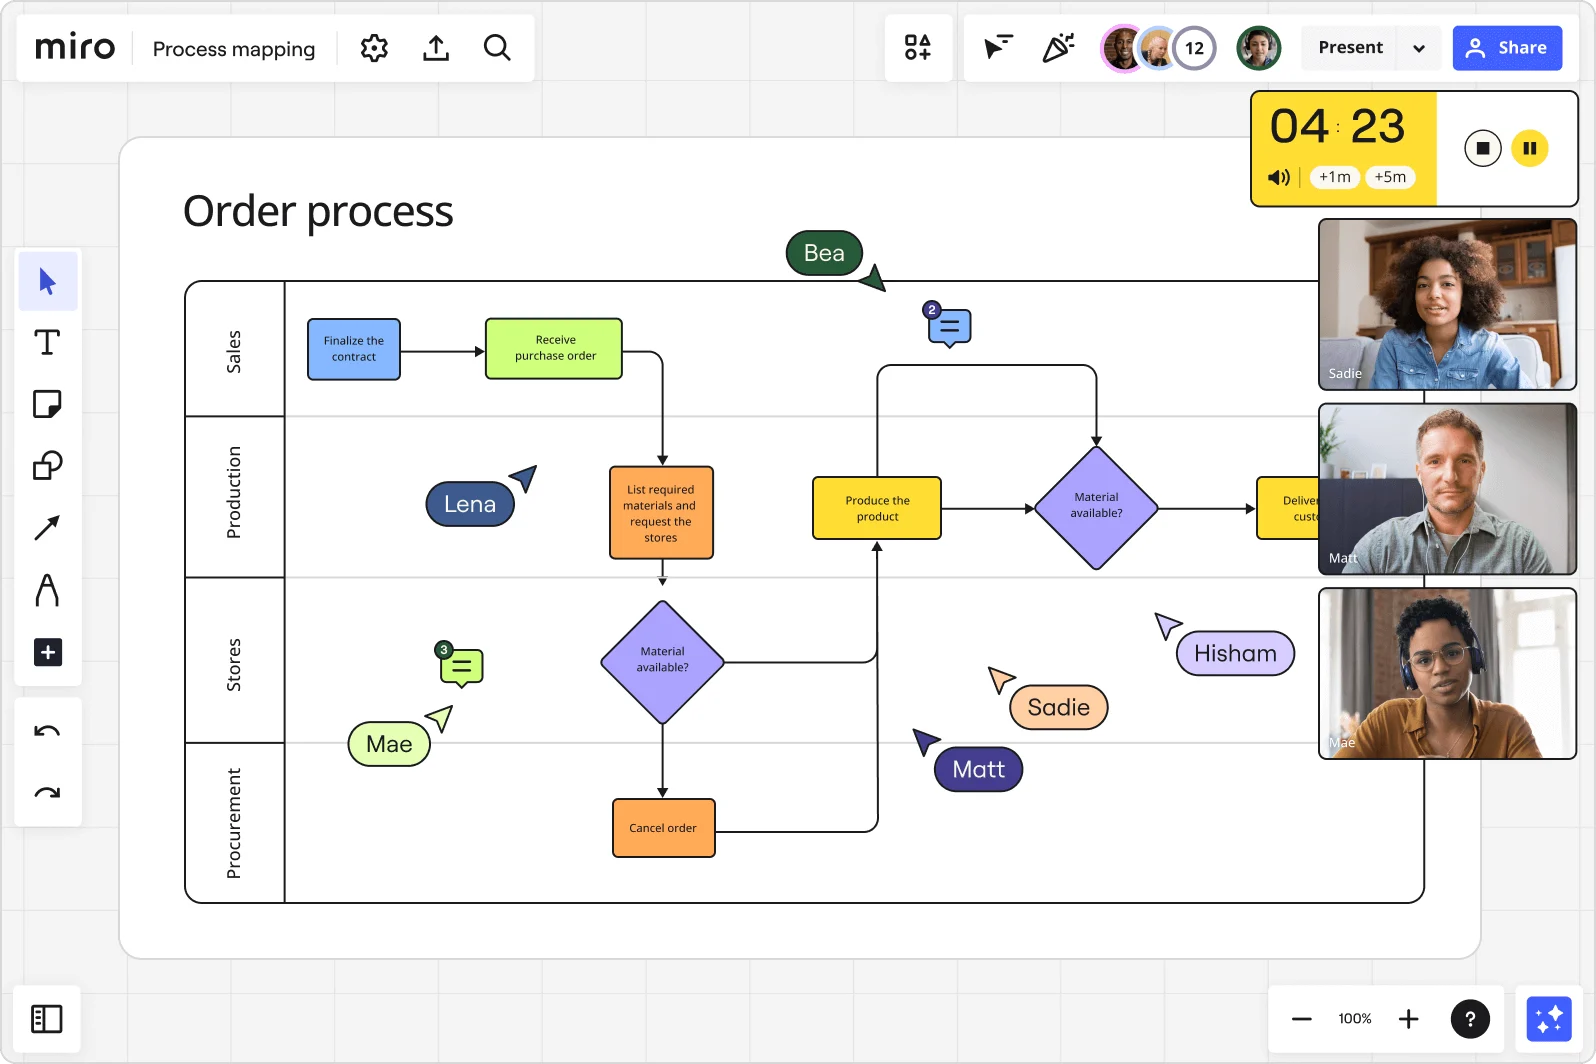
In engineering, you'll often see process diagrams used to represent how materials, energy, or data flow through a system. For example, a PFD can show how raw materials move through different stages of a chemical process or how equipment interacts on a production line. In these settings, it helps engineers visualize connections between major components—like reactors, pumps, and heat exchangers.
A well-built PFD simplifies complex systems and makes it easier to understand how everything fits together. Whether you're an engineer designing a plant, managing a production line, or optimizing a business workflow, it's the tool that turns complexity into clarity.
Key components of process flow diagrams
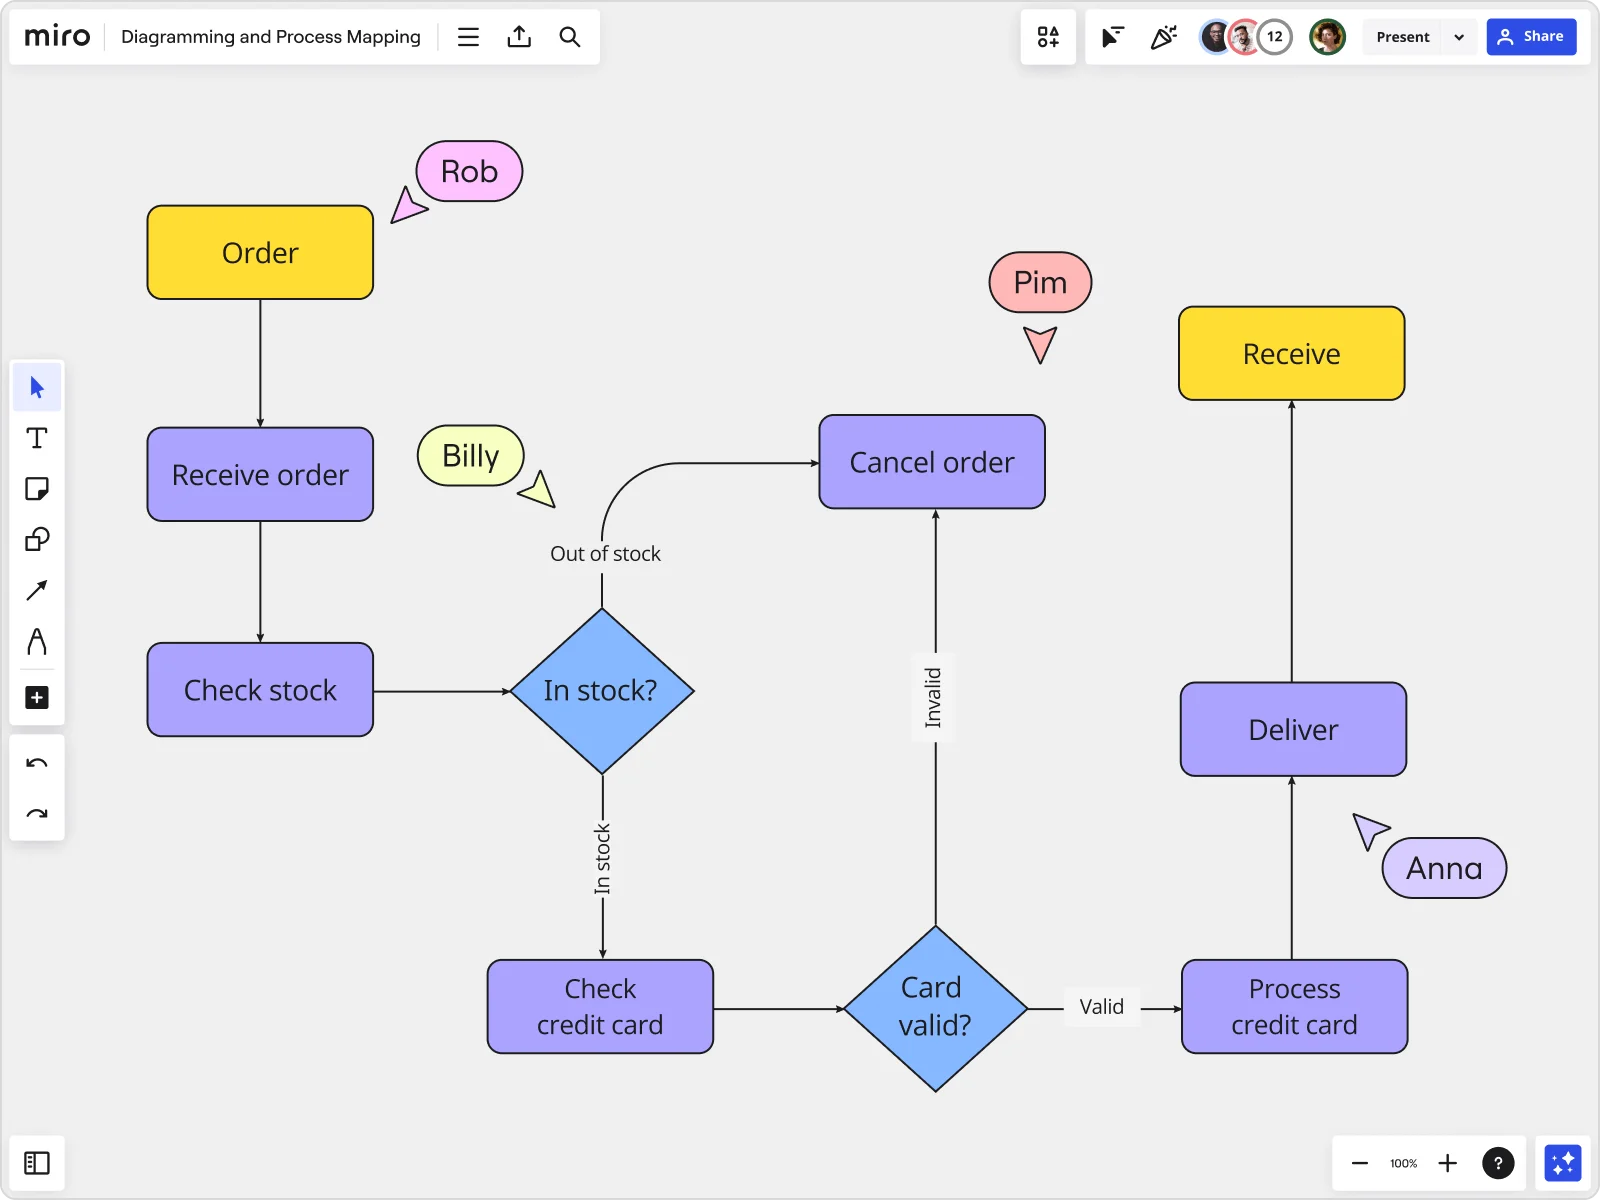
PFDs consist of various standard symbols and lines that represent different elements of a process:
Symbols: These typically include rectangles or ovals for process steps or operations, diamonds for decision points, and other shapes like parallelograms for inputs/outputs.
Arrows: They indicate the flow direction, guiding the viewer through the process from start to finish. Arrows can demonstrate the progression of time and sequence of steps.
Flow direction: Typically left to right or top to bottom, indicating the progression of the process.
Annotations: Descriptive text or labels may accompany symbols to provide additional information.
Lines: Solid lines are generally used to represent the primary sequence of steps, while dashed lines might indicate secondary or less frequent pathways.
Similarities to other diagrams
Process flow diagrams are often compared with other types of diagrams like flowcharts and Piping & Instrumentation Diagrams (P&ID):
Flowcharts
Both PFDs and flowcharts illustrate a sequence of steps in a process. However, flowcharts are generally more focused on decision-making and can be used for a broader range of purposes, including programming, workflow management, and decision analysis. Making a flowchart can display more detail in terms of decision paths and outcomes.
Piping & Instrumentation Diagrams (P&ID)
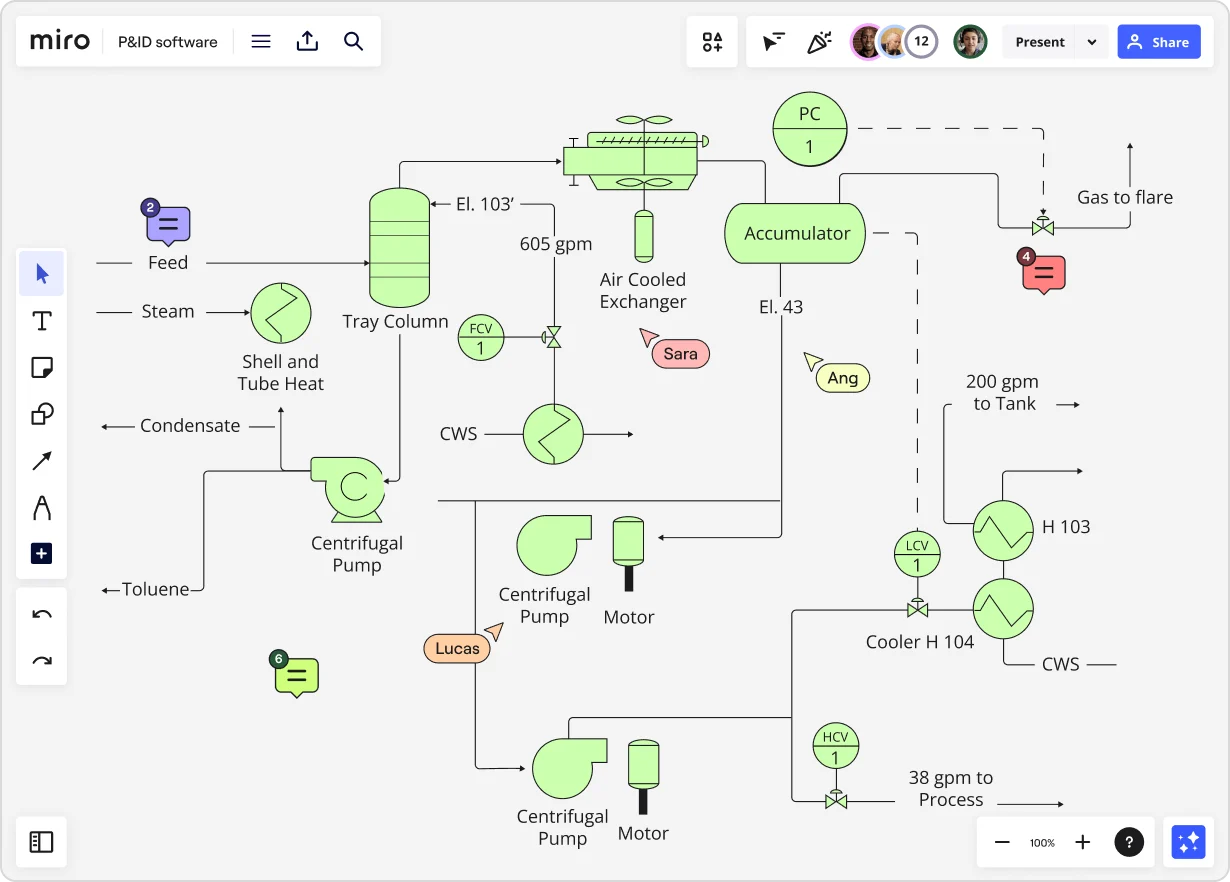
While PFDs show a broader overview of a process, P&ID diagrams are more detailed, showing all piping, instruments, and other process components. Creating a P&ID typically includes adding details like the size and type of equipment, operational controls, and safety mechanisms, which are not detailed in PFDs.
How to make a process flow diagram
Creating a process flow diagram is a structured approach to visualizing and understanding the steps and flow of a process. Whether you're mapping a complex manufacturing operation or a simple business procedure, a clear and accurate PFD is invaluable. Let's dive into the steps necessary to create an effective process flow diagram.
1. Identify the process or system
Clearly define the scope and boundaries of the process you intend to diagram. Determine the starting point, end point, and the level of detail required.
2. Gather necessary information and requirements
Collect all relevant data, including the steps involved, resources needed, time taken for each step, and any dependencies. Consulting with process experts and stakeholders at this stage is crucial.
3. Define and list the steps or stages involved
Break down the process into individual steps or stages. Ensure that each step is clear and concise. This breakdown will form the backbone of your PFD.
4. Choose symbols and notation standards
Decide on the set of symbols and notations you will use. Consistency is key here. Common process flow diagram symbols include ovals for start/end points, rectangles for process steps, diamonds for decision points, and arrows for the flow direction.
5. Sketch the diagram
Start your diagram with the initial input, and then sequentially map each step in the process towards the final output. Use the chosen symbols and ensure that the flow is logical and straightforward. Tools like Miro allow you to drag and drop shapes and arrows, simplifying this process and making it easy to adjust your diagram on the fly.
6. Verify and validate the diagram with stakeholders
Once your diagram is complete, review it with key stakeholders. This step ensures that the PFD is accurate and fulfills its intended purpose. Feedback may lead to revisions for clarity or completeness.
By following these steps, you can create a diagram that effectively communicates the nuances of your process, enhancing understanding, and efficiency. A well-crafted PFD not only serves as a tool for documentation but also acts as a roadmap for process improvement and troubleshooting.
How to read a process flow diagram
Reading and interpreting a process flow diagram is a critical skill for anyone involved in managing, analyzing, or improving processes. Here are some tips on how to effectively read and understand these diagrams:
Understanding symbols and notation
Each symbol in a PFD is standardized and represents a specific part of the process:
Ovals or Ellipses usually represent the start or end of a process.
Rectangles or Boxes indicate a process step or an action in the sequence.
Diamonds are generally used for decision points where the process might branch based on a yes/no question or other criteria.
Arrows show the flow direction, linking different steps and indicating the sequence of operations.
Parallelograms often depict inputs (like raw materials or data) entering the process or outputs (like finished products or reports) resulting from the process.
Familiarity with these symbols is the first step in understanding a PFD. Different industries might adopt specific variations or additional symbols, so it's important to create a legend or key on your diagram for reference.
Following the flow of the process (start to end)
To read a PFD:
- Start at the designated beginning (usually marked by an oval labeled "Start").
- Follow the arrows from one box (step) to the next. The arrows guide you through the process sequence.
- Pay attention to the flow, noticing how inputs are transformed into outputs through various process steps.
Interpreting common elements
Within the diagram, there are several elements which indicate steps along the process:
Decision points (Diamonds): At each decision point, the process might split into different paths based on certain criteria. Examine the question or decision criteria within the diamond and follow the path that corresponds to each possible answer or outcome.
Operations (Rectangles): Look at each rectangular step to understand the specific action or operation happening at that stage.
Delays: Delays or waiting periods might be indicated by specific symbols or annotations. Note where these occur, as they can be key areas for process improvement.
Inputs/Outputs (Parallelograms): Identify what is needed to complete each step (input) and what each step produces (output), which is crucial for understanding the process's efficiency and effectiveness.
Tips for using the process diagram for improvements or troubleshooting
Knowing how to read a PFD is critical to understanding a process. Being able to analyze the diagram can uncover opportunities for process optimization or troubleshoot problem areas. Here are some tips to doing this effectively:
Look for bottlenecks: Areas where the flow converges from multiple paths or where there are delays can indicate bottlenecks.
Evaluate decision points: Decision points can often be simplified or improved to enhance process efficiency.
Assess inputs and outputs: Review whether the inputs and outputs at each step are optimal and necessary. Unnecessary inputs or wasteful outputs are opportunities for improvement.
Understand the big picture: Step back and look at the process as a whole. Understanding the overall flow and how each part interconnects can reveal insights into the process's effectiveness and efficiency.
Consult with stakeholders: Discuss the PFD with team members or stakeholders who work with or are affected by the process. Their insights can be invaluable in identifying areas for improvement.
When should you use a process diagram?
You might wonder, "Do I really need a process flow diagram for this project?" The short answer: if your process involves multiple steps, interdependent components, or you need a clear, high-level view of how everything fits together—yes! A PFD gives you that clarity and makes sure nothing falls through the cracks.
Here are some common scenarios where a PFD is a lifesaver: When designing or refining a process: Whether you're setting up a new chemical plant, updating a manufacturing line, or optimizing a business workflow, a PFD lets you map everything out visually. It's like creating a blueprint before you start building. When troubleshooting issues: If something in your system isn't working—like a blocked pipeline or a production line delay—following the flow in your PFD helps you find the problem and fix it fast. When scaling up a system: As your processes grow, a PFD makes it easy to see where you need to add capacity—whether that's increasing throughput in manufacturing or expanding data handling in software systems. For safety checks and compliance: In industries like chemical or industrial engineering, PFDs are used to identify risks and ensure processes meet safety and compliance standards. Visualizing these risk points—like pressure zones or hazardous materials—helps you plan and mitigate effectively. When onboarding new team members: Bringing new engineers into a project? A PFD gives them a clear overview of how everything works, so they can hit the ground running without needing to dive into every technical detail from day one. For managing workflows across industries: Even in business and software development, a PFD is an invaluable tool for mapping out workflows or tracking system interactions. It helps you streamline operations and make sure your team is working efficiently.
Whether you're in engineering, manufacturing, or business, a process diagram offers that much-needed clarity when managing complex systems. It's a simple, visual way to ensure everyone understands how things work, and it's perfect for keeping your process smooth, efficient, and safe.
Process flow diagram examples
PFDs are used across a range of industries where processes are repeated and integral to success. Here is a look at examples from different sectors, each highlighting the unique aspects and applications of PFDs.
Simple process flow diagram
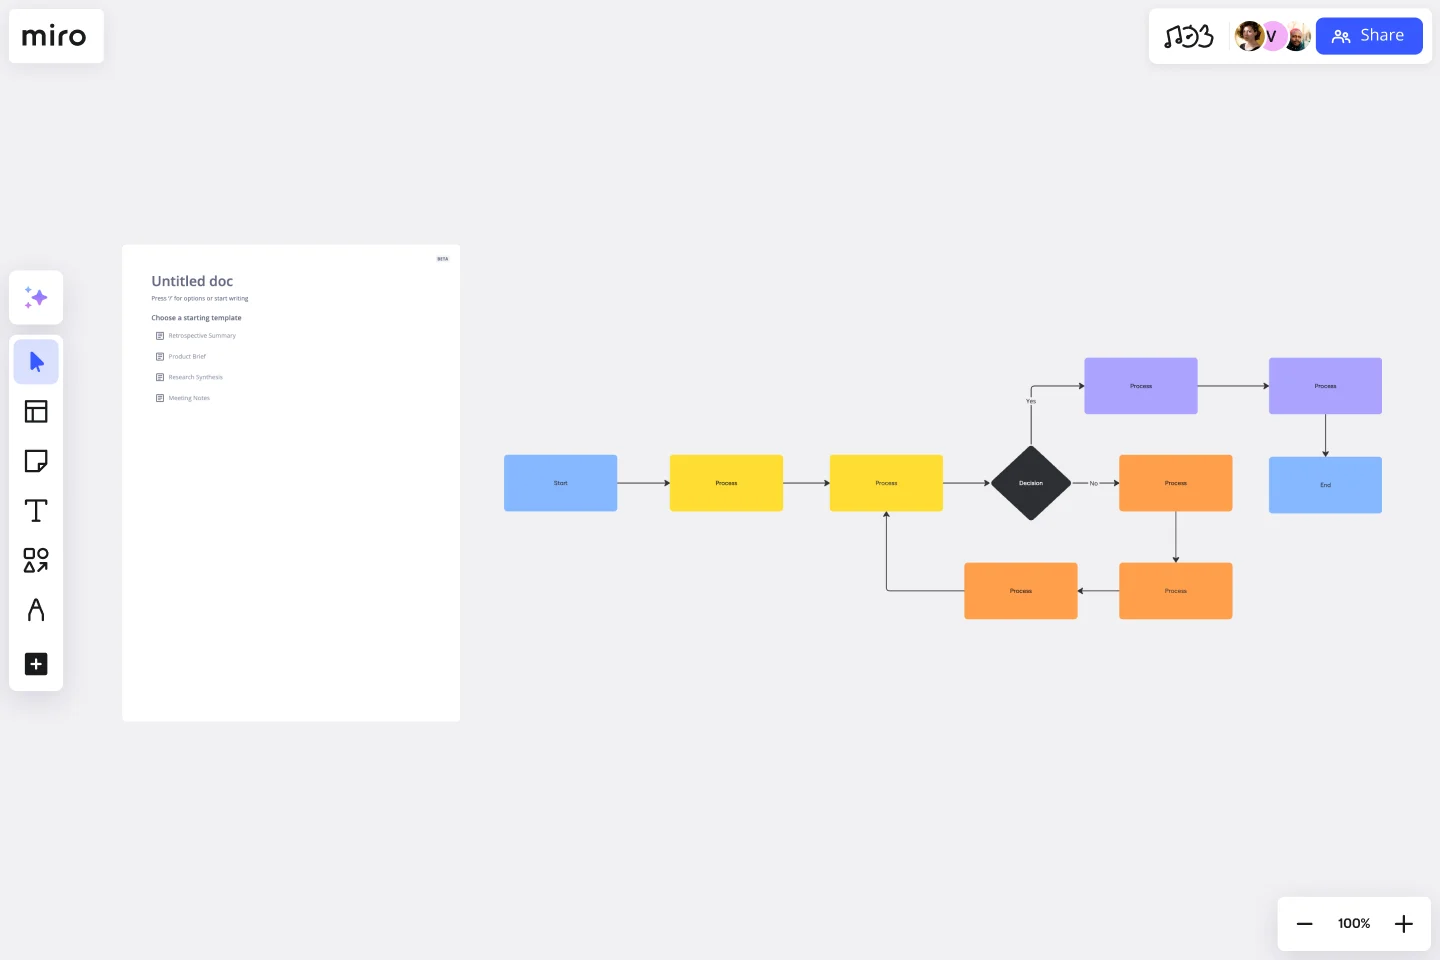
A simple process flow diagram is often used to illustrate the basic steps of a straightforward process. It's common in training materials and initial project planning phases to give stakeholders an easy-to-understand overview. These diagrams are typically clear and concise, avoiding overly complex symbols or too many steps.
Imagine a simple process flow diagram for a customer service process:
Start: Customer Inquiry.
Process Step 1: Inquiry received and categorized.
Decision Point: Is more information needed? If yes, request more information; if no, proceed to step 4.
Process Step 2: Resolve inquiry and provide feedback.
End: Closure of inquiry.
This diagram efficiently communicates the essential steps of addressing customer inquiries, highlighting potential decision points and their consequences.
Manufacturing process flow diagram
In manufacturing, PFDs often include steps like raw material procurement, assembly, quality checks, and packaging. These diagrams are detailed, indicating the flow of materials through various pieces of equipment and detailing how different components come together to create a finished product.
Consider a PFD for an electronics manufacturing process:
Start: Receipt of raw materials (e.g., circuit boards, resistors).
Process Step 1: Assembly of electronic components.
Quality Check: Inspection for assembly defects.
Decision Point: If defects are present, send to rework; if not, proceed.
Process Step 2: Final assembly and packaging.
End: Finished product ready for shipment.
This diagram not only shows the production flow but also incorporates quality assurance checks essential in manufacturing.
Data migration process flow diagram

Data migration involves transferring data from one system or storage unit to another, which can be complex due to varying formats, data structures, and the risk of data loss or corruption.
A typical data migration PFD might include:
Data Assessment: Evaluating the data to be migrated for format, volume, and structure.
Planning: Mapping out the migration strategy and tool selection.
Data Preparation: Cleansing and formatting data.
Migration: Physically moving the data to the new system.
Verification: Ensuring data integrity and completeness post-migration.
Process flow diagrams in chemical engineering
In chemical engineering, PFDs are used to depict the flow of chemicals and the sequence of chemical processing steps. They often show the movement of raw materials through different reactors and processing units, leading to the final product.
Chemical PFDs use specific symbols to represent reactors, separators, heat exchangers, and other specialized equipment. Distillation columns, filters, and mixers are also commonly depicted, each with unique symbols reflecting their function.
DevOps process flow diagram
In DevOps, PFDs help visualize the stages of software development, integration, testing, deployment, and monitoring, supporting continuous integration and continuous delivery (CI/CD) practices.
A DevOps PFD might include:
Start: Code Commit.
Build Phase: Compilation and build of the software.
Test Phase: Automated testing to identify bugs.
Deploy Phase: Code is deployed to a staging environment.
Release Phase: Deployment to the production environment.
Monitor and Feedback: Continuous monitoring and feedback for improvements.
Each of these examples demonstrates how PFDs can be tailored to specific industries and processes, providing clear and actionable insights into complex systems and workflows.
Create a process flow diagram with your team
From the straightforward steps in a simple process to the complex operations in manufacturing and chemical engineering, PFDs help in visualizing the flow of tasks and materials, identifying bottlenecks, and optimizing workflows.
Remember, the key to creating effective PFDs lies not just in understanding the process but also in using the right tools to bring these diagrams to life. Miro offers an intuitive, collaborative platform for crafting detailed process flow diagrams, perfect for teams looking to streamline their processes and increase efficiency. Whether you're a project manager, an engineer, or an IT professional, Miro's easy-to-use interface and powerful features make it an excellent choice for creating comprehensive and clear PFDs.
Ready to transform the way you visualize and manage processes? Sign up for free to Miro today, and start creating dynamic process flow diagrams to guide your projects to success.
Author: Miro Team
Last update: October 10, 2025