How to make a flowchart: An easy step-by-step tutorial
Summary
In this guide, you will learn:
- How to define your flowchart's purpose
- The benefits of using flowchart templates
- Key steps to map out processes
- How to use Miro’s tools for creation
- Best practices for clear, scalable flowcharts
- Ways to share and collaborate on your flowchart
Collaborative AI Workflows
Join thousands of teams using Miro to build the right thing, faster.
Your guide on how to make a flowchart
Flowcharts, with their visual simplicity and structured layout, are indispensable tools for conveying intricate processes. They help break down complex information into simple, easy-to-follow steps. However, creating a flowchart can seem daunting, especially if you're unsure where to start or what tools to use.
In this simple five-step guide, we’ll cover everything you need to know about how to make a flowchart.
Whether you're creating a flowchart to explain a complex process to your team or creating one for yourself to organize your thoughts, this guide will help you create clear and effective flowcharts that anyone can understand.
How to create a flowchart in 5 easy steps
Learning how to create a flowchart may seem daunting at first, but by following these five easy steps, you'll easily map out any process or workflow. You can make a flowchart from scratch or use flowchart templates where the shapes and arrows are pre-loaded on the board.
Step 1: Determine the purpose and scope of the flowchart
Defining the purpose and scope is crucial, as it helps to focus on what needs to be in the flowchart and what shouldn't be. It also guarantees that the flowchart accurately represents the process it is trying to depict. For a flowchart example, consider mapping out a simple project timeline to better visualize the importance of a clear scope.
Step 2: Identify the steps and sequence of the process
Breaking down a process into smaller basic steps should involve anyone who's part of the process. Identifying the correct sequence and avoiding missing critical steps or duplicating others is important.
Start by adding all the steps that need to be covered as shapes on a blank board, then begin arranging them in the correct order.
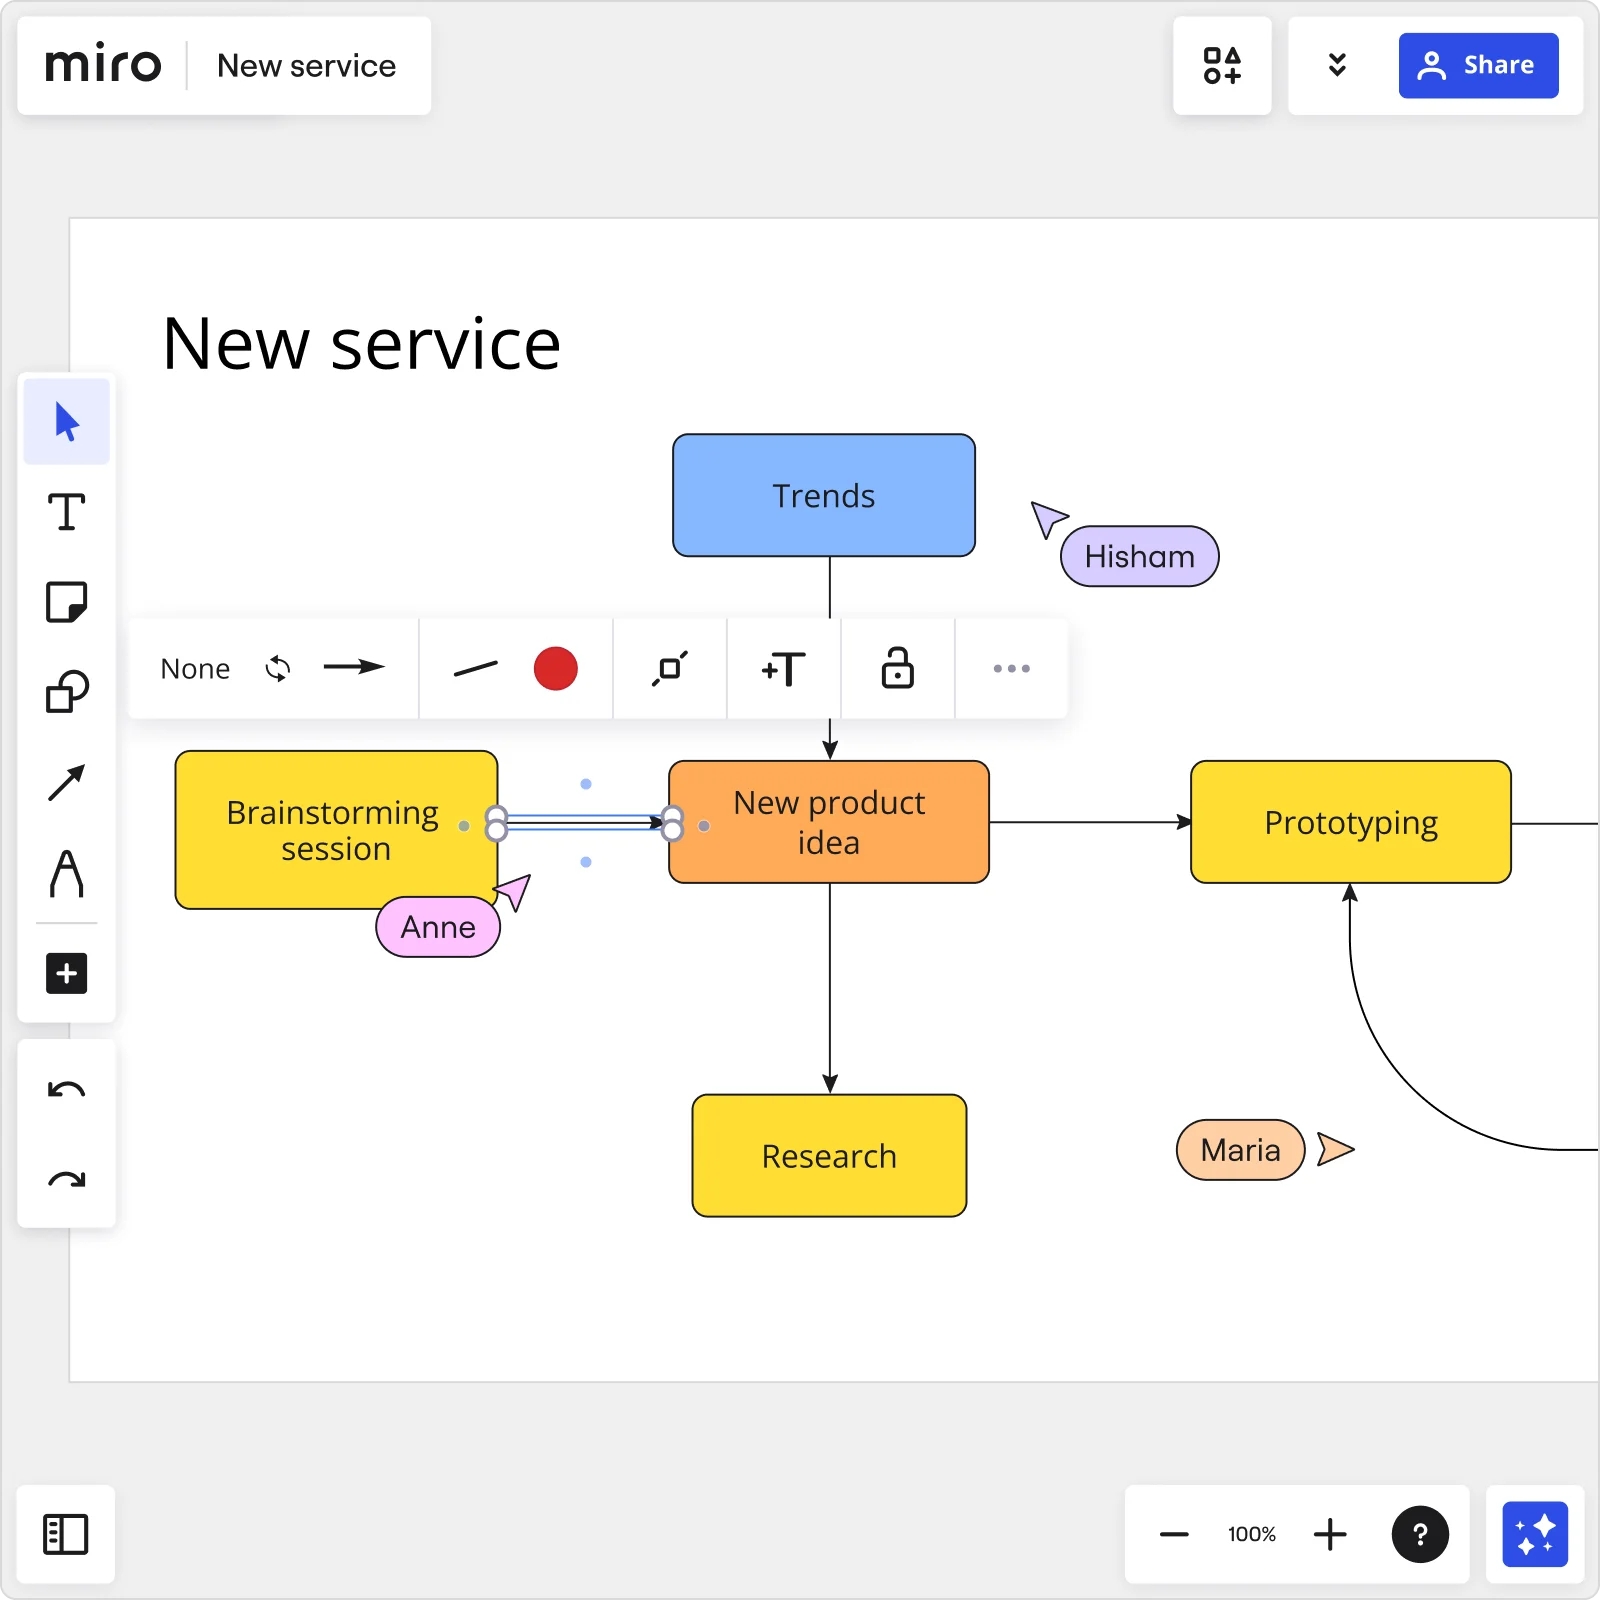
Step 3: Choose the appropriate symbols and shapes
Once all the steps are laid out, you’ll need to make sure they’re represented with the right shape. You can easily change existing shapes on your board to correspond with the right flowchart symbol and what it represents.
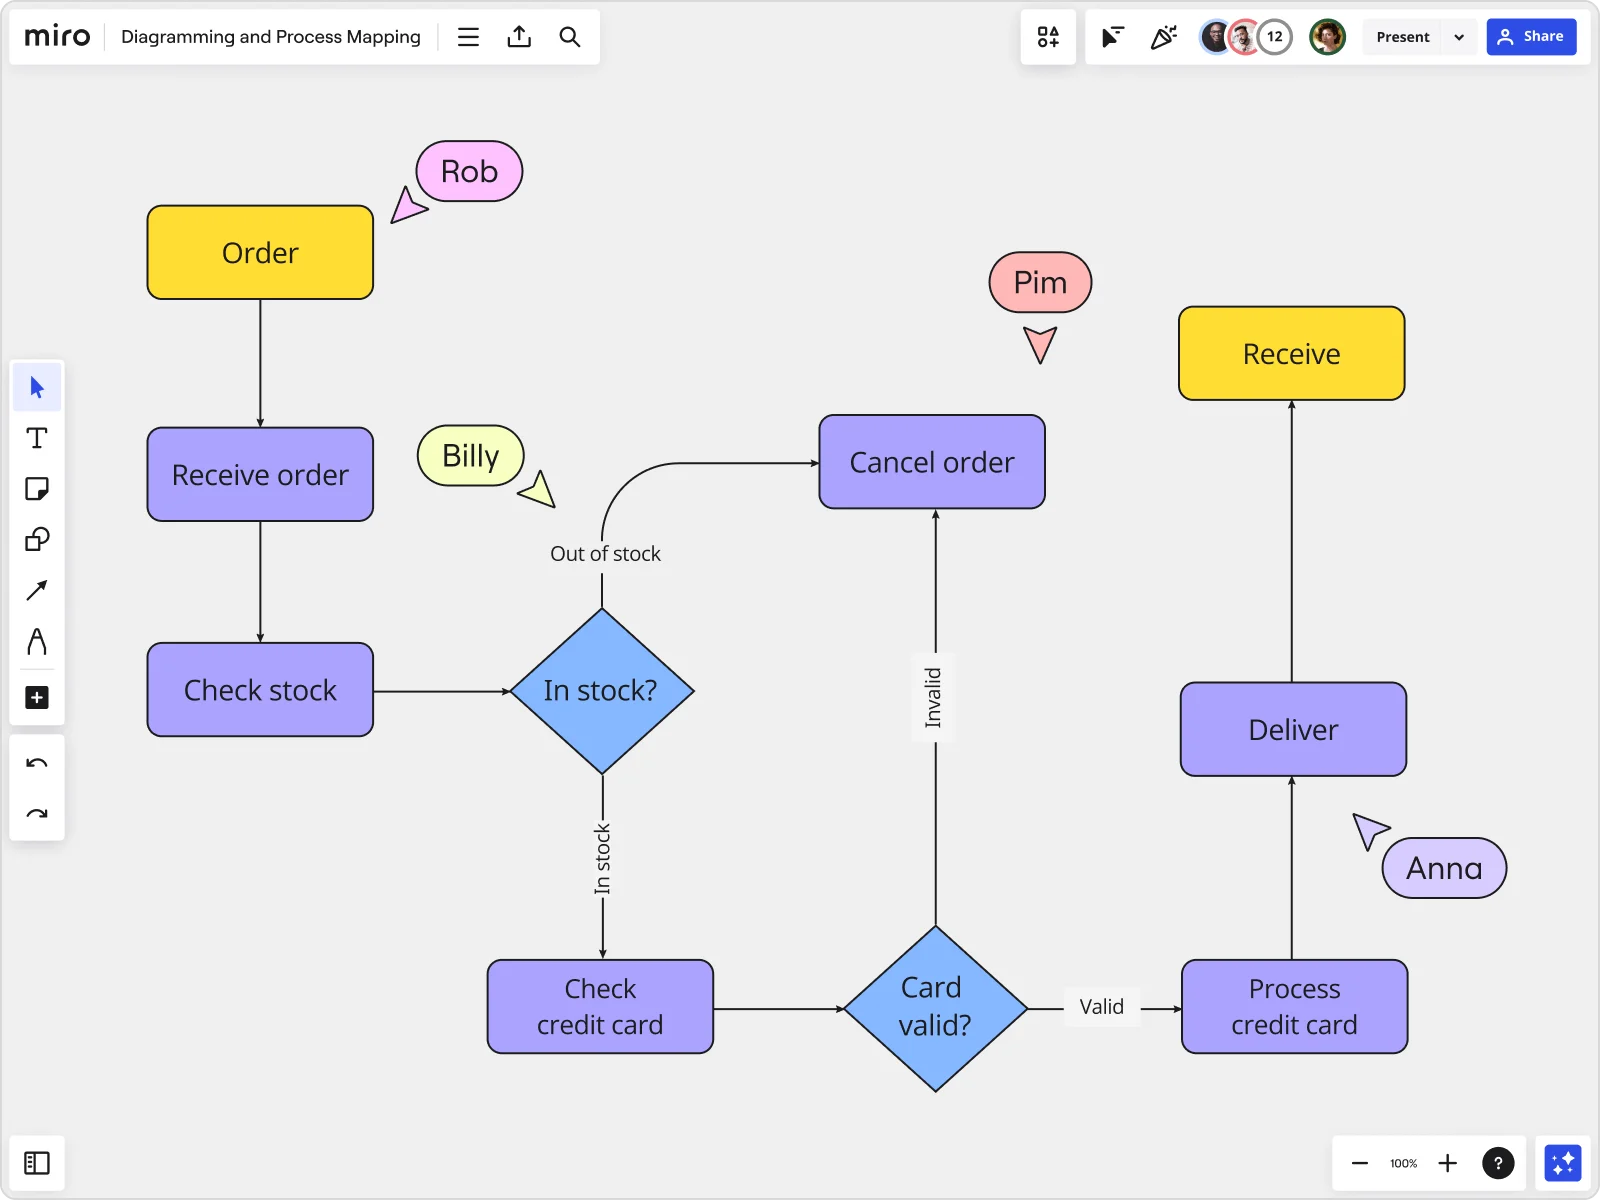
Step 4: Draw the flowchart
Drawing the flowchart is where the creative process begins. With the shapes arranged in the right sequence, begin adding connection lines and arrows between steps. You can add labels to the connection lines and easily move the elements around to adjust the order as needed.
Step 5: Test and improve the flowchart
Testing the flowchart is important to ensure it accurately represents the process. This includes reviewing the flowchart with others involved in the process to get their feedback. Once feedback is received, the flowchart can be improved and modified accordingly.
Why you need a flowchart
Now that you know how to make a flowchart, let’s talk about why it’s beneficial to begin with. A flowchart is useful for visualizing complex processes and identifying bottlenecks or refinement areas.
Flowcharts are found in a variety of industries, from software development to manufacturing and logistics. They map out processes and identify opportunities for optimization.
They're also used in project management to help teams understand the sequence of tasks and the dependencies between them.
Additionally, flowcharts document processes, which are crucial for:
- Training new employees
- Improving quality control
- Following regulations
- Understanding a business process
- Identifying bottlenecks and inefficiencies in a business process
When to use a flowchart
Flowcharts are useful in a variety of situations to help with planning and decision-making. Here are some common types of flowcharts and their applications:
Process flowchart:
- Use it to: plan a new project, a basic process, or map out an organization.
- Helps to: better inform decisions by depicting a process step-by-step.
- Mostly used by: engineers and software designers.
Workflow chart:
- Use it to: manage workflows and map business functions.
- Standardize procedures by: integrating automated processes with manual tasks.
- Mostly used by: business and project managers.

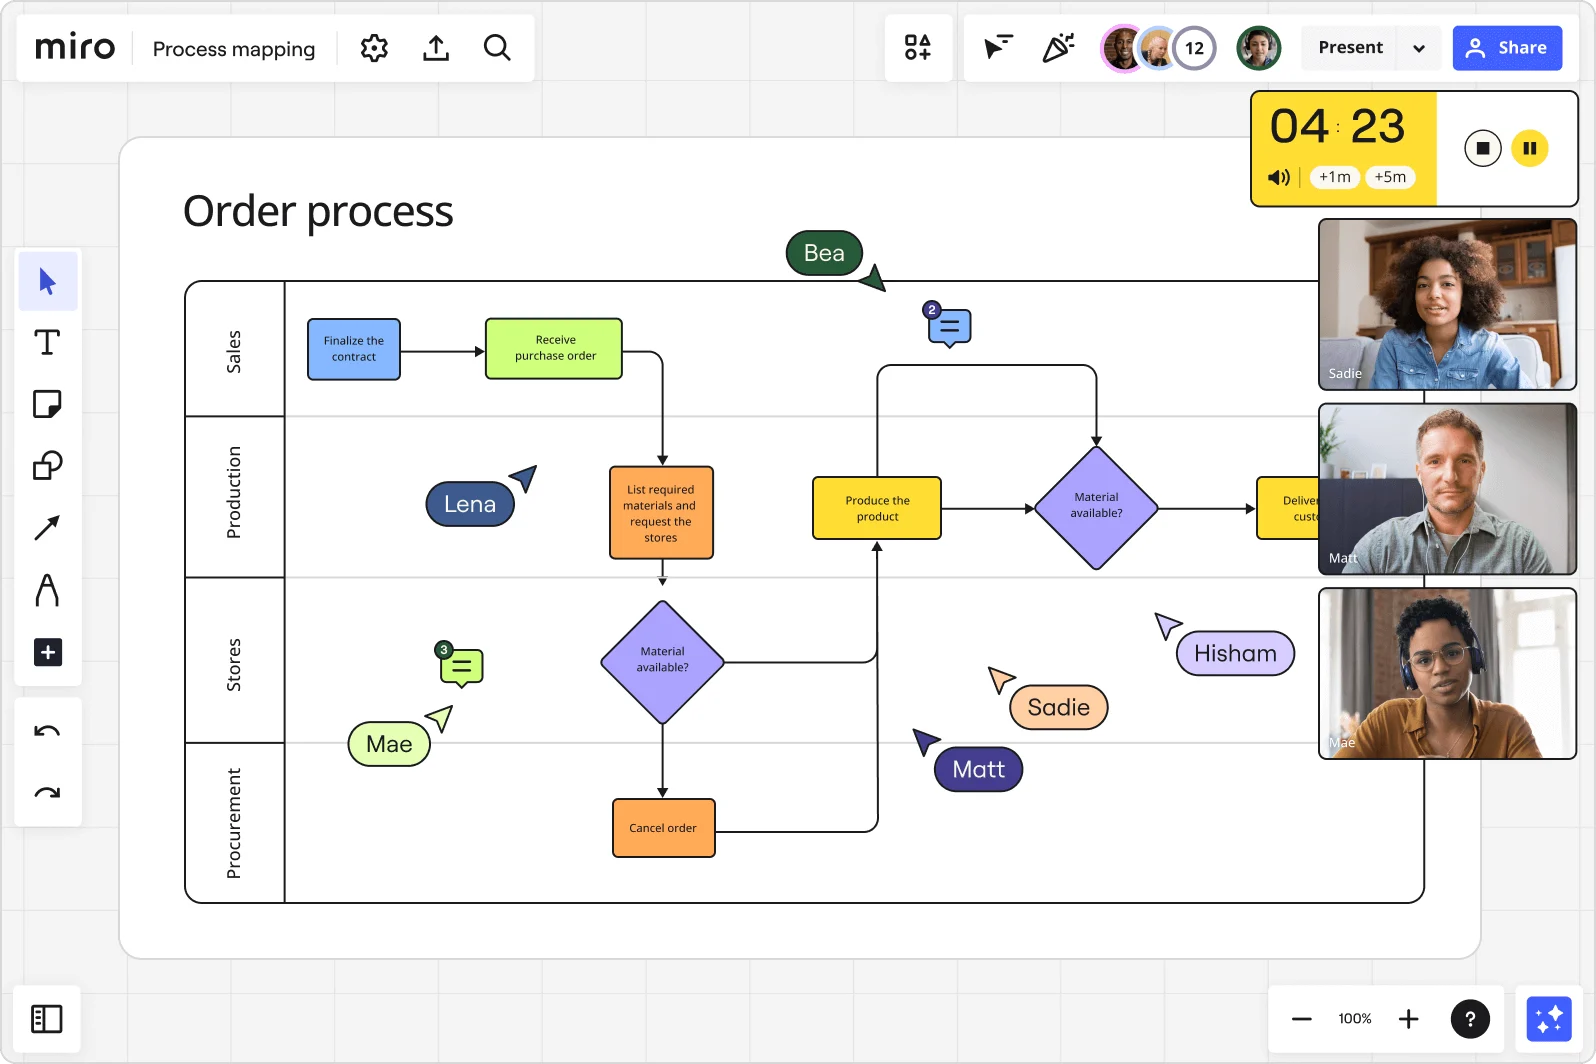
Swimlane flowchart:
- Use it to: manage workflows across different departments.
- Enhances collaborative processes by: picturing processes in different parts of an organization.
- Mostly used by: cross-functional teams.

Data flowchart:
- Use it to: bridge communication between systems and users.
- Helps to: inform data-oriented decisions by showing how data is processed.
- Used by: a range of professionals, from engineers to marketers.

How to make a flowchart that works: top best practices to follow
When you're building out a flowchart, it's not just about mapping steps and decisions – it's about making everything clearer for your team. Whether you're leading product development or running a dev sprint, flowcharts can simplify even the most complex systems. Let's break down some of the best practices for creating flowcharts, and just as importantly, the mistakes you'll want to avoid.
Start with a clear purpose
Every flowchart should have a purpose, and it's critical to define that upfront. Is this chart meant to show a user journey? Are you mapping a backend process? Knowing the goal will help you make better decisions on what to include and where to streamline. Miro's advanced diagramming features take the guesswork out of the process, helping you start faster with the right structure.
Mistake to avoid: Don't dive in without a plan. Skipping this step often leads to a flowchart that's too complex or missing key elements. Before you start diagramming, get clear on the outcome you're working toward.
Keep it simple and scalable
A cluttered flowchart won't get anyone on the same page. To keep things simple, focus on the key steps, use consistent shapes, and avoid stuffing too much information into a single diagram. Miro's infinite canvas ensures that as your ideas expand, your flowchart has the room to grow with it – no need to cram everything into tight spaces.
Mistake to avoid: Overcomplicating your flowchart. It's tempting to add every possible decision point, but doing so can make your chart hard to follow. Instead, stick to essential details and break things into smaller diagrams if needed.
Use standard symbols to avoid confusion
When everyone understands your flowchart at a glance, collaboration becomes a lot smoother. Miro's industry-standard shapes pack makes it easy to choose the right symbols, so your flowcharts look professional and are easy to interpret – no extra explanation required. This helps developers, PMs, and other stakeholders follow along without needing a manual.
Mistake to avoid: Don't invent your own symbols. Custom shapes might make sense to you, but they can confuse others. Stick with standard symbols like rectangles for processes, diamonds for decisions, and so on.
Customize, but keep readability top of mind
Customization can make your flowchart feel more personal and tailored to your project. Miro's customization options let you tweak colors, fonts, and shapes so that the diagram fits your brand or team preferences. But keep readability in mind – use color strategically to highlight important parts without overwhelming the viewer.
Mistake to avoid: Going overboard with customization. Too many fonts or colors can distract from the flow. Stick to a clean, professional look, using customization to emphasize key points rather than decorating the entire chart.
Collaborate early and often
Flowcharts are powerful tools for team alignment, so don't wait until the last minute to bring people in. With Miro's collaboration tools, you can invite your team to give feedback in real-time or asynchronously – whichever works best for them. This makes it easy to refine and iterate, ensuring your flowchart is as accurate and useful as possible. Plus, you can embed your flowchart in tools like Confluence or Asana, so it's accessible where your team works.
Mistake to avoid: Working in isolation. Waiting until your flowchart is "perfect" to share can slow down progress and lead to missed insights. Get feedback early and often to spot gaps or potential confusion before finalizing your chart.
Connect your flowchart to your workflow
Your flowchart shouldn't live in a vacuum. Miro's integration with tools like Jira allows you to tie your diagram directly into your team's workflow. For example, if a flowchart step requires action, you can convert that directly into a Jira card, saving time and reducing friction between planning and execution.
Mistake to avoid: Letting your flowchart gather dust. Make sure it's connected to the rest of your work, so your team can turn those mapped-out ideas into action.
Use Miro to easily create a flowchart
Flowcharts are powerful tools that help you visually communicate complex information in a simple, easy-to-follow format. By following the simple steps and strategies outlined here, you can master the art of creating clear, concise, and informative flowcharts. Sign up for free to Miro to get started today.
Author: Miro Team
Last update: October 10, 2025